A clean setup can still fail when price starts whipping around and your stop sits exactly where a normal swing now reaches. Most newer traders call that bad luck. It usually isn't. It's a volatility problem.
If you want a practical way to think about what is volatility in trading, treat it like weather at sea. Calm water and rough water both allow movement, but they demand different boats, different speed, and different risk controls. If you want a broader market primer before getting into the prop-trading angle, this guide from Colibri Trader helps decode market volatility.
Introduction
Volatility decides how far price can move, how fast it can get there, and whether your normal risk settings still make sense. Traders who ignore it often size too large, place stops too tight, and keep using the same setup in completely different market conditions.
In prop trading, that mistake gets expensive fast. A volatile session can push a solid idea into a rule breach if you don't adjust for wider swings, faster reversals, and news-driven spikes. Understanding volatility isn't theory. It's part of staying within daily loss limits, protecting drawdown, and giving yourself a real chance to pass a challenge.
Understanding Volatility Beyond Just Risk
A junior trader buys a clean breakout, uses the same size as yesterday, and gets stopped in two candles. The setup was not the main problem. The market was moving twice as fast, and the trade plan never adjusted.
That is what volatility changes in practice. It changes the distance price can travel before your trade has time to work, the size you can carry without stressing your loss limits, and the kind of execution the market will tolerate. In a prop environment, that matters every day. A setup that looks fine on a chart can still be a bad trade if current movement forces a stop that is too wide for your account rules.
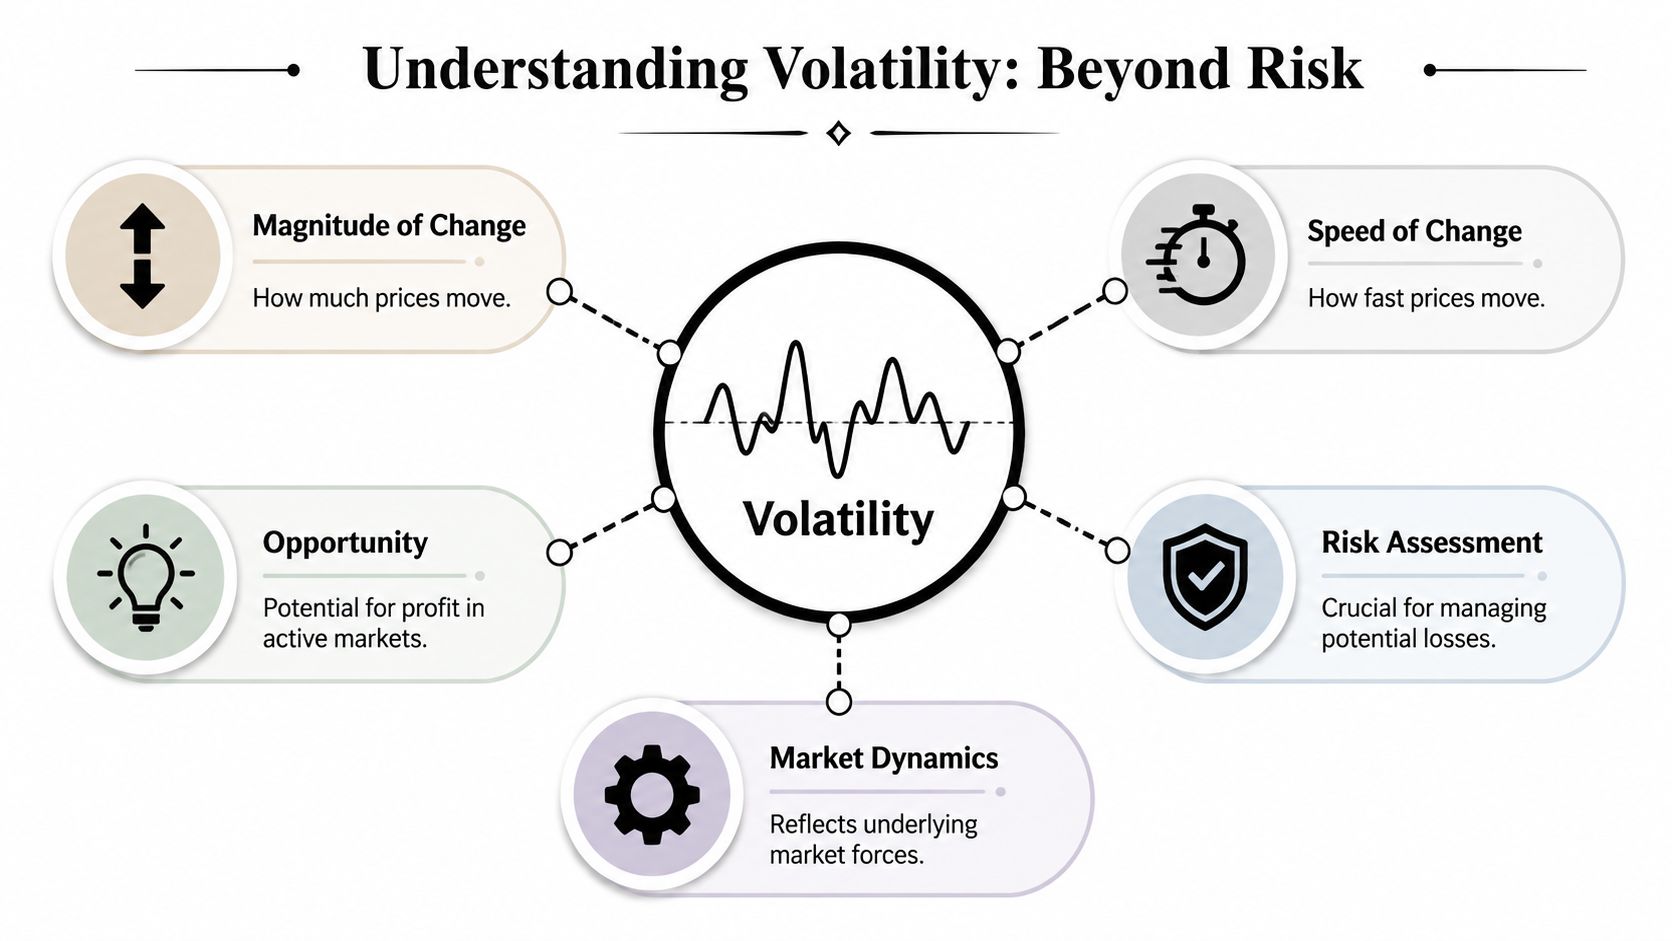
Volatility is usually described as the dispersion of returns around an average. For traders, the useful translation is simpler. It measures how much price tends to move, how quickly it does it, and how unstable your usual assumptions become when conditions shift.
Direction and volatility are separate decisions
Traders often blend trend bias and volatility into one judgment. That creates bad reads.
A market can sell off in an orderly grind with small pullbacks and limited intraday range. That is bearish, but the execution can still be calm. A market can rally hard and still be difficult to trade because every push higher comes with sharp retracements, fast candles, and slippage around entries and exits.
Read those conditions separately:
- Low volatility, bearish direction often means steady downside with cleaner execution
- High volatility, bullish direction can produce strong upside and ugly pullbacks at the same time
- Low volatility, sideways direction often means slow rotation and weak follow-through
- High volatility, sideways direction often traps breakout traders with repeated fake moves
Volatility is neutral. It says nothing about whether price should go up or down. It tells you how difficult the path is likely to be.
Why inexperienced traders keep misreading it
Many junior traders only notice volatility after the stop-out. By then, the market has already charged them for the lesson.
The common mistake is treating volatility as a synonym for danger. It is broader than that. Volatility defines opportunity, execution quality, and the amount of error your trade can survive. Breakout traders often need expansion. Mean reversion traders often need movement that is active but not chaotic. Scalpers can benefit from speed, but only if spreads, slippage, and reaction time stay manageable.
What works is boring and repeatable: check current range, compare it with recent sessions, adjust stop distance, and cut size if the market is stretching beyond your normal conditions.
Here is the practical read:
| Market trait | What it means for you |
|---|---|
| Small, slow candles | Less expansion, more patience, weaker payoff unless your entries are precise |
| Large, fast candles | Wider stops, smaller size, more slippage risk |
| Frequent reversals | Lower confidence in follow-through and more pressure on execution timing |
| Strong expansion after compression | Better conditions for breakout trades if risk is scaled correctly |
This matters even more if you trade products tied to options pricing or event-driven moves. A trader working through volatility in options trading needs to judge not only direction, but also whether expected movement is already priced in. For crypto traders, Coiner Blog's guide on crypto options is a useful reference for how volatility shapes pricing and trade structure in that market.
The two questions volatility should answer before every entry
Before taking risk, answer these two questions:
- How far can this market move under current conditions?
- How fast can it cover that distance?
If the answer is vague, your size is probably too big, your stop is probably placed by habit, and your trade may be incompatible with the account rules you are trying to protect.
The Two Faces of Volatility Historical vs Implied
Professional traders usually separate volatility into historical volatility and implied volatility. If you don't understand the difference, you'll keep mixing up what price already did with what the market expects next.
Historical volatility looks backward
Historical volatility is the rear-view mirror. It measures how much an asset has moved over a past period.
That matters because some products behave differently. A pair or index that has been moving in a restrained way allows one style of execution. A product that has been expanding and contracting aggressively demands another.
Historical volatility is useful for:
- Context on normal behavior for the instrument
- Comparing current movement to recent movement
- Adjusting stop placement when markets are clearly moving more or less than usual
- Filtering setups that rely on stable ranges or clean trends
Implied volatility looks forward
Implied volatility comes from options prices. It reflects what market participants expect about future movement, and it became central to option pricing with the Black-Scholes model introduced in 1973, as noted in ATAS's overview of historical and implied volatility.
That same source notes that on indices like the Nasdaq Composite, implied volatility often exceeds historical volatility by a premium of 10% to 30% during anticipated uncertainty. In plain language, options traders often price in more future movement than the recent past suggests when they expect trouble or a major event.
Practical rule: Historical volatility tells you what the road looked like. Implied volatility tells you what other traders think is coming around the bend.
Why the gap matters
When implied volatility sits far above historical volatility, the options market is telling you expectations have changed. That doesn't guarantee direction. It does warn you that calm conditions may not last.
That matters even if you never trade options yourself. Equity index traders, forex traders, and crypto traders can all use implied-volatility signals as a warning that event risk is being priced in.
For traders who want a better grasp of how options embed volatility expectations, Coiner Blog has a useful guide on crypto options. If you want to connect that idea directly to strategy design, MyFundedCapital also has a page on volatility trading options.
A simple comparison
| Type | Looks at | Built from | Best use |
|---|---|---|---|
| Historical volatility | Past movement | Price data | Behavior and context |
| Implied volatility | Expected movement | Option prices | Event risk and forward expectations |
Traders get in trouble when they use only one. Historical volatility can make you complacent right before a major release. Implied volatility can make you too defensive if you don't understand how much fear is already priced in.
How to Measure Volatility with Trading Indicators
A trader can read volatility fast enough to protect the account. That is the standard. In prop trading, the point is not to sound technical. The point is to avoid oversizing into a session that can hit your daily loss limit in twenty minutes.
Standard deviation gives you the baseline
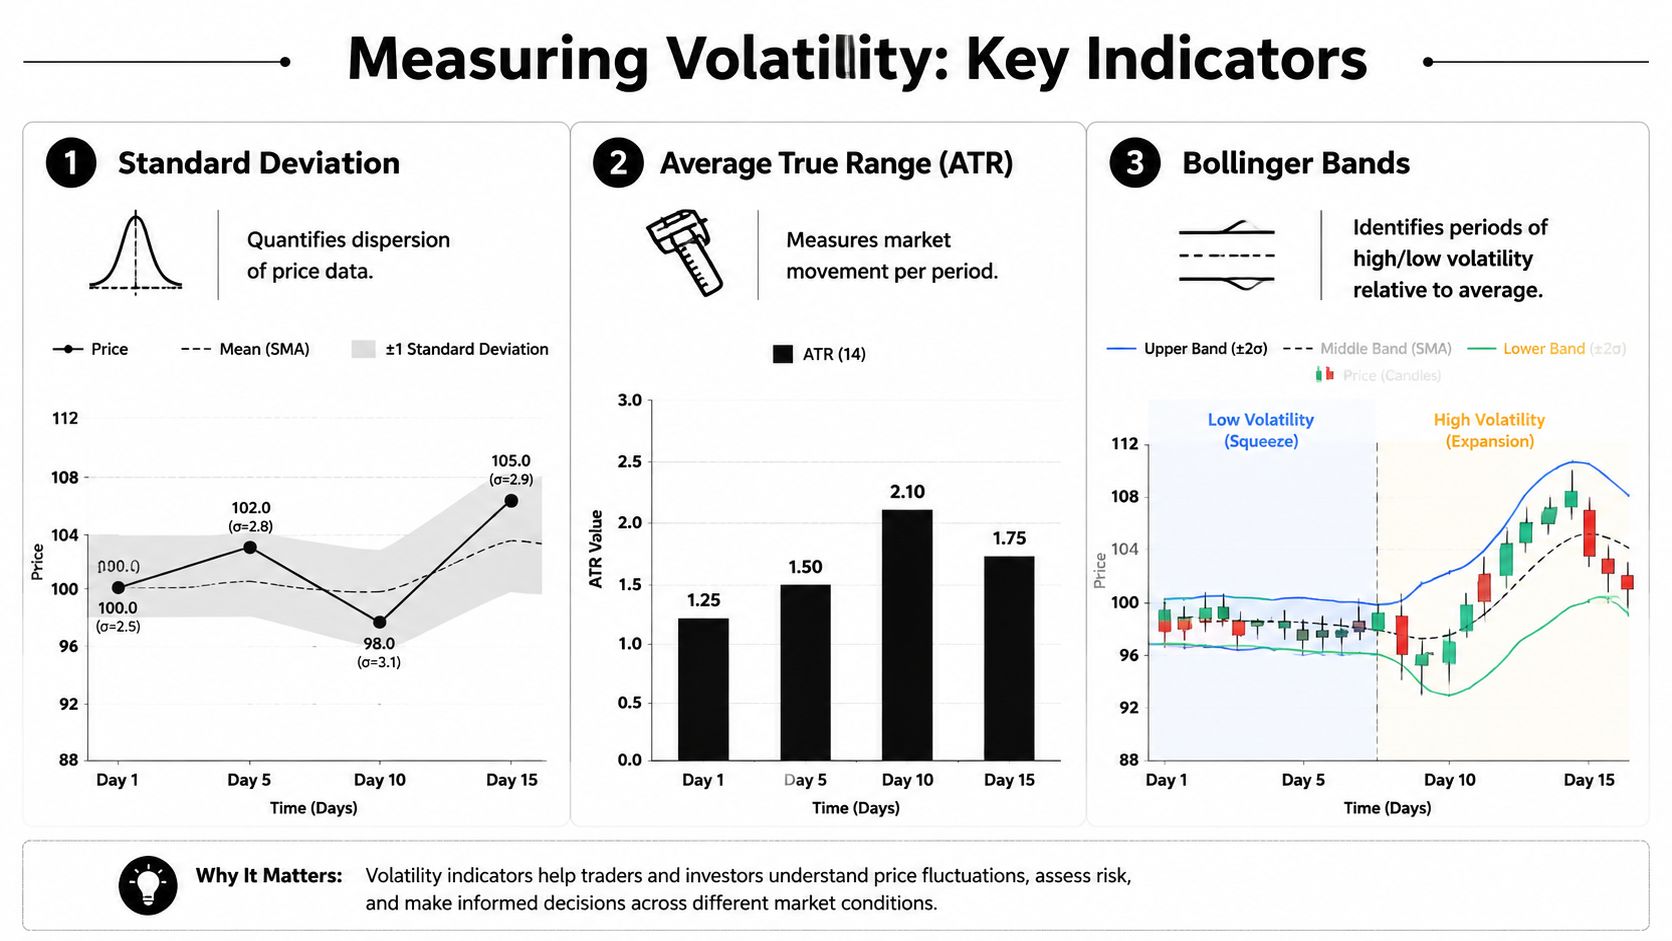
At the statistical level, volatility is usually expressed through the standard deviation of returns. Fidelity explains that standard deviation measures how far returns tend to move away from their average, which gives traders a framework for judging how dispersed price movement has been in normal conditions, in its explainer on what volatility means for investors.
For trading, the practical takeaway is simple. Higher standard deviation means a wider expected range around the mean. If you keep the same position size while that range expands, your dollar risk rises even before execution quality gets worse.
Most intraday traders will not calculate standard deviation by hand. They still need to understand what it represents, because many chart tools and strategy tests are built on it.
ATR is the day trader's workhorse
For active traders, Average True Range, usually shown as ATR(14), is often the cleaner tool. ATR measures how much an instrument has been moving per bar on average. It does not forecast direction. It shows how much room price has recently needed to move.
That makes it directly useful for decisions that matter in a funded account:
- Stop placement so the stop sits outside ordinary noise
- Position sizing so one routine swing does not consume too much of the day's risk budget
- Target planning so profit expectations match the instrument's current range
- Trade filtering so dead sessions do not tempt you into forcing setups
For a more detailed explanation, see this guide on what is Average True Range trading.
How ATR changes execution decisions
Here, traders either protect the account or bleed it.
A simple process works. Check ATR before the session starts. Compare current bar size to recent ATR behavior. If the market is moving well beyond its recent average, your old stop distance is probably too tight and your old size is probably too large.
My rule in a high-ATR session is straightforward:
- Cut size first.
- Recalculate the stop based on current range.
- Lower the number of attempts if conditions are unstable.
- Keep the day's loss cap in view before every entry.
That last point matters more in prop than in retail. A trader can be right on direction and still fail a challenge by using a size profile that does not fit current volatility.
When ATR expands, risk per trade must contract if you want to stay inside daily drawdown rules.
Bollinger Bands show compression and expansion
Bollinger Bands are useful because they make volatility visible. When the bands contract, price is usually trading in a tighter range. When the bands widen, movement is expanding and execution usually gets less forgiving.
Used properly, Bollinger Bands help answer two practical questions. Is the market coiled and quiet, or already moving? Is your breakout setup entering expansion, or are you chasing after the main move has already started?
They are context tools, not entry systems. Junior traders often make the mistake of buying every tag of the upper band or fading every touch of the lower band. That is indicator worship, not trade management.
VIX gives index traders a higher-level read
The Cboe Volatility Index, or VIX, tracks expected 30-day volatility in the S&P 500 from SPX option prices, according to the Cboe VIX methodology and overview. In practice, lower readings usually line up with calmer equity conditions, while higher readings often show stress, wider intraday swings, and faster repricing across correlated products.
If you trade index futures, US equities, or forex pairs that react to broad risk sentiment, the VIX helps frame the session before the open. It should not dictate every trade. It should shape expectations.
A practical read looks like this:
- Lower VIX conditions often support tighter execution and more selective breakout expectations
- Higher VIX conditions often require smaller size, wider stops, and stricter limits on how many failed attempts you allow
- Sudden VIX expansion warns that the day's normal playbook may no longer fit the tape
Used together, these indicators do more than describe volatility. They help traders decide how much risk the account can carry right now, which is the difference between surviving a prop challenge and violating rules with a strategy that worked last week.
Adapting Your Strategy to Volatility Regimes
A strategy that works in one volatility regime can fail badly in another. Many challenge accounts die as a result. The trader doesn't lose because the setup is always bad. The trader loses because the setup no longer matches the environment.
Low-volatility markets reward precision
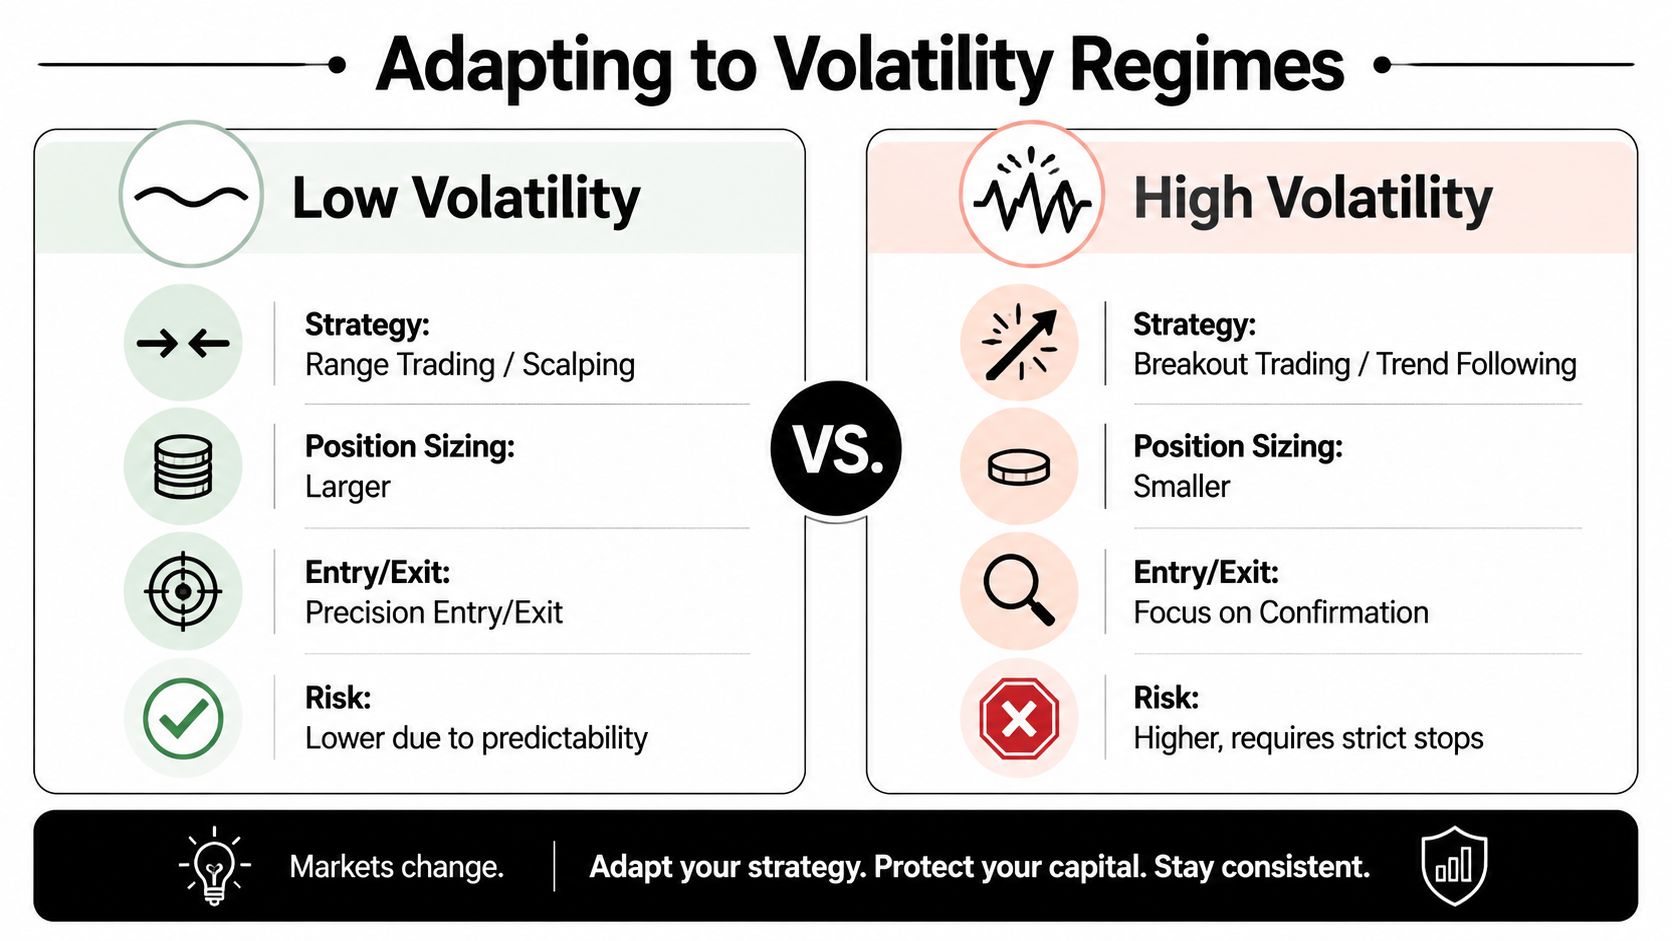
When volatility is low, price often rotates inside cleaner intraday ranges. Breakouts tend to struggle unless a fresh catalyst enters the market. Traders who keep chasing expansion in this environment usually take repeated small losses.
What tends to work better:
- Range trading around clear support and resistance
- Scalping when spreads and movement support it
- Quick profit-taking instead of waiting for a runaway move
- Tighter trade selection because weak setups won't get carried by momentum
The trap is overtrading. Low-volatility chop can make traders force entries out of boredom.
High-volatility markets reward adaptability
High-volatility sessions create wider swings, stronger breakouts, and more violent pullbacks. Trend-following and breakout traders often find better movement here, but execution gets harder.
That means:
- Breakout entries need confirmation, not blind chasing
- Position size should come down because normal adverse movement is larger
- Stops often need more room, but only if size shrinks with them
- Partial profit-taking matters more because reversals can be sharp
In high volatility, a good idea with bad sizing still becomes a bad trade.
Match strategy to environment
Here's the decision test I give junior traders:
| Volatility regime | Better fit | Usually worse fit |
|---|---|---|
| Low volatility | Mean reversion, range trades, selective scalps | Aggressive breakout chasing |
| High volatility | Breakouts, momentum, trend continuation | Tight-stop range fading |
A lot of traders want one setup that works all the time. That's fantasy. Markets rotate. You need different tools.
If you trade across broad risk sentiment shifts, it also helps to understand risk-on and risk-off behavior, because volatility often rises when capital rotates quickly between growth-sensitive and defensive assets.
Why this matters more in prop trading
In a personal account, stubbornness costs money. In a prop evaluation, stubbornness can cost the account.
When volatility expands, challenge rules don't become more forgiving. Daily loss limits stay where they are. Maximum drawdown stays where it is. That means strategy selection isn't just about edge. It's about whether the current regime allows you to express that edge without violating risk parameters.
A Prop Trader's Guide to Volatility and Risk Rules
A trader passes three clean sessions, then gives most of it back in 40 minutes after CPI. The setup was familiar. The size was familiar. The market was not.
That is how volatility breaks prop accounts. Usually not through one bad idea, but through normal execution applied to abnormal conditions.
Prop rules make that mistake expensive. Firms such as MyFundedCapital publish clear limits, including a daily loss cap and a maximum drawdown threshold. Those numbers matter less as policy than as operating constraints. If volatility expands and your process does not adjust, you can violate the account rules with trades that would have been manageable in a quieter session.
Position size must change when volatility changes
Earlier, volatility was defined as the expected range of price movement. In prop trading, the practical consequence is simple. Wider movement requires smaller size if you want to keep per-trade risk under control.
Junior traders often widen the stop and keep the same size because they still like the setup. That is how one reasonable trade turns into a rule problem. If the market now needs a wider stop to avoid noise, the position has to shrink with it. There is no workaround.
Use this pre-trade check:
- Classify the session as quiet, normal, or expanded relative to recent sessions
- Check whether your planned stop is outside normal noise for that market today
- If the stop needs more distance, cut size before entry
- If reduced size makes the trade not worth taking, pass on it
Passing is a risk decision, not a missed opportunity.
Daily loss limits expose volatility mistakes fast
The prop environment changes the cost of being wrong. In a personal account, oversizing during a fast session hurts your equity curve. In an evaluation or funded account, it can end the day or end the account.
The pattern is common. A trader uses standard size in a market that is printing larger bars, gets stopped, re-enters without recalibrating, then reaches the daily limit before the market settles down. The issue is rarely chart reading alone. The issue is failure to adapt trade risk to current movement.
This is why I tell traders to track daily loss in R as well as dollars. If your normal day allows three full-risk attempts, a volatile day may only allow one or two. The account rules did not change. Your trade frequency and size have to.
News, gaps, and execution risk need separate rules
Scheduled data, central bank decisions, earnings-related index moves, and weekend reopenings create a different problem. Volatility does not just increase. Execution quality can deteriorate at the same time.
That distinction matters. A stop that looks acceptable on the chart can still perform badly if spreads widen or price jumps through your level. Prop traders need event rules, not just chart rules.
A practical filter:
- Before major news, decide whether your edge depends on stable spreads and orderly candles
- After a spike, wait for structure to form again instead of treating random expansion as clean momentum
- Before the weekend, assume a gap can ignore your preferred exit level
If your plan does not account for slippage and gap risk, it is incomplete.
What disciplined prop traders actually do
The traders who stay inside the rules are usually boring in the right ways. They cut size in fast conditions. They trade less when price action becomes erratic. They stop treating every large candle as opportunity. They know the difference between a valid high-volatility setup and emotional chasing.
They also define no-trade conditions in advance. That part gets ignored too often. A strategy is not complete until it tells you when to stand down.
Volatility is not a side topic in prop trading. It decides whether your edge can be expressed without breaching daily loss limits, pushing maximum drawdown, or failing a challenge through poor adaptation rather than poor analysis.
Frequently Asked Questions About Volatility
Can you trade volatility directly
Yes, but usually through more advanced instruments such as options or volatility-linked products. Traders may use options to express a view that volatility will rise or fall, rather than only betting on direction.
That said, direct volatility products are not beginner tools. They behave differently from spot markets, and they can punish traders who don't understand pricing, term structure, and how implied volatility changes around events.
Does high volatility mean the market is going to crash
No. High volatility means price is moving rapidly and the range of possible outcomes is wider.
A crash is one form of high volatility, but it's not the only one. Markets can also become highly volatile during sharp rallies, short squeezes, or major repricing after news. Volatility describes magnitude and speed, not direction.
Which indicator is best for volatility
There isn't one best indicator. Each tool answers a different question.
- ATR is practical for stop placement and sizing.
- Bollinger Bands help visualize compression and expansion.
- VIX gives macro context for equity-related risk appetite.
- Standard deviation gives the statistical foundation behind volatility itself.
Use the tool that fits the decision you're making.
Should beginners avoid volatile markets completely
Not always, but they should respect them. Fast markets expose every weakness in execution, discipline, and risk control.
A newer trader usually does better by reducing size, trading fewer setups, and avoiding periods where movement becomes chaotic. You don't need to hide from volatility. You do need rules for when your usual approach stops being appropriate.
Conclusion Master Volatility to Master Your Trading
If you understand what is volatility in trading, you stop treating every stop-out as random. You start reading the market for what it is right now, not what you want it to be. That changes everything from strategy selection to stop placement to whether a trade is worth taking at all.
For prop traders, this is even more important. Volatility decides how quickly normal price movement can turn into a daily loss problem or a drawdown issue. Traders who adapt stay in the game. Traders who don't usually learn the lesson through account failure.
Trading involves risk of loss. This article is educational only and not financial advice.
If you want to test your discipline under clear risk parameters, explore the funding programs at MyFundedCapital. Compare the 1-Step and 2-Step Challenge accounts, review the rules carefully, and choose the path that fits your strategy and volatility management style.