A lot of traders think their edge stopped working because the setup got worse. Often, the actual problem is simpler. The market regime changed, and the trader didn’t.
If your breakout entries suddenly keep failing, your trend trades stall, or your “diversified” positions all start losing together, you’re probably trading without a clear read on risk on risk off conditions. Learn to spot that shift, and you stop forcing trades that only work in the wrong environment.
Introduction
Most traders run into the same problem at some point. A strategy works cleanly for weeks, then market behavior changes and nothing lines up the same way. The entries still look familiar, but the follow-through disappears, volatility changes shape, and correlations start doing the opposite of what you expected.
That’s where risk on risk off becomes useful. It gives you a practical framework for reading market mood instead of treating every session like a blank slate. When you can tell whether participants are chasing returns or scrambling for safety, your trade selection, position sizing, and expectations get sharper.
This matters even more in prop trading. Hard loss limits don’t care whether you were “basically right” on the idea. If the regime changed and you kept trading the old playbook, the damage adds up fast. Trading involves risk of loss, and this article is educational only, not financial advice.
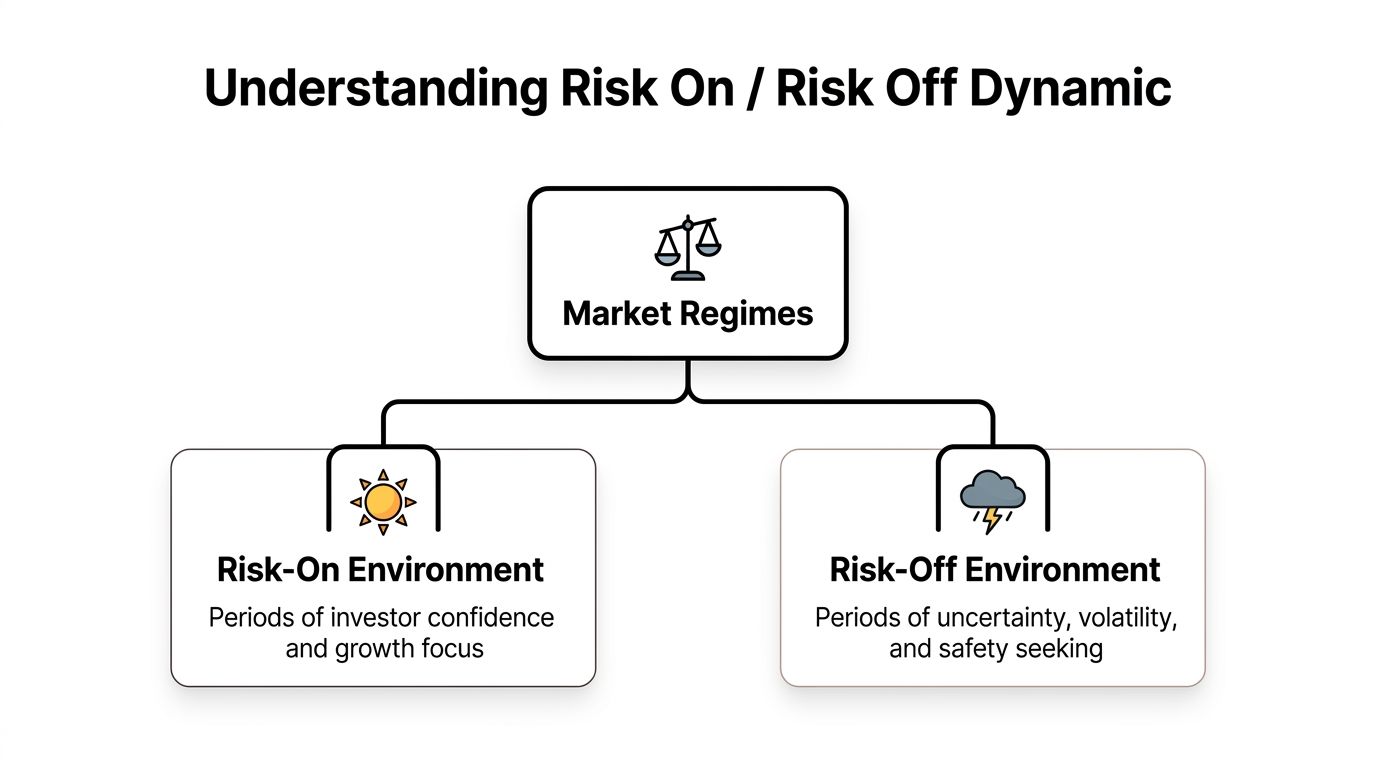
Understanding the Risk On Risk Off Dynamic
Risk on and risk off describe how aggressively market participants are willing to price uncertainty.
When traders trust growth, liquidity, and policy stability, capital moves into assets with more upside and more volatility. That is risk-on. When traders start protecting capital, reducing exposure, and paying up for safety, the market shifts into risk-off.
For a prop trader, the label only matters if it changes decisions. At a firm with a 5% daily drawdown limit, regime awareness affects how much size you can carry, how long you can sit through heat, and whether a setup deserves capital at all. A clean trend entry in a risk-on tape can justify normal size and wider profit targets. The same pattern during a defensive shift often needs smaller size, faster partials, or no trade.
What risk on actually looks like
A risk-on market usually rewards traders for owning momentum, buying pullbacks, and staying with strength a bit longer than feels comfortable.
You will often see:
- Equities hold bids: Dips attract buyers instead of turning into liquidation.
- Higher-beta FX gains interest: Growth-sensitive and carry-driven pairs tend to trade better.
- Volatility stays contained: Price can trend without repeated panic spikes.
- Breakouts follow through: Momentum setups fail less often and reclaim levels more cleanly.
The practical edge is simple. In this regime, traders can press good ideas a little more and fade minor weakness less aggressively. If your prop rules allow news trading, strong risk-on conditions can also create cleaner continuation after data or central bank headlines, provided spreads and execution still make sense.
What risk off looks like in real time
Risk-off changes market character before it shows up neatly on a chart.
Correlations often tighten. Traders sell what they can, not just what they dislike. Safe-haven assets attract demand, rebounds stall faster, and liquidity gets thinner right when positions need room. That is why many traders get trapped by setups that looked fine in isolation.
Inside a prop account, discipline gets tested. A trader who keeps buying every dip can burn through the daily loss limit in a session. A trader who turns aggressively bearish on every instrument can get chopped up just as badly during violent short-covering rallies. The better approach is to cut exposure, demand stronger confirmation, and accept that preserving drawdown is part of the trade.
What drives the switch
The shift usually comes from a combination of macro pressure and positioning. One headline can start the move, but the actual driver is how funds, dealers, and systematic players reprice risk after that headline.
Common triggers include:
- Central bank policy and tone: Easier policy often supports risk appetite. Hawkish surprises can tighten financial conditions fast.
- Economic data: Stable growth and inflation trends support confidence. Weak, mixed, or shock data can push money defensive.
- Geopolitical events: Conflict, sanctions, elections, or policy shocks can force rapid de-risking.
- Funding and credit stress: When borrowing gets tighter, institutions often reduce exposure across multiple asset classes.
The market does not need a disaster to turn risk-off. Sometimes a crowded long positioning setup is enough.
Why the shift is usually partial, not absolute
Risk on and risk off are better treated as dominant pressures than fixed labels. Equity index futures can trade with a defensive tone while one commodity market stays firm. A regional risk event can hit European assets harder than US indices. You can also get sharp relief rallies inside a broader defensive phase.
That matters for trade construction. Under prop firm rules, there is no prize for forcing full conviction when the tape is mixed. Mixed conditions call for tighter selection, smaller size, and clearer invalidation levels. If your firm allows weekend holds, that flexibility can help during stable risk-on trends, but it becomes far less attractive when macro risk is rising into an election, a central bank meeting, or a geopolitical weekend headline cycle.
A useful test is straightforward: are traders getting paid for reaching for return, or for hiding in safety?
Answer that directly, and the rest gets simpler. You stop applying last month’s playbook to a different tape. You protect the account first, then press when the regime supports it.
Key Indicators for Detecting Regime Shifts
A regime shift usually hurts a prop trader before it shows up in the P&L summary. The first clue is often simple. Setups that paid cleanly last week stop following through, correlations tighten, and normal pullbacks start feeling heavier than they should.
Under a firm rule set like MyFundedCapital’s, that matters immediately. A trader working with a 5% daily drawdown limit cannot afford to discover a risk-off turn by holding full size through the second failed trade. The job is to spot the change early enough to cut exposure, tighten invalidation, or stand down until the tape starts paying again.
Start with what changes fastest
Volatility is usually the first place I look. If implied volatility starts rising while equity indices stall near obvious resistance, traders are paying for protection instead of pressing upside. That does not guarantee a full risk-off phase, but it does tell you conditions are getting less forgiving.
Breadth gives the second check. A rally carried by a small group of names is weaker than a move with broad participation across sectors. For an index trader, that distinction affects sizing. Narrow leadership can still produce upside, but it often gives less room for error and reverses harder when sentiment slips.
Intraday execution still matters. Tools like VWAP in trading help confirm whether buyers are defending control through the session or whether price is bouncing inside a weaker macro tone. That is useful for prop traders who are allowed to trade news and need a clean framework for deciding whether a post-event move is acceptance or just noise.
Look for confirmation across markets
One chart is never enough. Real regime changes usually leave tracks in several places at once.
Use a working dashboard like this:
- Equity indices: Are major indices holding trend structure, or failing at obvious levels?
- AUD/JPY and similar FX pairs: Are growth and carry flows still being rewarded, or is the pair fading on every rally?
- Gold: Is it attracting bids while equities struggle to extend?
- Credit and funding conditions: Are traders becoming more selective, with stress showing up outside equities?
The trade decision comes from the combination, not the headline signal. If Nasdaq bounces but AUD/JPY stays soft and gold remains firm, risk appetite is not fully back. In a prop account, that is a cue to trade lighter, take profits faster, and avoid stacking correlated longs that can hit the daily limit together.
Track the shift in behavior
The level of an indicator matters less than the change in character around it.
Focus on three questions:
- Is sentiment improving or deteriorating quickly?
- Are several indicators lining up in the same direction?
- Are your setups still getting paid in the same way?
That third point is where many traders miss the turn. A regime often changes before the news flow catches up. Breakouts stop extending. Mean reversion gets sharper. Longs that used to recover by midday stay pinned near session lows. If you are trading under fixed drawdown rules, those are instructions, not observations. Cut size. Reduce overlap. Wait for cleaner confirmation.
Read indicators through firm constraints
Regime analysis only matters if it changes how you trade.
Inside a prop firm account, a risk-on tape can justify holding winners longer, carrying selective exposure into the weekend if the trend is stable, and using approved news events to catch momentum. A risk-off tape calls for the opposite. Smaller size, less correlation, less tolerance for chasing, and far more caution around overnight or weekend exposure when headline risk can gap the market against you.
That trade-off is practical, not theoretical. A trader who recognizes a regime shift early keeps the account alive. A trader who insists on using the same playbook in a different tape usually learns about sentiment from the drawdown report.
A simple pre-session checklist
Before the session starts, run through this:
- Indices: Clean trend or defensive trade?
- Volatility: Building or easing?
- FX sentiment barometer: Is AUD/JPY confirming risk appetite?
- Defensive flow: Is gold acting firm?
- Setup quality: Are breakouts and continuation trades still following through?
- Account risk: Does today’s environment justify normal size under the 5% daily drawdown cap?
You do not need every signal aligned. You need enough agreement to avoid trading yesterday’s regime with today’s risk.
How Different Assets Behave in Each Regime
Once you’ve identified the regime, the next question is obvious. What tends to move well in it?
Here, traders either simplify too much or overcomplicate things. You don’t need a theory for every tick. You need a working map of which assets usually benefit from confidence and which assets usually attract flows when traders get defensive.
Quick comparison by asset class
| Asset Class | Risk-On Behavior (Seeking Higher Returns) | Risk-Off Behavior (Seeking Safety) |
|---|---|---|
| Forex | Growth-sensitive and carry-friendly currencies tend to perform better | Safe-haven currencies tend to attract demand |
| Equity indices | Broad indices and tech-heavy markets usually respond well to confidence | Indices often weaken, and rallies become less reliable |
| Commodities | Growth-linked commodities can benefit when economic optimism improves | Gold often becomes more attractive as traders seek defense |
| Crypto | Speculative appetite can support upside and momentum | Risk reduction can hit crypto quickly, especially during broad de-risking |
Forex is often the clearest read
In FX, risk on risk off can be easier to read than in many other markets because sentiment shows up in relative strength.
Risk-on usually supports currencies linked to growth, trade, or carry. Risk-off tends to favor currencies seen as defensive. The useful point isn’t memorizing labels. It’s understanding the flow behind them.
When traders are confident, they’ll often prefer pairs that reward trend-following and carry logic. When fear rises, they usually cut those positions first.
A practical example is how traders watch AUD/JPY. In a healthy risk-on tape, this pair often behaves constructively. In a risk-off phase, weakness there can tell you that broader de-risking is underway before some equity charts fully reflect it.
Indices and commodities respond for different reasons
Equity indices usually reflect confidence most directly. If participants expect growth, easier conditions, or stable policy, equity exposure becomes easier to hold. If uncertainty rises, indices often stop rewarding dip buyers and start punishing late entries.
Gold behaves differently. It doesn’t need growth optimism to attract interest. In defensive periods, traders often use it as a place to reduce exposure to broader risk assets.
That’s one reason newer traders get confused. They’ll assume “all commodities” should move together. In practice, the reason for the move matters. Growth-linked commodities and gold don’t always respond to the same regime pressure.
When a market turns defensive, don’t just ask what’s falling. Ask what traders are actively choosing to hold instead.
For traders who want a broader view of hard-asset alternatives, some use resources around investing in digital silver to compare how precious-metal exposure fits into a defensive allocation mindset.
Crypto reacts fast when sentiment changes
Crypto often behaves like a high-beta expression of market appetite. When traders want risk, crypto can benefit from momentum and narrative flows. When they don’t, selling can become aggressive.
That doesn’t mean crypto always mirrors equities tick for tick. It means crypto is often less forgiving when sentiment deteriorates. If you trade it, you need to be more sensitive to shifts in market tone and less attached to the idea that a strong chart can ignore broader conditions indefinitely.
Build a watchlist around regime fit
A better workflow is to group instruments by likely regime behavior instead of scanning markets randomly. If you trade across forex, indices, commodities, and crypto, keep your watchlist organized around what each asset tends to do in a confident or defensive backdrop.
A broad market menu helps here. Traders who want to compare instruments across categories can review available funded trader markets and think in terms of regime-specific opportunities rather than one favorite setup repeated everywhere.
A simple framework:
- For risk-on days: Focus on indices, growth-sensitive FX, and momentum names that need confidence.
- For risk-off days: Shift attention to safe-haven behavior, defensive commodities, and short setups where broad weakness is confirmed.
- For mixed conditions: Trade smaller, shorten holding time, and demand cleaner confirmation.
The asset isn’t the edge by itself. The match between the asset and the regime is what improves trade quality.
Actionable Strategies for Risk On and Risk Off Trading
Once you know the regime, your job gets narrower. You’re no longer asking, “What can I trade today?” You’re asking, “What style of trade fits this environment?”
That shift saves a lot of bad decisions.
What tends to work in risk-on conditions
Risk-on conditions usually reward strategies that need continuation. Traders are more willing to buy strength, hold pullbacks, and rotate into higher-beta assets.
Three approaches stand out:
Trend-following on indices
If major indices are holding structure and volatility is contained, pullback entries in the trend direction often make more sense than fading highs.High-beta FX breakouts
Pairs tied to risk appetite can offer cleaner momentum when confidence is broad, not narrow.Momentum continuation after consolidation
If a market compresses and then breaks with broad confirmation, trend continuation is more likely than in a defensive regime.
An institutional sentiment framework adds a useful filter here. One composite risk on/off approach uses over 20 sentiment metrics, and when its 84-day range rank moves from below 5% to above 68.5%, it signals a high-probability buy environment for risk assets. In the cited example, the prior alert in November 2023 was followed by an 11% S&P 500 gain over three months, according to SentimenTrader’s risk on/off indicator note.
If you run algorithms, that kind of filter is practical. You can tell an EA to allow trend-following logic on breakout setups only when sentiment breadth confirms. That helps avoid running the same model through hostile tape just because the chart pattern appears.
What tends to fail in risk-on conditions
A lot of traders lose money in good environments by fighting strength for no reason.
Usually weak ideas include:
- Constant mean reversion against strong trends
- Shorting every extension because price “looks overbought”
- Holding defensive trades without broader confirmation
- Ignoring leadership and trading laggards instead
A market can stay bid longer than a skeptical trader can stay patient. In risk-on conditions, fading strong tape too early is often just disguised opinion trading.
What tends to work in risk-off conditions
Risk-off trading needs a different mindset. Speed matters more. Selectivity matters more. Profit targets often need to be more realistic because violent moves can reverse just as fast.
Useful playbooks include:
- Shorting weak equity rallies: In defensive tape, bounce failures often offer better entries than chasing breakdowns.
- Trading safe-haven strength: If gold firms and risk assets can’t recover, that relative behavior matters.
- Using range or mean-reversion tactics intraday: Some sessions become less trend-friendly after the initial impulse, especially once panic is already priced in.
Adapt by holding period
Not every regime should be traded the same way.
For day traders
Keep the process tight:
- Bias first: Decide whether the session is likely to reward continuation or defense.
- Execution second: Use structure, not hope, for entries.
- Cut faster in defensive tape: A failed move in risk-off conditions can unwind quickly.
For swing traders
You need more patience, but also more humility.
- Don’t assume a clean overnight carry if broader sentiment is unstable.
- Choose instruments that fit the regime.
- Reduce exposure when signals conflict across markets.
For algo traders
In this context, regime filters become especially valuable.
Build simple conditions such as:
- Only allow breakout systems when sentiment improves broadly.
- Disable aggressive trend logic when defensive flows dominate.
- Reduce trade frequency when cross-asset signals diverge.
The better algorithm isn’t always the one with more entries. It’s the one that knows when not to trade.
A practical routine before placing the trade
Use this short checklist:
- Check the broad backdrop: Are risk assets behaving consistently?
- Pick strategy type: Trend-following, reversal, or defensive momentum.
- Choose instrument fit: Don’t force a crypto breakout if the whole market is reducing risk.
- Confirm with another asset: If indices bounce but FX and gold disagree, trust the warning.
- Set realistic expectations: Strong regimes support holding. Mixed regimes usually don’t.
What works best is often boring. Match the setup to the environment, reduce the number of marginal trades, and stop trying to prove that your preferred strategy should work in all conditions. It won’t.
Managing Risk During Volatile Regime Shifts
The biggest mistake around risk on risk off isn’t missing the exact turning point. It’s staying sized for calm conditions when the market has already become unstable.
That’s how traders hit loss limits they never expected. Not because the first trade was huge, but because several positions that looked unrelated suddenly started moving together.
Risk-off shocks are usually more dangerous
This isn’t just trader folklore. Empirical discussion of the Kansas City Fed framework notes that risk-off events are more extreme and more probable than risk-on moves, and the March 2020 shock produced volatility spikes of more than 11 standard deviations, according to this review of the RORO research.
That asymmetry matters because defensive episodes don’t unfold politely. Correlations compress, spreads can react badly, and normal assumptions about diversification stop helping. If you’re trading under a firm rule set with a fixed daily loss cap, waiting for “a little more confirmation” can be expensive.
What disciplined traders do differently
They don’t just tighten stops randomly. They adjust the whole risk posture.
Use a regime-shift checklist like this:
- Cut gross exposure first: If multiple positions depend on the same market mood, reduce total risk before looking for new entries.
- Shrink size on first sign of instability: Don’t wait for a full loss day to respect changing conditions.
- Avoid averaging into risk-sensitive trades: In a defensive shift, adding to losers often turns a manageable mistake into a rule breach.
- Review correlation, not just single-trade risk: Three small positions can still be one large regime bet.
- Pause when the read is unclear: Flat is a position.
For traders who want a broader framework for account protection, this guide to risk management in forex trading is worth reviewing alongside your own rules.
Protecting the account is part of the strategy, not something you think about after the setup fails.
A practical sizing adjustment
In stable conditions, a trader might allow normal size on clean continuation setups. When signs of risk-off begin to spread across assets, the better move is usually one of three things:
- trade smaller,
- trade fewer markets,
- or stop trading until the picture clears.
Most juniors resist that because it feels passive. It isn’t. It’s professional.
Your first responsibility during a violent regime shift is survival. If you preserve capital and stay inside the rules, you keep the option to exploit the next clear move. If you force trades during a correlation event, you may not get that chance.
Trading involves risk of loss. There’s no setup quality high enough to override that reality.
Historical Examples and Emerging Trends
A trader logs in Sunday night holding growth exposure, sees index futures slipping, Treasury prices firming, and JPY catching a bid before Europe even opens. In a prop account, that is not trivia. It can be the difference between starting the week in control or spending the first hour defending a daily drawdown limit.
History helps because it shows how fast regime shifts turn from theory into P&L.
The 2008 financial crisis
The 2008 crisis remains one of the clearest risk-off case studies because the repricing was broad and sustained. After Lehman failed on September 15, 2008, stress spread quickly through equities, FX, commodities, and funding markets. Britannica’s overview of risk-on versus risk-off notes that the VIX jumped from 20 to 80, the S&P 500 fell 57% peak to trough by March 2009, the USD index rose 22% to 88, JPY strengthened 23% versus USD, and gold rose 25% to $1,000 per ounce by year-end, according to Britannica’s overview of risk-on versus risk-off.
The practical lesson is correlation. In conditions like that, separate positions often collapse into one macro bet. A prop trader who was long equities, short USD, and long AUD was not running three ideas. He was running one risk-on book.
That matters under firm rules. A 5% daily drawdown limit leaves little room for stubbornness once markets start repricing everything at once.
The COVID shock and what it taught traders
The COVID selloff was different. It was faster.
As noted earlier, March 2020 pushed the risk-on risk-off framework to an extreme risk-off reading. At the same time, the VIX reached 82.69, the S&P 500 dropped 34% in 23 days, and the TED spread hit 68 basis points. The point for traders is not the headline number. It is the speed of transmission across markets.
That episode changed how many discretionary and systematic traders handle regime detection. Waiting for confirmation from one chart was too slow. By the time equity weakness, FX flows, credit stress, and volatility all lined up on your screen, the easy part of the move was often gone.
For a prop trader, that changes execution decisions. News trading permission becomes useful during these periods, but only if size is adjusted before the event risk hits. If volatility is expanding and cross-asset signals are lining up, the edge often comes from trading smaller and reacting cleaner, not from trading bigger because the move looks obvious.
Newer market behavior through a 2026 lens
Recent tape has been less uniform than the older textbook version of risk-on and risk-off. Crypto often reacts first. High-beta tech can keep attracting flows even while broader cyclicals fade. Theme concentration has made some rallies narrower and some unwinds more violent.
A research reference from the BIS set argues that market structure and positioning are changing how risk gets repriced, especially in speculative pockets and systematic strategies, according to the BIS-linked reference provided in the research set. Treat that as a developing pattern, not a permanent rule.
The trade-off is straightforward. New leadership can create opportunity, but it also increases the chance of false reads. A trader may see strength in AI names or crypto and assume risk-on is back, while rates, credit, or defensive FX pairs are still warning that the broader regime has not turned.
That is where prop firm flexibility can help if it is used with discipline. Weekend holds let swing traders keep exposure when a genuine regime transition is underway, but only when the position can survive a gap without threatening account rules. News trading allows participation during key catalysts, but it also punishes traders who confuse access with permission to over-size.
Experienced traders treat historical examples as operating models, not trivia. The goal is to recognize the shape of the shift early, cut exposure before correlations spike, and keep enough risk budget intact to press when the new regime is finally clear.
Frequently Asked Questions
Is risk on risk off only useful for macro traders
No. Day traders, swing traders, and algo traders all benefit from it. The point isn’t to forecast the economy. The point is to know whether the market is rewarding aggressive exposure or defensive positioning right now.
Which market gives the clearest signal first
There isn’t one perfect lead market every time. In practice, traders often get the best read by combining equity behavior, volatility, a risk-sensitive FX pair such as AUD/JPY, and a defensive asset like gold. The stronger the cross-asset confirmation, the more useful the signal.
Can I trade one strategy in both regimes
You can, but you usually need different filters and expectations. A breakout strategy that thrives in stable, confident conditions may perform poorly in defensive tape unless you tighten selection and manage exits differently.
What should I do if I can’t tell which regime we’re in
Trade smaller or stand aside. Mixed conditions are where a lot of unnecessary losses happen. If the regime isn’t clear, forcing conviction usually costs more than waiting.
If you want to apply this with firm rules that reward discipline, explore MyFundedCapital. You can compare funding paths, account types, and platform options, then choose the setup that fits your style, whether you trade manually, run algorithms, or need flexibility around news trading and weekend holds.