Struggling to manage risk when the market gets choppy? The Average True Range (ATR) is a simple indicator that measures market volatility, helping you make objective decisions instead of emotional guesses. This guide will show you how to use ATR to set smarter stop-losses, calculate precise position sizes, and stay in control, no matter how wild the market gets.
What Is Average True Range in Simple Terms?
The Average True Range (ATR) is a technical indicator that measures volatility. Developed by J. Welles Wilder Jr., its primary job is to show how much an asset's price is moving, on average, over a specific number of periods. Critically, it does not indicate price direction—only the magnitude of its movement.
The ATR was designed to capture the "true" range of price movement by accounting for gaps between trading sessions. For instance, if a stock closes at $100 and opens the next day at $105, a simple high-low calculation for the day misses that $5 gap. ATR includes these gaps, giving you a more accurate picture of volatility. The final output is a single value (e.g., $2.50 or 30 pips) representing the asset's typical trading range.
Why ATR Matters to a Trader
Understanding volatility isn't just an academic exercise; it's a core component of risk management. For traders, especially those in a prop firm environment with strict drawdown rules, ATR provides an objective, data-driven tool to quantify market risk.
Here’s where it becomes practical:
- Objective Stop-Loss Placement: Instead of using arbitrary stop-loss levels (like a fixed 20 pips), you can base your stop on the market's current, measured volatility.
- Precise Position Sizing: ATR helps you calculate a position size that ensures you risk the same percentage of your account on every trade, regardless of whether the market is calm or chaotic.
- Volatility Filtering: It allows you to identify when a market is too choppy to trade or too quiet to offer real opportunities, helping you avoid unfavorable conditions.
Remember, trading involves a significant risk of loss. The ATR is an educational tool to help manage that risk, not a signal for guaranteed profits. It provides no buy or sell signals on its own.
How to Calculate the Average True Range
You will likely never need to calculate the Average True Range by hand, as all modern trading platforms do it for you. However, understanding the mechanics behind it is crucial for interpreting its readings correctly. The process involves two simple steps.
This diagram breaks down how the ATR turns chaotic price action and gaps into a single, usable volatility number.
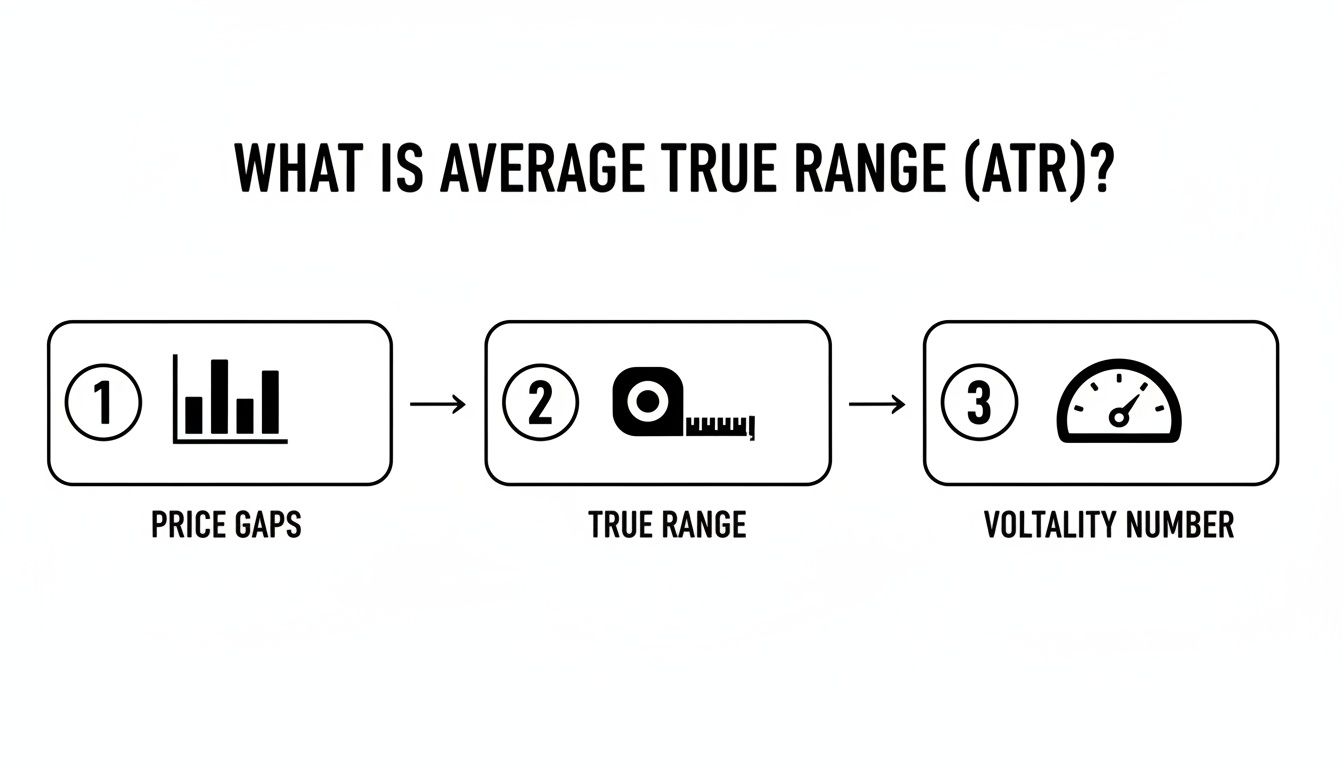
Step 1: Find the True Range (TR)
The "True Range" is what makes ATR superior to a simple high-low range. It accounts for price gaps by comparing the current period's range to the previous period's close.
For any given period (e.g., a daily candle), the True Range is the greatest of these three values:
- The current period's high minus the current period's low.
- The absolute value of the current period's high minus the previous period's close.
- The absolute value of the current period's low minus the previous period's close.
Example with EUR/USD:
- Current day's high: 1.0850
- Current day's low: 1.0800
- Previous day's close: 1.0790
Let's do the math:
- High – Low: 1.0850 – 1.0800 = 0.0050 (50 pips)
- |High – Previous Close|: |1.0850 – 1.0790| = 0.0060 (60 pips)
- |Low – Previous Close|: |1.0800 – 1.0790| = 0.0010 (10 pips)
The largest value is 0.0060 (60 pips). This is the True Range for that day.
Step 2: Calculate the Average
The ATR is typically calculated over 14 periods (the default setting on most platforms). It's a smoothed or exponential moving average of the True Range values. This means recent periods are given more weight, making the indicator more responsive to current market conditions. This ensures your average true range trading strategy adapts to the market's present energy, not outdated data.
Practical ATR Strategies for Prop Traders

Now, let's translate theory into actionable steps. For prop firm traders, mastering risk is not optional—it's the key to survival. The ATR provides a rules-based framework for managing risk that respects both the market's personality and your firm’s drawdown limits.
1. Setting Dynamic Stop-Losses
A fixed-pip stop-loss is a recipe for failure. A 20-pip stop might be fine in a quiet market but will get you knocked out instantly during a volatile session. An ATR-based stop adapts to the market's current "noise level."
The formula is simple:
- For a long trade: Stop-Loss = Entry Price – (ATR Value × Multiple)
- For a short trade: Stop-Loss = Entry Price + (ATR Value × Multiple)
The "multiple" is key. A common starting point is 2x. A larger multiple (e.g., 2.5x or 3x) gives the trade more room to breathe, while a smaller multiple (e.g., 1.5x) results in a tighter stop.
Example with S&P 500 (ES Futures):
- You enter a long trade at 5450.00.
- The current 14-day ATR is 35 points.
- You choose a 2x ATR multiple for your stop.
- Stop-Loss Calculation: 5450.00 – (35 × 2) = 5380.00
This stop is based on measured volatility, not a random guess.
ATR Multiples For Stop-Loss Placement
Choosing the right ATR multiple is a crucial decision that balances risk with the need to give a trade enough space. This table offers a starting point for aligning your multiple with your trading style.
| ATR Multiple | Trading Style | Typical Use Case | Risk Profile |
|---|---|---|---|
| 1.5x | Scalping / Day Trading | Quick entries on low timeframes, tight risk control. | Aggressive |
| 2.0x | Day Trading / Swing | The most common "all-around" setting for most assets. | Moderate |
| 2.5x | Swing Trading | Capturing trends on daily charts, avoiding noise. | Conservative |
| 3.0x+ | Position Trading | Long-term holds, weathering significant pullbacks. | Very Conservative |
Remember, these are just guidelines. The best multiple for you will come from backtesting and experience with your specific strategy and market. You can find more technical analysis insights at Fidelity.
2. Calculating Precise Position Sizes
Incorrect position sizing is the fastest way to violate a prop firm's drawdown rules. The ATR allows you to standardize your risk on every trade.
Follow this three-step checklist:
- Define Your Risk Per Trade: Determine the maximum dollar amount you're willing to lose (e.g., 0.5% of a $100,000 account = $500).
- Calculate Stop-Loss Distance in Dollars: Use the dynamic stop-loss method. For example, a 2x ATR stop on a stock with a $1.50 ATR gives you a $3.00 stop distance per share.
- Calculate Position Size:
Position Size = Risk Per Trade ($) / Stop-Loss Distance ($)
Example with Bitcoin (BTC/USD):
- Account Size: $50,000
- Risk Per Trade: 0.5% ($250)
- Current 14-Day ATR: $1,200
- Stop-Loss Multiple: 1.5x
- Stop-Loss Distance: $1,200 × 1.5 = $1,800
- Position Size: $250 / $1,800 = 0.138 BTC
This calculation ensures that if the trade hits your stop, your loss is capped at exactly $250. This level of discipline is essential for long-term success. If you're interested in other tools that can sharpen your risk analysis, you can learn more about VWAP and how it complements volatility indicators like the ATR.
3. Using ATR as a Volatility Filter
The ATR can act as a gatekeeper, telling you when market conditions are suitable for your strategy.
- Low Volatility Filter: If the ATR is historically low, trend-following strategies will likely fail. You can set a minimum ATR threshold below which you won't take trades to avoid choppy, directionless markets.
- High Volatility Filter: If the ATR spikes to extreme highs (e.g., during a major news event), the market may be too chaotic. Staying on the sidelines can protect you from extreme slippage and unpredictable price swings.
The ATR was developed by J. Welles Wilder and introduced way back in his 1978 book, 'New Concepts in Technical Trading Systems'. It quickly became a staple for traders because it captured "true" volatility by including overnight gaps, which can easily spike price movement by 20-50% after major news. You can learn more about its foundational role for momentum traders on MarketRebellion.com.
How to Interpret High and Low ATR Readings
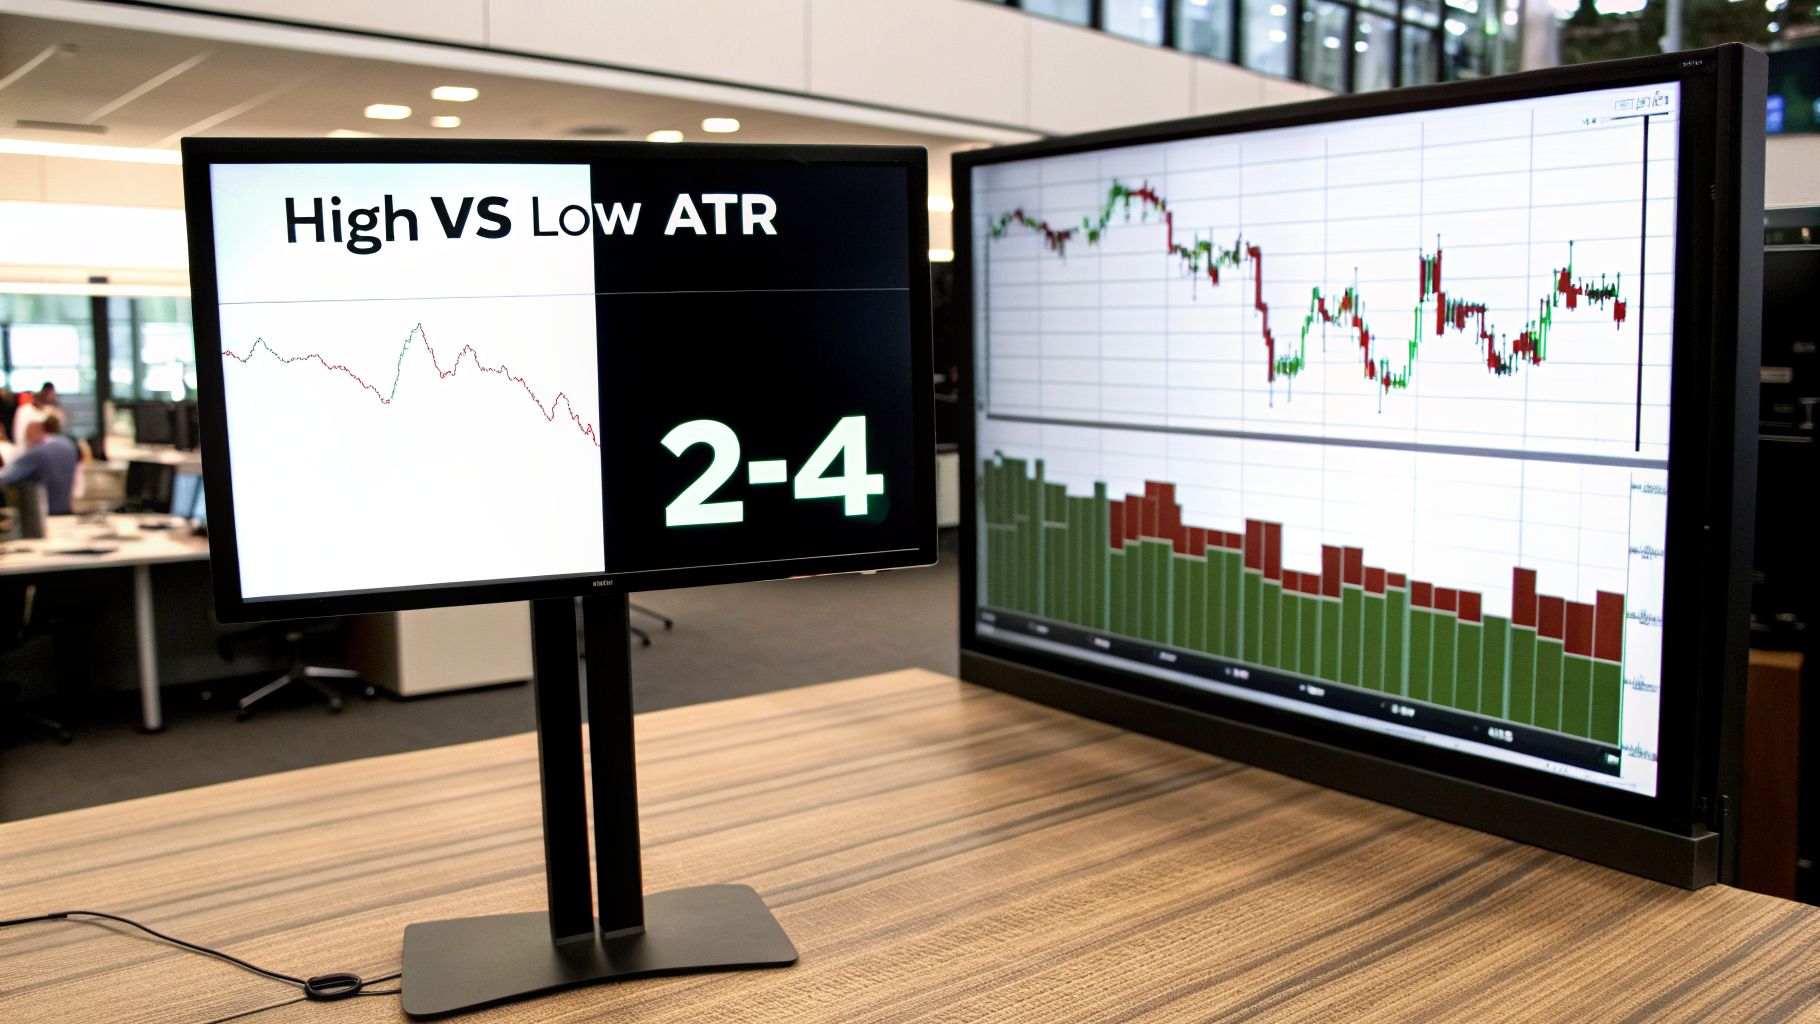
A high or low ATR reading is not a buy or sell signal. It provides context. Understanding this context is what separates successful average true range trading from blind gambling. A rising ATR means volatility is increasing, while a falling ATR indicates it's decreasing.
High ATR Explained
When the ATR indicator is rising, it signals that price swings are getting wider. This often occurs during major news events, at the start of a strong trend, or during market panics.
- What it means for you: Wider price ranges offer more profit potential but also come with increased risk.
- How to adapt: You must use wider stops (e.g., a larger ATR multiple) to avoid being stopped out by normal market noise. Your position sizes should be smaller to keep your dollar risk constant.
Low ATR Explained
A low and falling ATR indicates the market is quiet. Price ranges are contracting, and momentum is drying up. This is common during holiday periods or when an asset is consolidating.
- What it means for you: Trend-following strategies become ineffective. The market may be choppy and directionless.
- How to adapt: This can be a time to stay out of the market. However, prolonged periods of low ATR often precede an explosive breakout. This is a good time to watch for consolidation patterns like triangles or flags.
The most important thing to remember is that ATR is relative. An ATR of 150 pips on GBP/JPY might be normal, but on EUR/USD, it would signal extreme volatility. Always analyze the ATR in the historical context of the specific asset you are trading.
Common Mistakes to Avoid When Using ATR
The ATR is a powerful tool, but it's easy to misuse. Avoiding these common mistakes is crucial for protecting your capital.
Mistake 1: Assuming ATR Predicts Direction
Let's be clear: ATR only measures the magnitude of volatility, not its direction. A rising ATR can occur in a strong uptrend, a sharp downtrend, or directionless, volatile chop. Never use a high ATR as a standalone buy or sell signal.
Mistake 2: Using a One-Size-Fits-All Setting
The default 14-period setting is a good starting point, but it's not optimal for everyone. Your trading style should dictate your ATR setting.
- Scalpers (1-min to 5-min charts): Often use shorter periods like 5 or 10 to react quickly to intraday volatility shifts.
- Swing Traders (Daily charts): May stick with 14 or even use a longer period like 20 to smooth out noise and focus on the primary trend's volatility.
Mistake 3: Ignoring Its Lagging Nature
Like all indicators based on past price data, ATR is a lagging indicator. It tells you what volatility was, not what it will be in the next second. During a surprise news event, volatility can explode before the ATR line has a chance to catch up. Smart forex risk management strategies always account for the limitations of lagging indicators.
Mastering Volatility with Average True Range
Average True Range is not about predicting the future. It's about measuring the market's current energy so you can manage risk like a professional. By integrating ATR into your routine, you can set objective stops, calculate precise position sizes, and avoid unfavorable market conditions. This disciplined approach is fundamental to success, especially when managing a funded account with strict risk parameters.
As you become more comfortable, you can combine ATR with other indicators. For example, using it alongside a Bollinger Bands strategy can provide even deeper insights into market volatility and potential breakouts.
Backtests across global markets consistently show that using a 14-day ATR for stop placement prevents over 70% of premature exits in volatile assets like crypto and major indices. Why? Because it gives your trade enough "wiggle room" to survive normal intraday volatility, keeping you in winning trends far longer than a random, static stop ever could. You can find more research on ATR strategy and its statistical backing at resources like Edgeful.com.
Frequently Asked Questions (FAQ)
What’s the best ATR setting for day trading?
There is no single "best" setting, as it depends on your strategy and the asset's personality. However, many day traders prefer a setting shorter than the default 14. Periods like 5, 7, or 10 are common because they make the ATR more responsive to the rapid volatility shifts seen on intraday timeframes. The best way to find your optimal setting is to backtest different periods on your preferred market and timeframe.
Can ATR tell me which way a breakout will go?
No. This is a critical point. ATR is a non-directional indicator. A rising ATR simply signals that volatility is increasing and a large move is more likely. It does not provide any information about whether that move will be up or down. To determine direction, you must use ATR in conjunction with other tools like price action analysis (support/resistance, trendlines) or other indicators.
How can I use ATR for setting profit targets?
Using ATR for profit targets is a great way to create a symmetrical, data-driven trade plan. The method is similar to setting a stop-loss. Once you enter a trade, you can project a multiple of the current ATR to set your take-profit level. For example, if your stop-loss is set at 2x ATR below your entry, you might set a profit target at 2x, 3x, or 4x ATR above your entry, creating a defined risk-to-reward ratio based on current market conditions.
Ready to apply your knowledge of risk management in a professional trading environment? At MyFundedCapital, we provide the platform and capital for skilled traders to succeed.
Compare our funding programs to find the perfect fit for your strategy and start your journey to getting funded today.