You're watching your charts, price starts whipping around, and your first thought is simple: should you trade smaller, step aside, or lean in? That's where the VIX helps. If you've ever heard it called the market's fear gauge but never fully understood what that means, this volatility index explained guide will make it practical.
The goal isn't to make you memorize formulas. It's to help you read the VIX like a risk tool, especially if you trade under prop-style drawdown limits where one bad day can do real damage. Trading involves risk of loss. This content is educational only and not financial advice.
What Is the Volatility Index The Market's Fear Gauge
A prop trader hits a rough open. The S&P 500 drops fast, candles widen, and a setup that looked clean an hour ago suddenly carries twice the stress. In that moment, the VIX matters because it helps answer a practical question: is this a normal trading day, or a day that can push you into a drawdown limit much faster than usual?
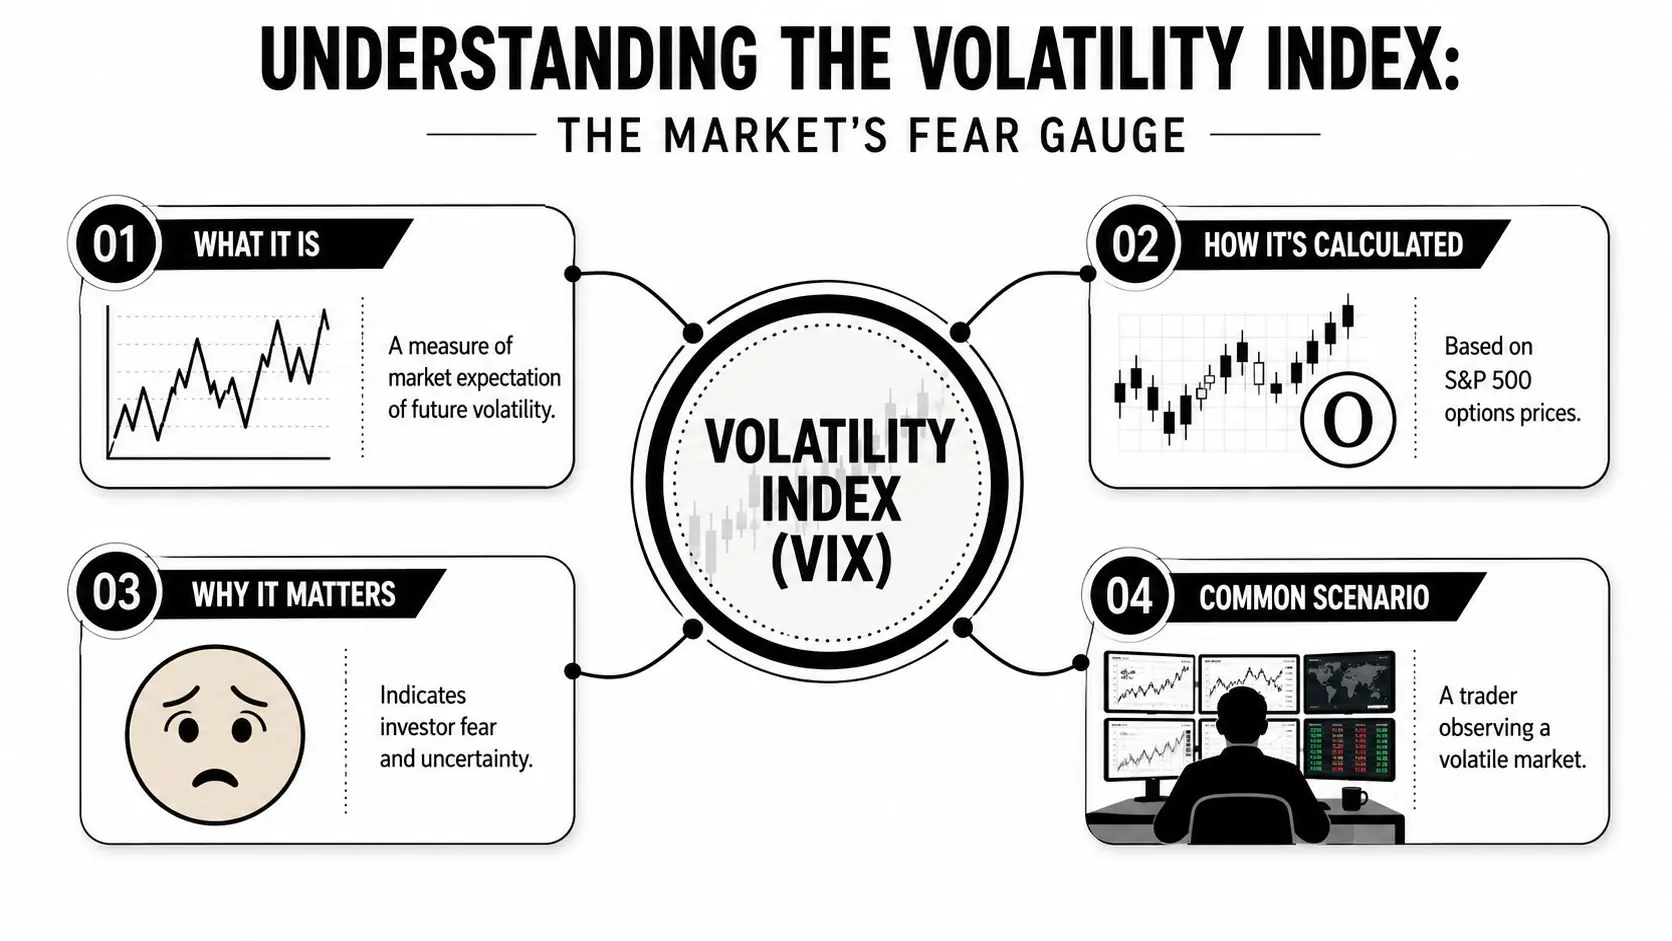
The CBOE Volatility Index (VIX) is a forward-looking measure of expected 30-day volatility in the S&P 500, published by Cboe Global Markets on its VIX overview page. It comes from S&P 500 index options prices, which means it reflects what traders are willing to pay for protection and uncertainty over the next month.
What the VIX is really telling you
The VIX translates option pricing into a single reading for expected turbulence.
That sounds abstract at first, so use an insurance comparison. When drivers expect icy roads, insurance suddenly feels more valuable. In markets, when traders expect a rough stretch, S&P 500 options used for protection get more expensive. The VIX captures that shift in pricing.
So the VIX is not a scorecard for how dramatic today already was. It is a live estimate of how much movement the options market expects over the next 30 days.
If you are still getting comfortable with the broader concept, this guide to volatility in trading helps frame where the VIX fits.
Why traders call it a fear gauge
The label comes from behavior, not from magic.
When equity markets sell off, traders often rush to buy downside protection. That extra demand lifts option premiums, and the VIX often rises with them. During calmer periods, protection usually costs less, so the VIX tends to sit lower.
For a discretionary trader, that makes the VIX a pressure gauge. It shows whether the market is pricing a quiet road, a bumpy road, or a stretch where your normal risk settings may no longer fit the conditions.
What this means for a prop firm trader
Many newer traders often become confused. They see a rising VIX and assume it is a trade signal by itself. It is better used as a risk filter.
A higher VIX can mean wider intraday swings, faster stop-outs, and more slippage around news or sharp index moves. Under prop-style rules, that has direct consequences. A setup with the same entry logic may need smaller size, fewer attempts, or a full pass if the volatility regime no longer matches your tested edge.
That point matters even more now because the market structure has changed. Heavy growth in 0DTE options has added more short-term flow to index trading, which can distort how traders interpret the VIX. The old habit of treating every VIX pop as a clean signal of broad, lasting fear is less reliable than it used to be. For strategy validation, the better question is narrower: when the VIX is in this range, does my setup still behave the way it did in testing?
Keep that frame in mind when you read the number on your screen:
- expected movement is rising or falling
- option protection is getting cheaper or more expensive
- your current risk model may fit the day well, poorly, or not at all
Used this way, the VIX becomes a practical tool for protecting capital. It helps you judge market conditions before volatility judges your account.
How Is the VIX Calculated A Practical Look Under the Hood
A lot of traders freeze when they hear that the VIX is derived from an options formula. You don't need to become an options quant to use it well. You just need to know what inputs drive it.
The VIX is built from real-time prices of S&P 500 options, not from opinions, surveys, or news headlines. More specifically, the calculation relies exclusively on out-of-the-money SPX put and call options, and options with zero bid prices are excluded so illiquid contracts don't distort the reading, as described in this VIX methodology reference from SFU.
Think like an insurance market
Here's the practical version.
If traders think the market could get rough, they buy protection. In equity index options, that often means puts. As demand for that protection rises, the prices of those options rise too.
The VIX takes that rising option premium and turns it into a single volatility reading.
So when the VIX climbs, it usually means traders are bidding up insurance. It's less about what already happened and more about what market participants are nervous could happen next.
Why out-of-the-money options matter
Out-of-the-money options are useful for this job because they're highly sensitive to shifts in fear and uncertainty. They act like the market's emergency pricing layer.
That means the VIX isn't built from random options across the board. It focuses on contracts that react strongly when traders start preparing for larger moves.
A few details matter:
- OTM puts and calls only the calculation uses out-of-the-money SPX options
- Illiquid contracts filtered out options with zero bids are excluded
- Near-term focus the index targets the upcoming month's expected volatility
What traders should take from the math
You don't need to calculate the VIX by hand. You need to respect what it represents.
Use this checklist:
- If option prices jump fast fear is entering the market
- If the VIX rises while your setup still looks clean check whether your stop is too tight for current conditions
- If the VIX stays muted don't assume safety, just note that options traders aren't aggressively pricing protection
The VIX is best understood as translated option demand. Traders pay more for protection, and the index rises with that fear premium.
That's the core of any solid volatility index explained framework. The number on your chart is really a summary of what the options market is charging for uncertainty.
Interpreting VIX Levels From Calm to Chaos
You open the platform before the cash session. Your index setup still looks clean, but the tape feels faster, candles are stretching, and normal stop distances suddenly look fragile. For a prop firm trader, that is the moment the VIX becomes practical. It helps you judge whether your usual risk plan still fits the session, especially when daily loss limits and trailing drawdown rules leave little room for being wrong twice.
A single VIX number means little on its own. Context gives it value. The job here is to sort the market into conditions, the same way a pilot checks weather before takeoff. Calm air, turbulence, and storm conditions all require different decisions, even if the route is the same.
The basic reading zones
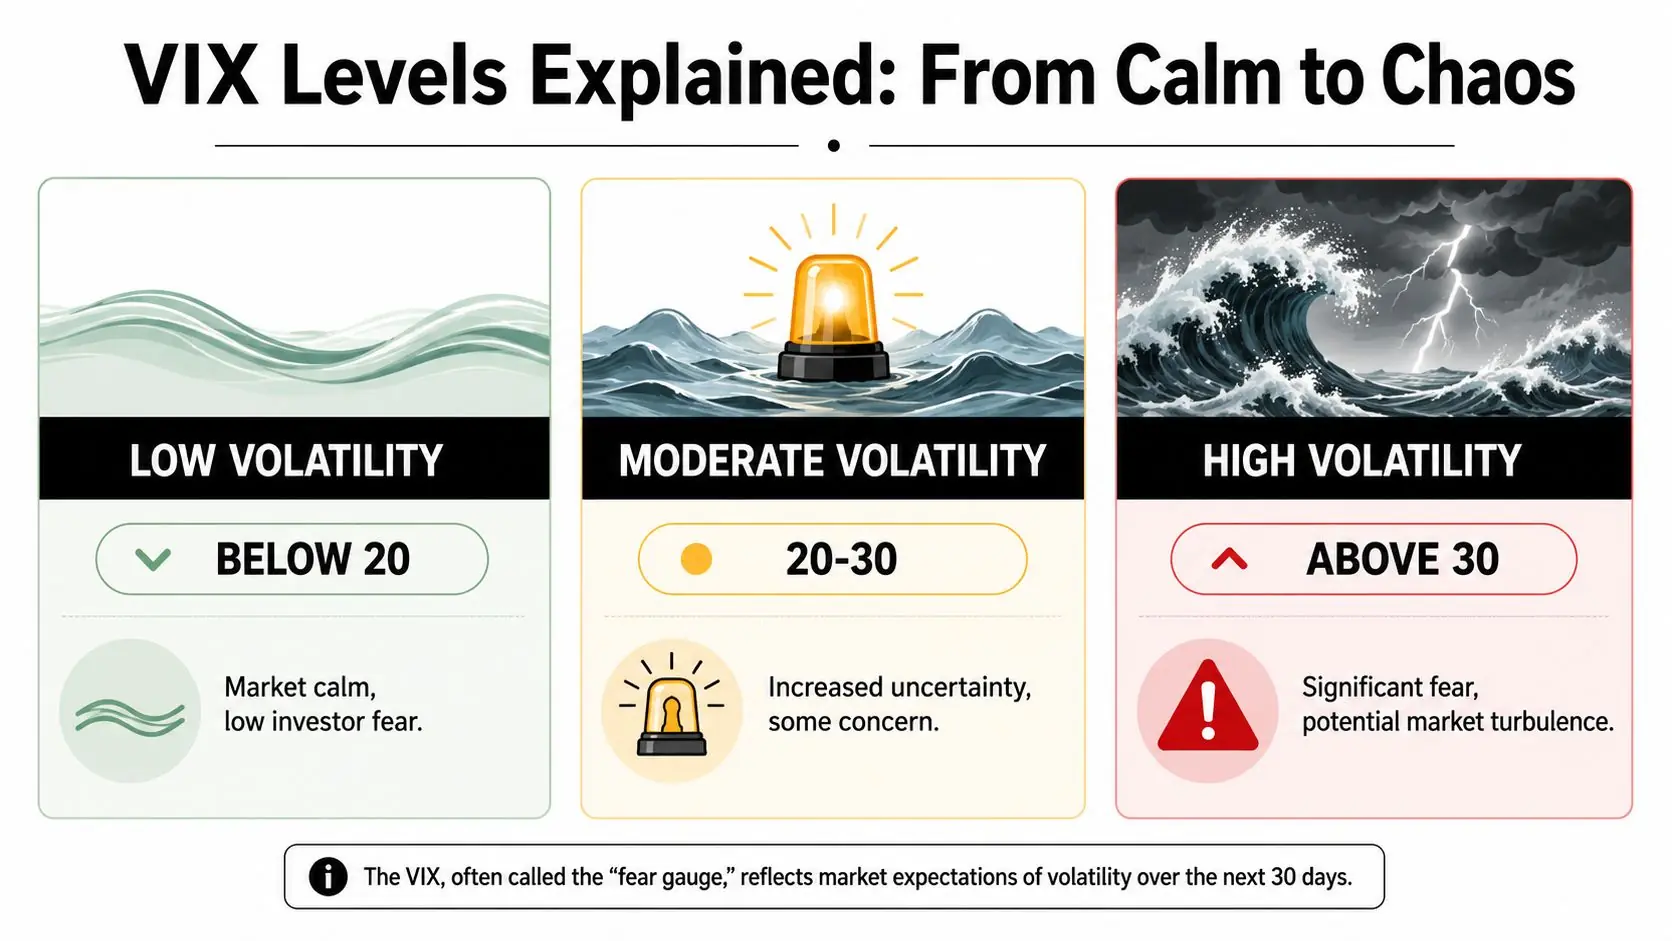
As outlined in Sun Life's overview of VIX ranges, readings below 15 usually line up with calmer conditions, while readings above 30 often show meaningful stress. In rare panic events such as the financial crisis and the pandemic crash, the VIX moved to extreme levels that signaled disorder, not just active trading.
Use that idea as a working ladder:
| VIX zone | What it usually suggests | Practical takeaway for a prop trader |
|---|---|---|
| Below 15 | Quiet conditions, low demand for protection | Size can look safer than it really is. Avoid overconfidence and watch for sudden expansion from compressed ranges |
| 15 to 20 | Fairly normal activity | Many intraday setups still behave well, but you should check whether your average stop still matches current range |
| 20 to 30 | Active, tense conditions | Reduce size, expect more noise, and be stricter about trade quality |
| Above 30 | Stress regime | Protect drawdown first. Fewer trades, smaller size, and wider expected swings |
| Extreme spikes | Panic and unstable execution | Slippage, failed follow-through, and system drift become serious risks |
What each zone changes in real trading
Low VIX conditions often feel comfortable. That comfort can be expensive. Tight ranges can reward precision, but they can also train traders into using oversized positions or unrealistically tight stops. Then volatility expands and the same playbook breaks in one session.
A mid-range VIX is often the most workable environment because price moves enough to create opportunity without becoming disorderly. Even then, check whether your strategy was tested in those conditions. Strategy validation matters more than preference.
A high VIX works like driving in heavy rain. The road is still there, but braking distance changes. In trading terms, your setup may still be valid, yet the path price takes to reach your target becomes rougher, faster, and harder to sit through. That matters a lot in prop accounts, where one oversized position can hit both your market risk and your rule risk.
High VIX conditions punish traders who keep yesterday's position size in today's market.
A more useful framework than “fear gauge” headlines
S&P Global's practitioner's guide to reading VIX groups regimes a bit more tightly: below 12 as low volatility, 12 to 20 as more typical, and above 20 as high. That framework is useful because the market often becomes harder to trade before the financial media starts using words like panic.
Those ranges are guides, not fixed laws.
Recent market structure changes matter here. The rise of same-day expiration options has changed how short-term hedging and speculation show up in index options activity. That means a “low” or “normal” VIX reading does not always carry the same message it did years ago. You should be slower to treat old VIX thresholds as automatic signals and quicker to compare the reading with realized price behavior, intraday range, and execution quality.
For prop traders, that leads to a simple test:
- Low VIX, clean tape trade your plan, but stay alert for complacency
- Low VIX, messy tape trust price action over the headline reading
- Rising VIX, same setup cut size first, then decide whether the trade still fits
- High VIX near your drawdown limit protect the account before looking for opportunity
If you want more context on how volatility conditions affect trade construction, this guide on volatility trading options strategies gives a useful next layer.
The main habit is simple. Do not ask whether the VIX is bullish or bearish. Ask whether current volatility supports your normal execution, your normal stop placement, and your prop firm risk rules. That question leads to better decisions.
How Traders Use the Volatility Index in Strategies
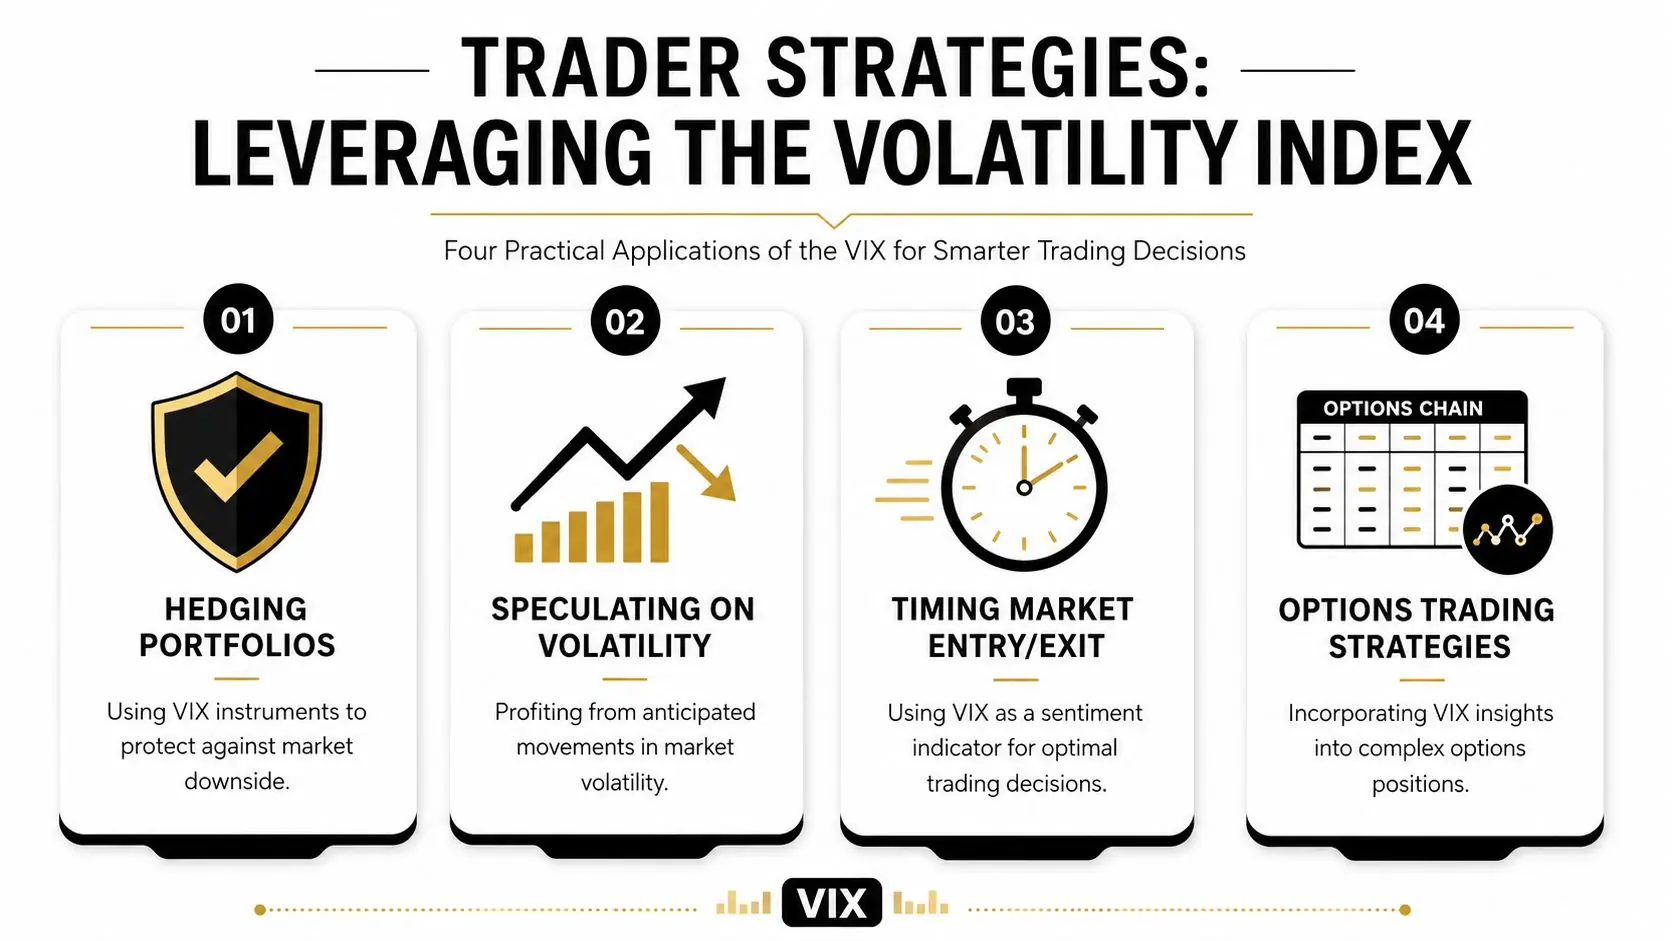
A useful volatility index explained article has to answer one question: what do you do with it? For active traders, the VIX is less about prediction and more about adjustment. It helps you decide whether your normal process still fits the market you're in.
Use it first for position sizing
Prop traders, pay attention. If your account has a daily loss limit or a maximum drawdown rule, volatility matters twice. It affects both your market risk and your rule risk.
When the VIX is high, the market can cover more ground in less time. That means a position size that felt normal in a calm environment may suddenly be too large.
A practical checklist:
- Reduce size when volatility expands if price swings widen, keep your dollar risk controlled by trading smaller
- Widen stops only if size shrinks too a wider stop with the same size can damage the account faster
- Cut trade count in unstable sessions if execution quality drops, fewer trades can protect your day
- Review correlation risk multiple index or risk-on positions can behave like one oversized bet when fear hits
Use the Rule of 16 as a quick expectation tool
The Rule of 16 is one of the few VIX heuristics that traders can apply quickly. Schwab's explanation of the Rule of 16 notes that dividing the VIX by 16 estimates the S&P 500's average daily percentage move. A VIX of 16 implies an estimated 1% daily move.
That doesn't mean the market will move exactly that amount today. It gives you a rough sense of what kind of movement the options market is pricing.
Here's how traders use it:
- If the VIX is near 16, the market is pricing roughly 1% average daily movement
- If your setup targets a very small move, ask whether noise alone can knock you out
- If your stop is far smaller than what the market is currently pricing, your trade may be structurally mismatched
If you trade volatility-sensitive products, this pairs well with a broader look at volatility trading in options.
Use it to validate or reject a setup
Sometimes a setup is technically valid but environmentally weak. In these situations, the VIX helps.
Ask:
- Is the market pricing calm or expansion?
- Does my strategy perform better in one of those states?
- Am I forcing a mean-reversion idea into a stress regime?
- Am I trend-trading a market that's compressing?
A breakout trader and a scalper won't use the VIX the same way. That's fine. The point is alignment.
Risk checkpoint: A setup isn't high quality if the volatility regime works against it.
Use extremes carefully as a sentiment clue
Some traders use very high VIX readings as a possible sign of capitulation. The logic is simple: when fear gets extreme, selling may be near exhaustion.
That idea can be useful, but it's dangerous when treated like a shortcut. A high VIX can stay high. Panic can persist longer than an eager trader expects.
So if you use the VIX this way:
- don't fade fear blindly
- wait for price confirmation
- keep size modest
- know exactly where your idea is wrong
The VIX works best as a filter and risk dial, not as a standalone entry trigger.
Common Pitfalls and Limitations of the VIX
The VIX is useful. It's also easy to misuse.
A lot of confusion starts with one bad assumption: traders think the VIX tells them what the market will definitely do next. It doesn't. It reflects implied volatility, which is the market's priced expectation of risk, not a guaranteed record of what price will deliver.
Implied volatility is not realized volatility
This distinction matters more than most beginners realize.
The VIX tells you what options traders are pricing. Realized volatility is what the market ends up doing. Those two can diverge. A market can price a storm and then drift. It can also look calm and then break hard.
That's why the VIX should sit beside price action, structure, liquidity, and your own strategy data. It should not replace them.
The VIX is specific to the S&P 500
Another common mistake is trying to apply the VIX directly to everything.
The VIX is built from SPX options, so it reflects expectations around the S&P 500. It can influence broader risk sentiment, but it is not a direct volatility reading for:
- individual stocks
- forex pairs
- crypto markets
- commodities
You can still use it as background context for broader risk appetite. Just don't assume a low VIX means your crypto scalp or GBP/JPY trade is automatically low risk.
Low VIX can be misleading now
The analysis deepens at this point. Traditional interpretations of the VIX have become less reliable in some intraday contexts because of structural changes in the options market.
As discussed in this Reddit discussion on recent VIX behavior, zero-day-to-expiry (0DTE) options now account for over 50% of SPX volume, and that flow can artificially compress intraday VIX readings. The result is what some traders describe as phantom stability, where the VIX stays low even as market fragility rises.
That changes how you should read a calm-looking VIX.
- Don't trust low readings blindly low doesn't always mean safe
- Watch intraday behavior if price is unstable while VIX looks muted, believe the tape
- Use more than one gauge breadth, structure, session range, and realized movement all matter
A low VIX can reflect calm. It can also reflect a market structure that hides stress better than it used to.
For prop traders, that matters a lot. If you rely on old threshold logic alone, you can oversize in a session that's less stable than it appears.
Practical Tools for Monitoring Volatility
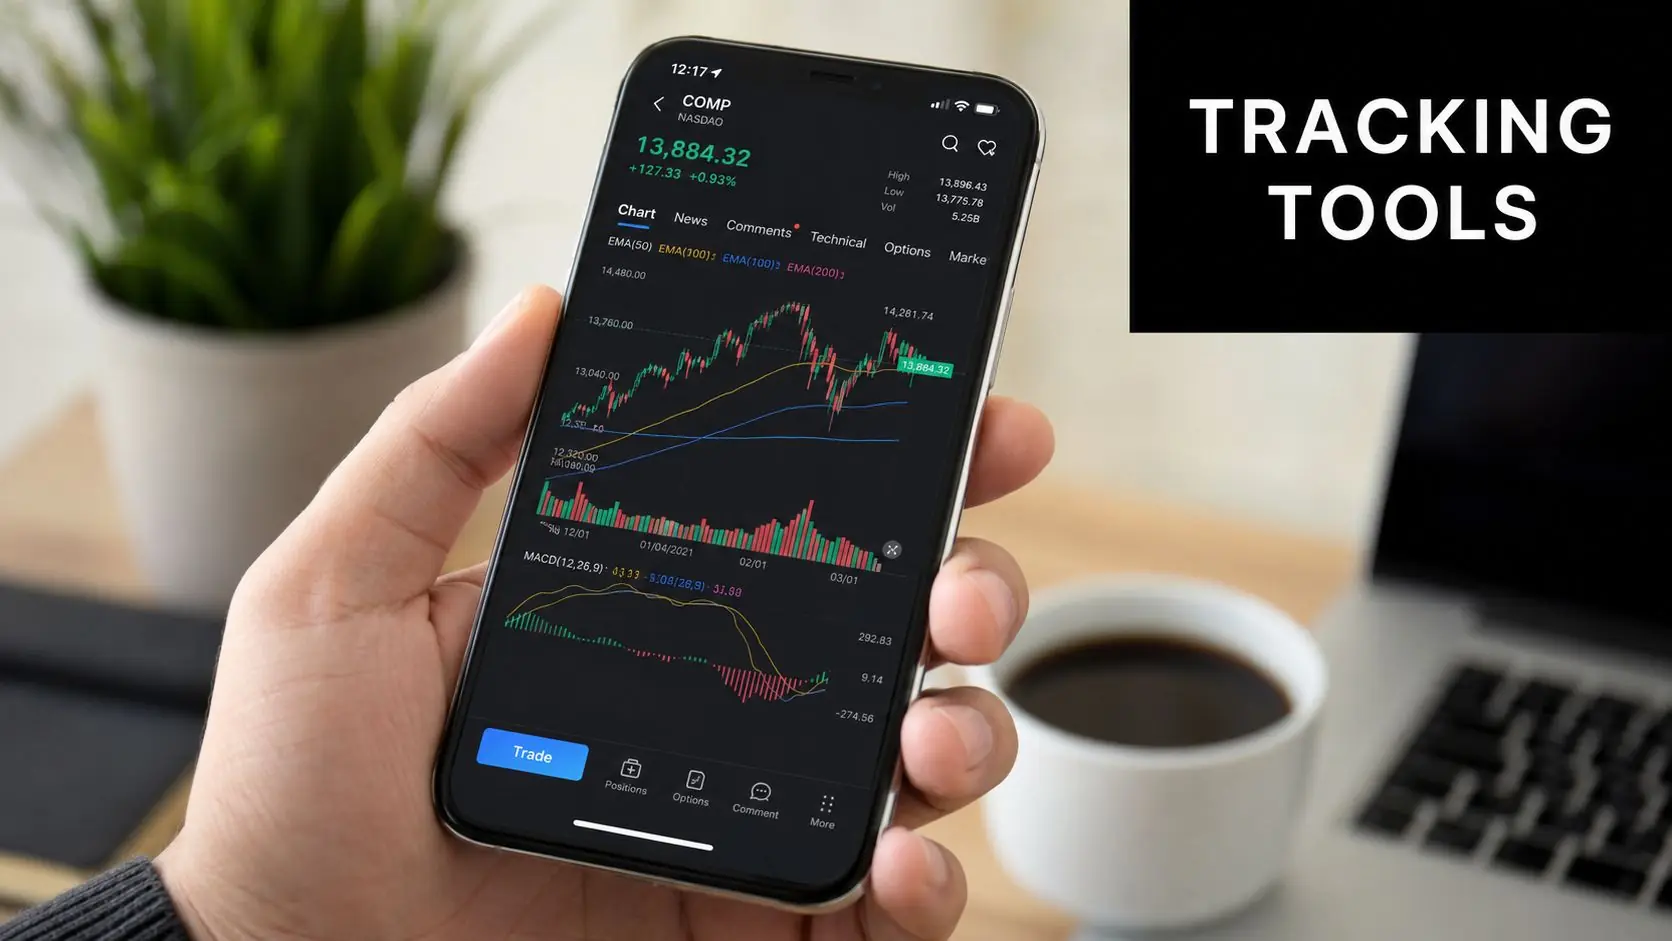
You don't need a complicated workflow to track volatility well. You need a repeatable one. The best setup is usually a mix of your trading platform, one charting tool, and one secondary volatility measure.
Tools traders actually use
If you trade CFDs, indices, or macro-sensitive instruments, start with the platform already in front of you. On platforms like cTrader, DXtrade, and MT5, traders often keep the VIX on a side monitor or in a watchlist so they can compare it with index price action in real time.
For deeper chart work, many traders use:
- TradingView for alerts, layout flexibility, and side-by-side charts
- Finviz for quick market context and heatmap-style scanning
- Cboe market pages for direct VIX tracking and contract awareness
- financial news terminals or major news sites to match volatility changes with event risk
Pair the VIX with one realized-volatility tool
The VIX gives you implied expectations. You should compare that with what price is doing.
A simple way to do that is with ATR. If you already use Average True Range in trading, you've got a practical companion to the VIX. ATR won't tell you what the options market is pricing, but it will tell you whether your instrument is already expanding in real terms.
A clean daily routine looks like this:
- check the VIX before the session
- compare it with overnight or premarket tone
- pull up ATR on your main trading instrument
- decide whether today is a normal-size day, reduced-risk day, or no-trade day
That process is simple, and simple is good. Traders break rules when the workflow is too complicated.
Frequently Asked Questions About the Volatility Index
Can you trade the VIX directly
Not in the same way you buy a stock. Traders typically access VIX-related exposure through products tied to volatility, such as futures, options, or CFDs offered by some brokers. Before trading any volatility product, check how it tracks, what hours it trades, and whether it behaves differently from the spot VIX you see on your chart.
Is a low VIX always bullish
No. A low VIX can reflect calm and confidence, but it can also reflect complacency. That's even more important now that intraday VIX readings can be distorted by heavy 0DTE options activity, as covered earlier. A quiet reading should invite context, not blind confidence.
Does the VIX apply to forex or crypto
Not directly. The VIX is built from S&P 500 options, so it is an equity-market volatility measure. Forex and crypto traders can still use it as a broad risk sentiment input, especially during global risk-on or risk-off periods, but they shouldn't treat it as a direct volatility gauge for those markets.
What's the best way for a prop trader to use the VIX
Use it to manage risk before you use it to hunt opportunity. If the volatility regime is changing, adjust size, widen your awareness, and get more selective. The VIX won't save a weak strategy, but it can stop you from applying a decent strategy in the wrong environment.
Trading involves risk of loss, and no single indicator is enough on its own. This content is educational only and not financial advice.
If you want a structured place to apply disciplined risk management, explore MyFundedCapital. You can compare funding programs, review account types, and choose a path that fits your style, whether that's instant funding or a challenge model built around clear rules.