Step 1 of 5
SMA and EMA
Take five EURUSD closes: 1.0820, 1.0830, 1.0825, 1.0840 and 1.0835. Their sum is 5.4150; divided by five, the simple average is 1.0830. When the next candle closes, the oldest close drops out and the newest comes in, so the average “moves”.
The SMA gives every close the same weight. The EMA gives more weight to the latest closes, so it reacts faster to a sharp move and turns sooner. Neither is better in every case: the EMA follows price more closely, the SMA is smoother and turns later.
Step 2 of 5
Common settings
- 20-period. Short-term. Hugs price; useful for pullbacks in a strong trend.
- 50-period. Medium-term. A common trend filter on 1h and 4h.
- 200-period. Long-term. Widely watched on 1D; price above it is often read as a long-term uptrend.
The period counts candles on the chart you are looking at. A 50 EMA on 15m covers about half a day; on 1D it covers about ten weeks of trading. The same setting tells you different things on different timeframes, so keep a fixed set and use it the same way each time.
There is nothing special about these numbers; they matter mainly because many traders watch them. That is also why price often reacts near a widely watched average on 1D, and less near an unusual setting.
Step 3 of 5
Three ways traders use them
- Direction. A rising average with price above it supports buying; a falling one supports selling. A flat line means no clear trend.
- A zone for pullbacks. In a trend, price often pulls back towards a 20 or 50 EMA before the next leg. Treat the line as a zone, not an exact price.
- Crossovers. A faster average crossing a slower one, such as 20 over 50, marks a change in momentum. Crossovers come late by design, because they average past prices.
Direction is the most useful of the three. Crossovers on their own tend to give many false signals in ranges.
Two crossovers have names. A golden cross is a shorter average, often the 50, crossing above a longer one, often the 200; a death cross is the opposite. Both lag and carry the most weight on daily charts.
Step 4 of 5
Add one in the Terminal
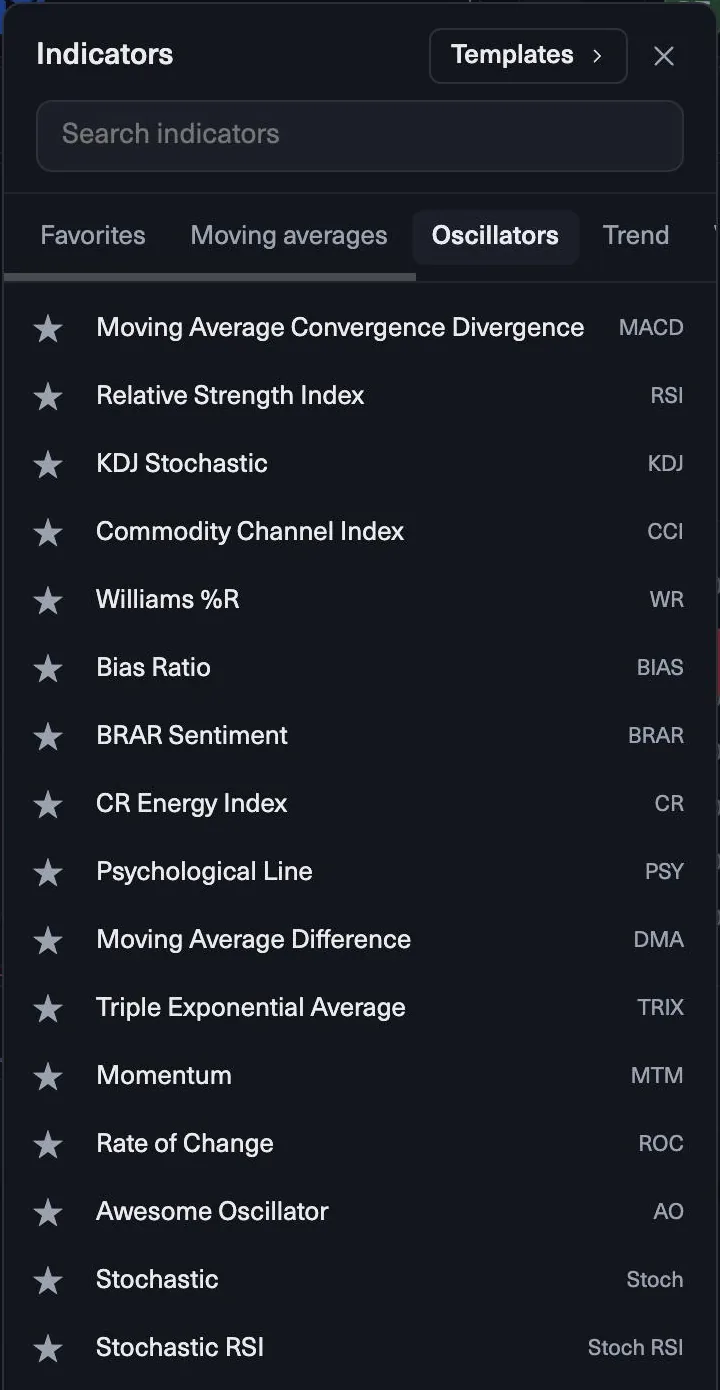
Open the Indicators menu and choose a moving average under Moving averages. You can add up to 8 indicators per chart, but two moving averages are plenty: for example a 20 EMA and a 50 EMA, or a 50 EMA alone.
Use the same settings on every timeframe you check, so a signal means the same thing wherever you see it. If you run a layout with several charts, put the same averages on each one.
Step 5 of 5
What moving averages cannot do
They lag. By the time a crossover appears, part of the move is gone. In a range they whipsaw: price crosses the line again and again.
They are not a stop either. A stop one pip below the 50 EMA is a stop at a line many others watch, in a place that moves every candle. Put the stop beyond structure, such as the last higher low, and size from that distance. On a $10,000 account at 0.5% risk you can lose $50 per trade, whatever the average says.
Recap
- The period counts candles, not days: a 50 EMA on 1h averages the last 50 hourly closes.
- Use the slope for direction and the line as a zone in pullbacks, not as a precise signal.
- Moving averages lag. Your stop still goes beyond structure, never just past the line.
Check yourself
0 / 4
Lesson complete
Nice work. … of 15 lessons in Trading basics in the MyFundedCapital Terminal done.
Sign in to read the full lesson, take the quiz and save your progress.