Step 1 of 5
What ATR measures
The true range of a candle is the largest of three distances: high to low, high to the previous close, or low to the previous close. The last two catch gaps. ATR is the average true range over the last 14 candles by default.
It is shown in price units. If EURUSD on 1h shows an ATR of 0.0012, a typical hourly candle covers about 12 pips. On XAUUSD at 2,380 an hourly ATR might read 6.00, meaning a typical candle covers about $6 of price. On BTCUSDT at 81,900 it could be several hundred dollars. ATR rises in busy sessions and around news, and falls in quiet ones.
Step 2 of 5
Stop distance from ATR
Start from structure, then add a buffer. Say you buy EURUSD at 1.0835 after a pullback. The swing low is 1.0815, and the 15m ATR is 10 pips. A buffer of half an ATR puts the stop at 1.0810: 25 pips from the entry.
A second method uses ATR alone: a stop at 1.5 to 2 times ATR from the entry. It is simple and adapts to volatility, but it ignores where the chart says the idea is wrong. Many traders combine both: the structure gives the place, ATR checks that the stop is not inside normal noise.
Read ATR on the timeframe you enter on. A 15m ATR tells you about 15m noise; a stop sized from the 1D ATR on a 15m entry is usually far wider than the setup needs.
If the stop needed by the chart is many ATRs wide, the setup is poor on that timeframe. Skip it or move to a higher one.
Step 3 of 5
A wider stop means a smaller size
Keep the dollars fixed and let the volume adjust. On a $10,000 account at 0.5% risk you can lose $50.
| Stop (EURUSD) | Loss per lot | Volume for $50 |
|---|---|---|
| 25 pips | $250 | 0.20 lots |
| 40 pips | $400 | 0.12 lots |
| 50 pips | $500 | 0.10 lots |
In the ticket, choose Risk % and enter 0.5. When you add the stop, the volume follows the distance and Risk at SL stays at about $50, whichever market you trade.
Step 4 of 5
ATR and ADR in the Terminal
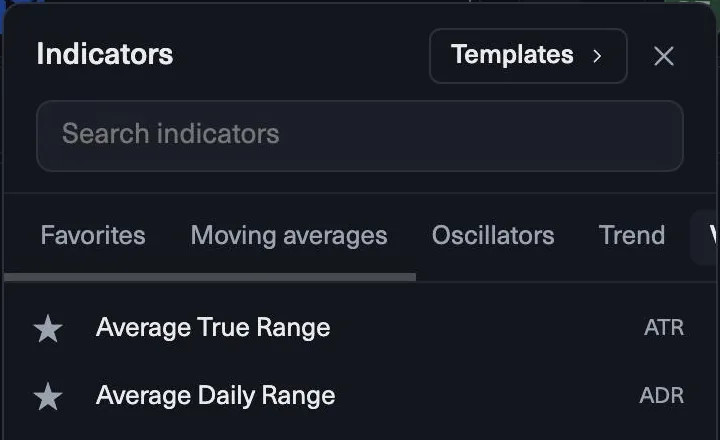
Open Indicators and go to Volatility. Add ATR to see the average candle size on the timeframe you trade, and ADR for the average daily range. ADR tells you how far a market usually travels in one day. If EURUSD has already moved most of its ADR by midday, a target that needs as much again is less likely.
Check the Calendar tab as well. High-impact news widens candles at once, and your plan pauses new trades from 2 minutes before to 2 minutes after it on the symbols it moves.
Step 5 of 5
Mistakes to avoid
- A stop tighter than one ATR. One ordinary candle can reach it.
- Using yesterday’s ATR all week. Volatility changes. Read it before each trade.
- Raising the dollar risk because ATR is high. A wider stop calls for a smaller volume, not a bigger loss. Your daily loss limit on a $10,000 1-Step Challenge account is $500 whatever the market does.
Recap
- ATR measures how far price usually moves per candle. It says nothing about direction.
- A stop tighter than one normal candle is often hit by noise, not by a failed idea.
- When ATR rises, the stop widens and the volume shrinks. The dollars at risk stay the same.
Check yourself
0 / 3
Lesson complete
Nice work. … of 15 lessons in Trading basics in the MyFundedCapital Terminal done.
Sign in to read the full lesson, take the quiz and save your progress.