Thirteen timeframes, from one minute to one month, on every symbol in the watchlist.
Drawings are saved, so mark your levels once on the higher timeframe.
Custom indicators are not supported; the built-in set covers the basics. Expert advisors run only by agreement, so write to support before you use one.
What the chart offers
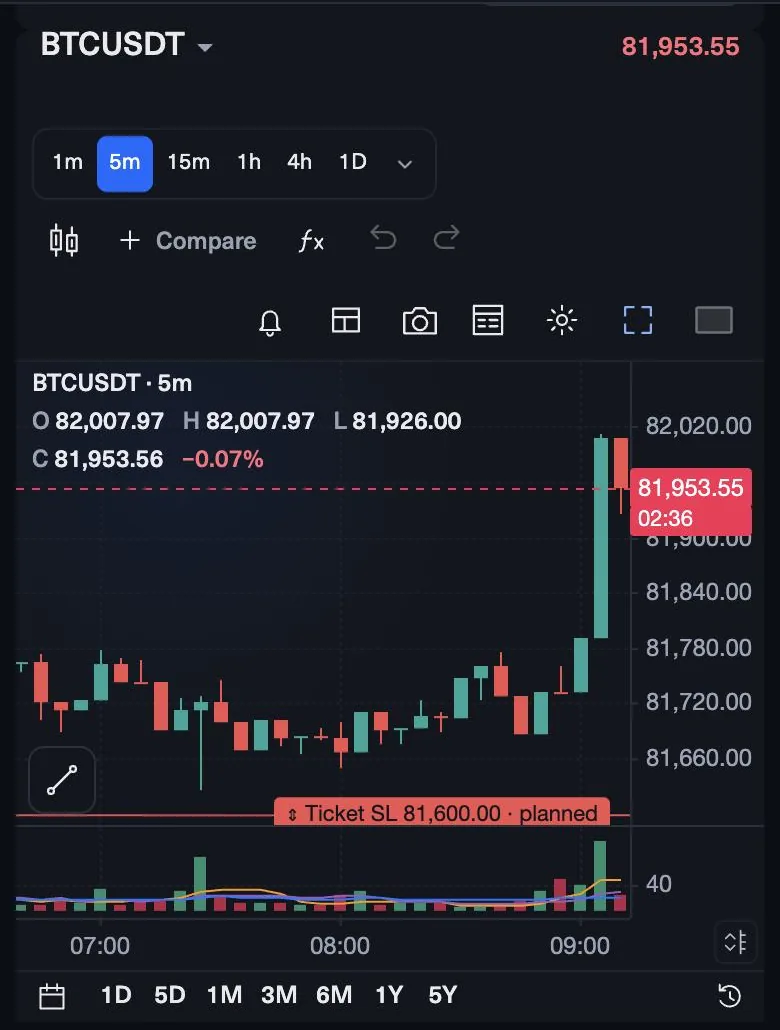
- Timeframes. Thirteen, from one minute to one month. The quick switches include 1m, 15m, 1h, 4h and 1D.
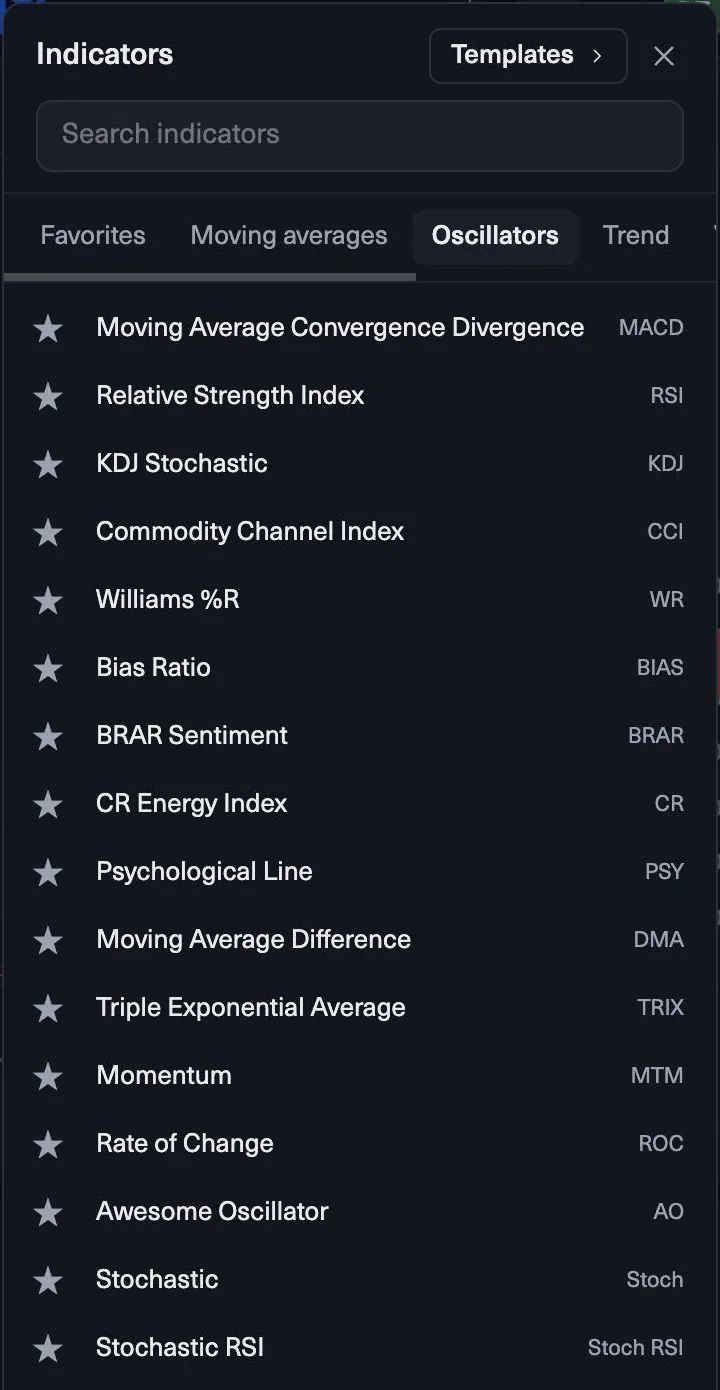
- Indicators. SMA, EMA, VWAP, Bollinger Bands, RSI, MACD and volume, among others.
- Drawing tools. Trend lines, rays, Fibonacci, patterns, shapes and text. They are saved for your next session.
- Economic calendar. In the terminal header, next to your limits.
The markets in your watchlist
On 1-Step Challenge, 2-Step Challenge and Instant Funded accounts the watchlist holds major forex pairs (EURUSD, GBPUSD, AUDUSD, NZDUSD, USDJPY, USDCHF, USDCAD, EURJPY, GBPJPY and EURGBP), gold and silver, and Bitcoin, Ether and Solana.
Open an instrument’s details in the terminal before you trade it. They show its contract size, leverage, commission, swap and trading hours. Your account is in US dollars: on pairs quoted in another currency, such as USDJPY or EURGBP, the terminal converts profit, loss and your limits at the live rate, using the side of the rate that is not in your favour.
A top-down routine
- 1D. Decide the direction you are willing to trade and draw the levels that matter. Because drawings are saved, you do this once and adjust it.
- 4h or 1h. Look at the structure between those levels: is price trending, ranging or stuck at one of them?
- 15m. Find the entry and the place where the idea is wrong. That distance is your stop.
- 1m. Use it only to time the order, not to change your mind about the trade.
Check the economic calendar before step three. A high-impact release in the next few minutes can make a clean setup a coin flip, and your program’s news rule applies around those releases.
Indicators without clutter
Pick a small set and keep it. One moving average, such as an EMA, shows direction. RSI or MACD shows momentum. VWAP is a useful intraday reference for where most volume traded. Bollinger Bands show when volatility is unusually tight or wide. Two or three of these on one chart are plenty; more lines rarely add information and often add doubt.
Use the same set on every timeframe you check, so a signal means the same thing wherever you see it. If you trail stops by ATR, look at the typical range of the symbol on your entry timeframe first; a trail tighter than one normal candle tends to close good trades on noise.
Review on the Report
The Report shows your account curve, a calendar, tags and MAE / MFE for every trade. Use MAE, how far a trade went against you, to check whether your stops are too tight or too loose. Use MFE, how far it went in your favour, to see whether your take profits leave too much behind. Tag each trade by setup and the Report shows which ones actually work for you. Review it once a week, on a day you are not trading, so the numbers guide the next week instead of the last trade.
Quiz
Check yourself
0 / 3
Lesson complete
Nice work. … of 5 lessons in MyFundedCapital Terminal done.
MyFundedCapital School
MyFundedCapital Terminal checklist
Rules as of 17 Oct 2026. Tick each line before your next session.
1. How do you log in to MyFundedCapital Terminal for the first time?
- Two sign-ins: the Dashboard uses your order email; the terminal uses the login shown for each account.
- Nothing to install: it runs in Chrome, Edge, Safari or Firefox on your computer or your phone.
- Never share a password or a one-time code, not even with support.
2. How do you place an order with a stop loss and take profit?
- Every ticket shows the loss if the stop hits and what each limit would have left after it.
- Fit to limits sets the largest volume that fits; your own risk plan usually calls for less.
- One net position per symbol: no hedging, and Reverse flips a trade in one reviewed order.
3. How do you track your daily loss limit in the terminal?
- The header shows dollars left for the daily and the overall limit; the smaller one is your real room.
- Open losses count: the plan checks equity, not only closed trades.
- A personal daily limit below the plan’s pauses new trades for the rest of the day.
4. How do you use charts and timeframes in MyFundedCapital Terminal?
- Thirteen timeframes, from one minute to one month, on every symbol in the watchlist.
- Drawings are saved, so mark your levels once on the higher timeframe.
- Custom indicators are not supported; the built-in set covers the basics. Expert advisors run only by agreement, so write to support before you use one.
5. How do you request a payout in the MyFundedCapital Dashboard?
- Eligibility is a date plus conditions; the Dashboard shows both before you submit.
- Identity verification through Didit in the Dashboard must be done before your first payout.
- Processing averages 1:46h from request to approval, by bank transfer, e-wallet, crypto or local method.
myfundedcapital.com/learn/
Questions
Do my MT5 indicators work in the terminal?
No. Custom indicators are not supported. The chart has SMA, EMA, VWAP, Bollinger Bands, RSI, MACD and volume, plus drawing tools saved for your next session.
How is profit shown on pairs not quoted in US dollars?
Your account is in US dollars. On pairs such as USDJPY or EURGBP the terminal converts profit, loss, margin and limits at the live rate, using the side of the rate that is not in your favour.
Related lessons
Tools and rules
Rules shown here come from the help center and the live rulebook; your program terms apply.