

The popular advice to optimize a strategy until its equity curve looks smooth gets algorithmic trading backtesting backward. A smooth curve is a rehearsal, not a payout, and a more useful test asks whether the rules survive realistic fills, higher costs, and an honest accounting of every variation you tried.
Why a Strong Backtest Can Still Lose Money
A backtest resembles a dress rehearsal where the cast already knows the ending. Everything can run beautifully in an empty theatre, but that doesn't tell you how opening night will go.
Algorithmic trading backtesting means applying fixed trading rules to historical market data to estimate how those rules might have behaved. You specify when to enter, how much to trade, when to exit, and what the simulator should assume about execution.
Say you build a breakout strategy. It buys after a completed bar breaks a previous high and exits when a stop or reversal condition triggers. Your software produces an attractive equity curve, but you still need to establish whether the orders could have filled at the prices shown.
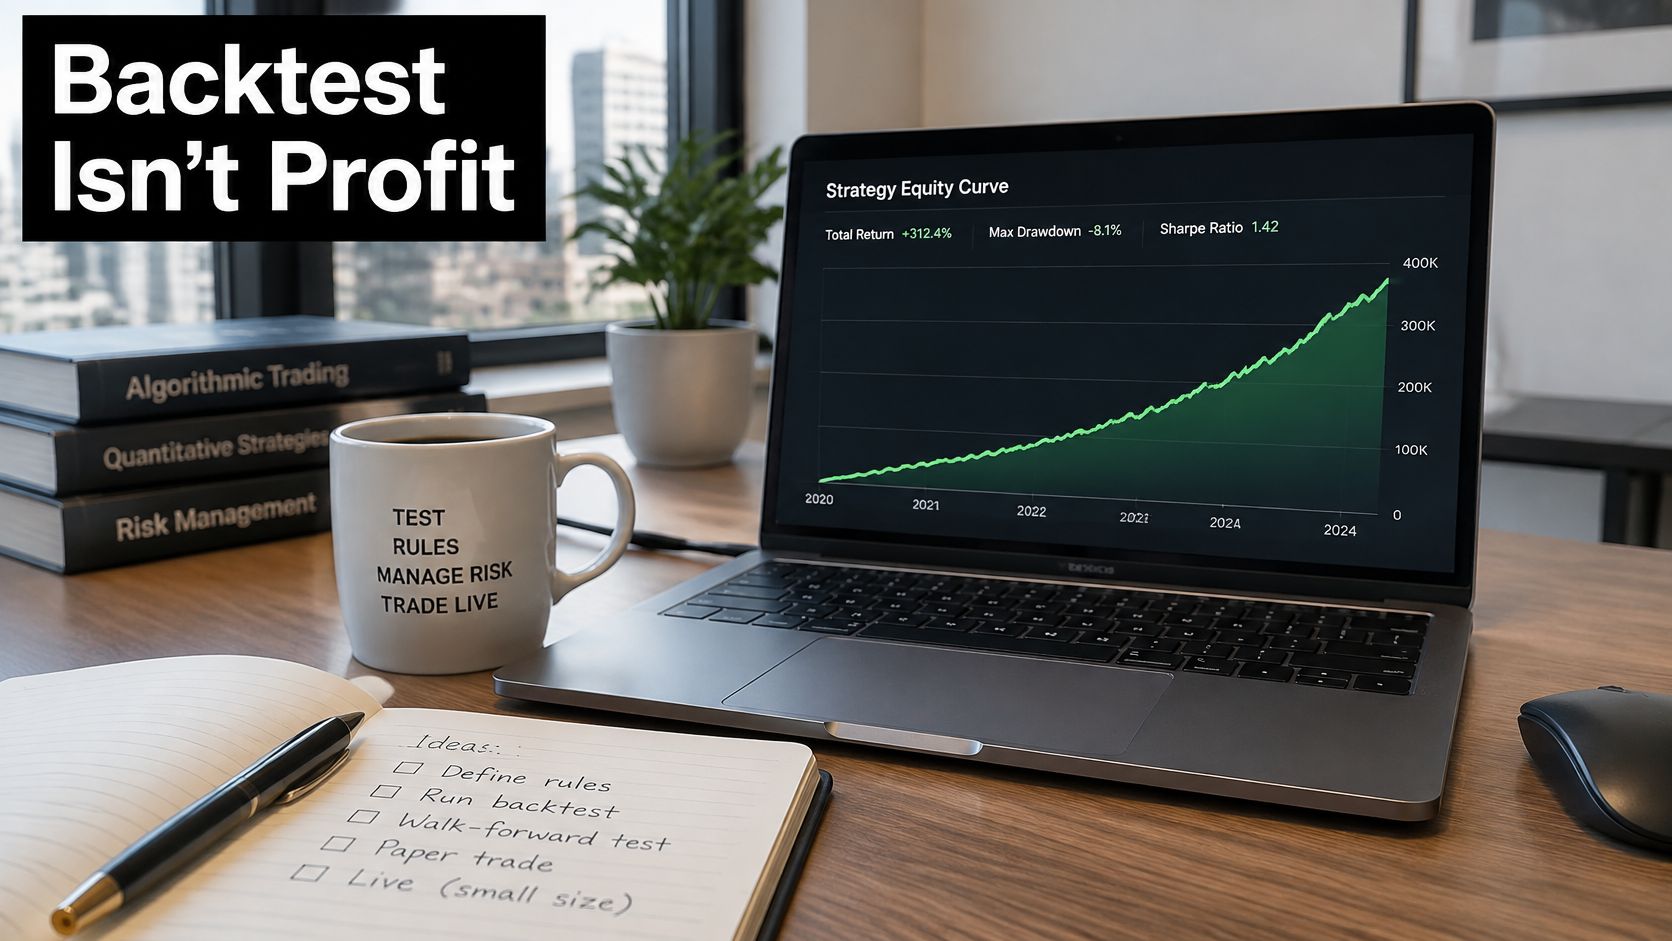
Separate the simulation from the trading record
The SEC's investor guidance warns that backtested performance doesn't reflect actual performance and recommends asking whether a strategy also has real historical results, so label simulated return, win rate, and drawdown as hypothetical and keep them separate from live results (SEC investor bulletin).
Your report should make the test reproducible, not merely attractive:
- Test period and market Identify the historical window, instruments, trading sessions, and bar interval.
- Data source Name the provider and explain whether you used trades, quotes, or aggregated bars.
- Execution assumptions Describe spreads, commissions, order delays, slippage, and financing.
- Trading status State whether the strategy was traded during that window or existed only inside the simulator.
A useful report lets another trader challenge the assumptions. If they can't tell whether your stop filled at its trigger price or the next available quote, they can't interpret the drawdown.
Practical rule: Treat a backtest as evidence for further testing, not permission to trade.
The working toolkit is a cost grid, a fill model, walk-forward testing, Monte Carlo analysis, paper trading, a metric sheet, and a trial log. Together, these help distinguish a plausible strategy from a simulation that benefited from convenient assumptions.
Trading involves the risk of loss, including losses that historical testing didn't anticipate. This article is educational only and isn't financial advice.
Data and Infrastructure Before the First Run
A strategy can use only the information available at its decision point. Before running it, list what the rule needs to know and check whether the historical data contains it.
For example, a strategy that enters at a bar close needs correctly timestamped bars. A strategy placing short-lived limit orders needs more execution detail than daily closing prices can provide. The finer the order timing, the more detail the test needs to represent it.
Collect information the strategy could actually have used
Keep the time zone explicit throughout the data pipeline. When combining timeframes, make a higher-timeframe value available only after its bar closes. Otherwise, the test may use information that was not yet known.
Use bid and ask quotes where possible. A midpoint series can describe price movement, but it cannot show the price available to buy or sell.
Data and infrastructure checklist before a backtest
| Item | Why it matters | Check before trusting a result |
|---|---|---|
| Bid and ask quotes or recorded spread by session | Models the real entry and exit cost | Check how spreads vary by session |
| Timestamped bars or ticks with stated time zone | Prevents using a higher-timeframe bar before it closes | Confirm each signal uses only closed bars |
| Symbol list as of each historical date | Keeps delisted names in the test | Record the list date and source |
| Swap or funding schedule | Captures overnight carry on held positions | Confirm it matches the broker or venue |
| Corporate actions and contract rolls | Avoids false price jumps | Confirm splits and rolls are applied |
| Versioned rules and trial log | Lets you count trials and reproduce runs | Save the rule file before each run |
Investigate unusual price moves before changing the data. A sharp move could be a bad tick, a contract change, or a genuine market event. The reason determines whether correction is appropriate.
Build a setup you can rerun
A Python notebook, a platform strategy tester, or a spreadsheet can suit a simple rule. What matters is that the inputs and steps are clear enough to repeat.
Keep the data store, order engine, and cost module separate from the signal code. Save the rule version, dataset identifier, configuration, and output together. That way, a rerun can use the same inputs instead of picking up a changed file or setting.
Follow a consistent run order:
- Audit the files Check gaps, duplicate bars, timestamps, and suspicious adjustments.
- Freeze the rules Save entries, exits, sizing, and order handling before viewing results.
- Run and record Evaluate the development sample and save the complete trade log.
- Challenge the output Test execution scenarios and validation before drawing conclusions.
For hands-on familiarity before building a larger testing setup, you can practice strategies with educational paper trading. Use a demo account that mirrors your target platform to make order instructions precise. Practice can help with order handling, but it does not establish that a strategy has an edge.
Run a Cost Grid Before You Trust the Edge
If a small increase in plausible costs removes the edge, don't trade the rule. Improving its historical entry timing won't solve an execution bill larger than its expected advantage.
Consider a hypothetical strategy with 15 basis points of gross edge per trade: applying 10 basis points of transaction cost leaves about 5 basis points before additional execution effects, illustrating the narrow margin discussed in a walk-forward validation study. Extra slippage, overnight financing, or missed fills could consume what remains.
Keep the signal fixed while changing costs
The purpose of a cost grid is to isolate sensitivity. If you change the entry rules whenever costs rise, you're testing another strategy rather than checking the original one.
- Measure gross expectancy on the development sample in basis points per trade. Keep sizing consistent so the comparison remains meaningful.
- Rerun the frozen rules across the cost rungs in the table. Record net expectancy and risk-adjusted performance at each rung.
- Build a complete cost ledger. Include spread, commission, slippage, and applicable swap or funding without double-counting costs already embedded in execution prices.
- Judge the realistic rung. A profitable frictionless result isn't the relevant deployment result.
- Publish an outcome range. Show what happens under normal, adverse, and stressed assumptions rather than selecting the most flattering return.
Be precise about single-trip versus round-trip cost. If your simulator charges on entry and exit, make sure your reported per-trade total reflects both sides.
A 2023 cross-market study tested technical rules across 23 developed and 18 emerging markets, raised single-trip costs in 5-basis-point increments, and found that at costs of at least 20 basis points, only 5 developed and 4 emerging markets retained significantly outperforming rules. Its portfolios formed from out-of-sample signals generally underperformed buy-and-hold once costs became positive.
Cost grid for keeping or rejecting a backtest
| Single-trip cost | What it stands for | What to do |
|---|---|---|
| 0 basis points | Gross signal with no friction | Baseline only; do not deploy |
| 5 basis points | Tight spread or a low commission | Check that expectancy stays positive |
| 10 basis points | A modest realistic cost per trade | A 15 bp gross edge retains about 5 bp |
| 20 basis points | Wider spread, slippage, or news | Only 5 developed and 4 emerging markets kept significant rules in the 2023 study |
| 30 basis points | Stressed liquidity or partial fills | Reject the rule if expectancy or risk-adjusted return collapses |
Treat the grid as a decision tool
These are sensitivity assumptions, not universal prices for every instrument. Calibrate the relevant rung using the venue, session, order type, and size you intend to trade.
If you need to distinguish the quoted spread from other charges, use this explanation of spreads in trading. Your simulator should debit the actual buying and selling sides rather than treating the chart price as executable.
A strategy that requires unusually cheap execution needs evidence that you can obtain it, not a more optimistic spreadsheet.
Reject a rule whose profit disappears between the lower and higher plausible rungs. Keep borderline ideas in development rather than assuming future execution will rescue them.
Model the Fill Not Only the Signal
Rerun your frozen strategy under normal spreads, widening spreads, delayed fills, partial fills, rejected orders, and adverse slippage. These scenarios test different weaknesses, so don't compress them into a single average deduction.
The signal is a wish. The fill is the price available after accounting for the orders ahead of yours.
Reconstruct the order lifecycle
Start with the quote available when the algorithm makes its decision. Apply processing and transmission delays, check whether the order is accepted, determine available quantity, and update the position only after the simulated fill.
For limit orders, touching the limit price shouldn't automatically mean your entire order filled. For stop orders, distinguish the trigger from the eventual execution price.
As a reality check rather than an estimate for every asset, an execution-modeling analysis describes implementation shortfall of roughly 0.5%–1% for less-liquid small-cap stocks and 0.15%–0.3% for mid-cap stocks under normal conditions. Don't transfer those equity ranges directly to an FX or crypto strategy.
Use scenario-specific behavior:
- Normal spread Replay typical session quotes and ordinary execution delays.
- Spread widening Reprice both entry and exit during opens or news conditions.
- Delayed fills Move execution to a later available quote rather than preserving the signal price.
- Partial fills Reduce the filled quantity and define what happens to the remainder.
- Rejected orders Apply explicit retry, cancellation, or shutdown rules.
- Adverse slippage Move execution against the position, including stop exits.
A separate explanation of slippage in trading can help distinguish execution-price differences from the spread itself. Log both separately when your platform provides enough detail.
Test clustered execution problems
For FX, index CFDs, and crypto, don't assume the commission shown on a broker page captures the important execution risk. Examine spread spikes, thin books, and gaps around market closures or weekend conditions.
Add market impact when the intended order is large relative to available depth. Include financing or swap whenever the position remains open across the venue's charging boundary.
Operational controls belong inside the simulation too. The CFTC's automated-trading safeguards materials identify pre-trade controls, post-trade reporting, and system safeguards as core protection areas; test position limits, duplicate-order prevention, margin checks, and shutdown behavior accordingly.
A strategy can remain profitable after average costs yet fail a hypothetical 5% daily-loss limit or approach a 10% maximum-drawdown cap when unfavorable fills cluster. Model those as example account constraints, including how floating losses and the daily reset are calculated.
Improving the signal won't fix a retry loop or an oversized partial position. Report a profitability band across the execution scenarios, and record whether each path stays within the intended loss rules.
Walk-Forward Monte Carlo and Paper Trading
Validation methods answer different questions. Walk-forward testing checks whether parameter choices transfer, Monte Carlo analysis checks sensitivity to the observed path, and paper trading checks live operation.
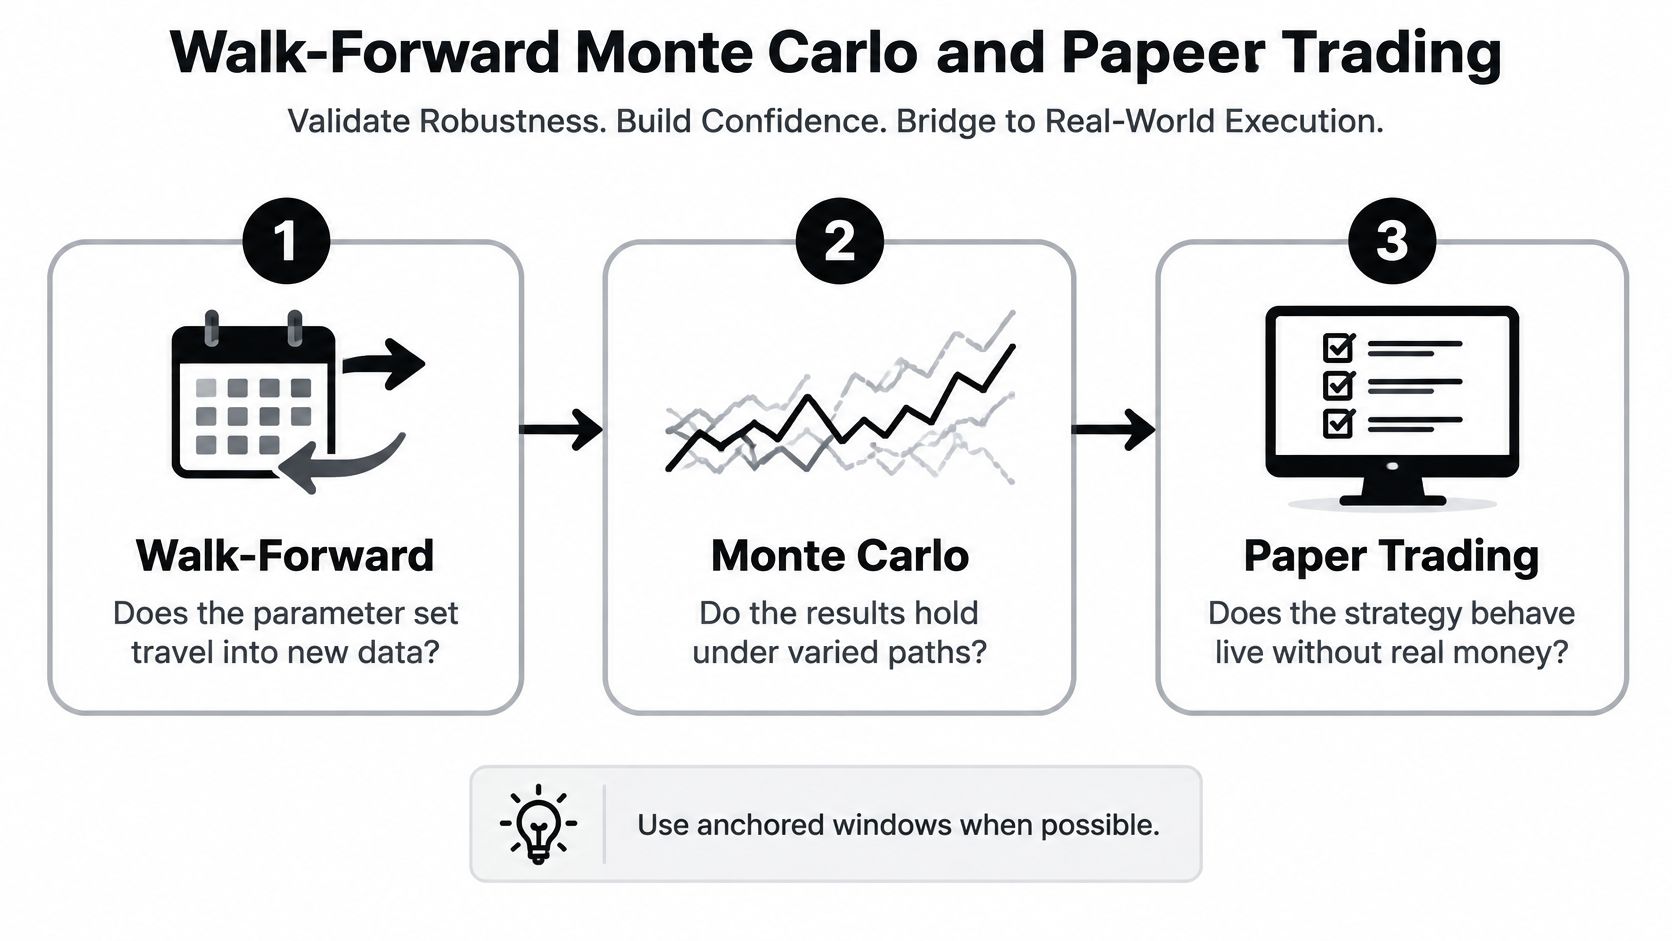
Walk-forward tests whether parameters travel
Choose your optimization objective before running the process. Otherwise, switching between return, drawdown, and Sharpe after inspecting results becomes another hidden selection decision.
An anchored walk-forward keeps the beginning of the development window fixed while expanding its end. A rolling window instead drops older observations as it advances.
- Choose the development window. For a hypothetical exercise, start with about 12 months, provided it contains enough relevant trading opportunities.
- Select parameters inside that window only. Use a predefined selection rule rather than choosing the prettiest curve.
- Evaluate the next unseen block. An illustrative block might cover about 3 months, with no tuning during that block.
- Advance and stitch the unseen blocks together. Judge the combined out-of-sample path rather than the strongest individual window.
Those example durations aren't universal requirements. Slow strategies may need longer windows, while shorter windows can leave too few trades to support a meaningful decision.
Monte Carlo tests sequence dependence
Your observed trade order is only one possible path. Reshuffling trades can reveal whether the original drawdown benefited from winners arriving before losers.
For an illustrative analysis, generate around 1,000 simulated paths, then inspect the spread of ending results and drawdowns. Treat that path count as a modeling choice, not a guarantee of statistical reliability.
Choose the resampling method carefully. Simple reshuffling assumes more independence than some strategies possess; block resampling can preserve stretches of related returns.
Also respect position-sizing mechanics. If size changes with equity, recompute the path rather than merely rearranging fixed cash profits.
Reshuffling doesn't create an edge, and it doesn't repair a historical sample you've already used for tuning.
Paper trading tests real-time behavior
Run the frozen system on real-time demo quotes and compare intended orders with actual demo acknowledgments and fills. Check timestamps, rejected orders, position sizes, and platform state after reconnecting.
As an example operating plan, observe it for 30 to 90 trading days, extending the period if the strategy trades infrequently or encounters only quiet conditions. The calendar is less important than collecting enough representative execution events.
Paper fills still aren't proof of real-money execution quality. Use them to identify mismatches between the simulator and the target platform, especially when stops, retries, or session boundaries behave differently.
Keep an exception log with the expected action, observed action, likely cause, and corrective test. A code change should produce a new version and a fresh comparison, not an undocumented patch.
Walk-forward tests travel, Monte Carlo tests luck of sequence, and paper trading tests the broker's market.
Stop Look-Ahead Bias and Overfitting
A backtest can look impressive because it used information that was not available at the time, or because it was tuned to a narrow stretch of history. Look-ahead bias means a strategy receives future information; survivorship bias means today's surviving instruments stand in for the choices available historically.
A timing leak can occur when a completed higher-timeframe bar is attached to a lower-timeframe entry made before that bar closed. Check each signal against the raw timestamps. Misaligned timeframes can inflate measured performance, so an indicator column alone is not enough to confirm that the strategy acted on information available at the time.
Check timing and universe membership
The historical list of tradable instruments matters as much as price accuracy. A 2024 Springer Nature stop-loss study used daily NASDAQ-100 stock data from January 2014 through January 2024, with stocks selected as of May 2024. That setup illustrates why a backtest should use the membership information available at each historical point, rather than a later list.
The study design does not quantify survivorship bias in the reported result. To limit that bias, reconstruct the historical opportunity set, including securities that later disappeared.
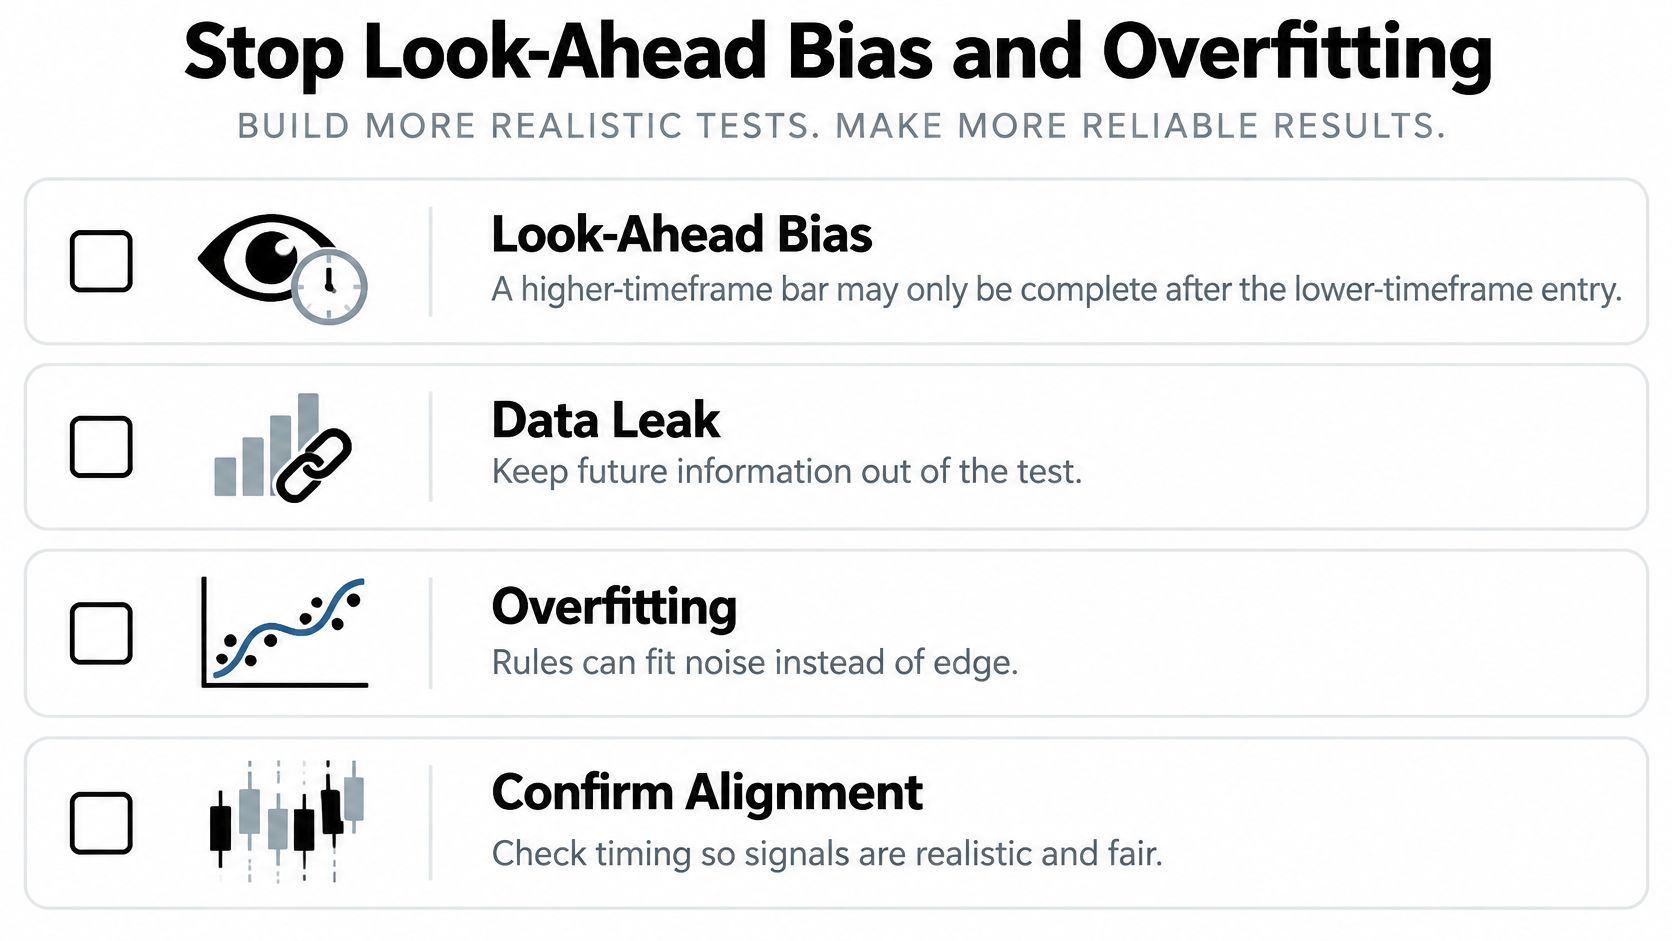
Count the search, not just the winner
Overfitting is a model-selection problem. Each change to symbols, filters, timeframes, parameters, or execution rules creates another chance to select a result that fits historical noise.
In their work on backtest overfitting, Bailey and López de Prado define the probability of backtest overfitting in terms of a strategy selected for strong backtest performance later underperforming. Their combinatorially symmetric cross-validation framework repeatedly divides history into training and testing partitions to assess selection risk.
Underperformance does not necessarily mean a strategy loses money. Also, a holdout period stops being untouched once its results influence research decisions.
Keep one research log and use it consistently:
- Register each configuration. Record every symbol, feature, parameter set, and execution variation before reviewing results.
- Reserve a final period. Exclude it from development decisions and routine dashboards.
- Freeze the complete rules. Set sizing, costs, exits, and operational behavior before the final test.
- Account for multiple comparisons. When comparing many strategies, consider White's Reality Check or Hansen's Superior Predictive Ability test.
- Perturb the parameters. Check whether nearby settings produce broadly similar behavior, rather than relying on one isolated performance peak.
- Inspect distinct regimes. Separate trending, ranging, crisis, and quiet conditions, and identify where losses concentrate.
A less spectacular result that holds across different conditions is more informative than a curve fitted to one era. Report a range of results under stressed costs, and account for how many variants were tried, instead of relying on one headline return. No selection method can turn historical performance into a promise of future results. This is education, not financial advice.
Metrics to Report and What They Cannot Prove
A polished signal matters less than a realistic account of how orders fill. Report results across stressed cost assumptions, alongside how many configurations you tried. A single headline return can hide both.
Backtest metrics and the question each one fails to settle
| Metric | What it measures | Limit |
|---|---|---|
| Expectancy (basis points per trade) | Average net result per trade after the chosen costs | Can disappear when costs rise |
| Profit factor | Gross profit divided by gross loss | A few outlier trades can inflate it |
| Win rate | Share of trades that make money | Can be high while expectancy is negative |
| Sharpe ratio | Return relative to variability | Is not a reliable standalone forecast of later performance |
| Maximum drawdown | Largest peak-to-trough loss | Does not show whether daily-loss rules were breached |
| Return divided by drawdown | Return relative to the depth of the largest loss | Remains hypothetical without independent validation |
Read the metrics together
Win rate is easy to misread. A strategy can win often and still lose overall if its average losing trade is much larger than its average winner.
Expectancy makes that trade-off visible. Average the net result across all trades, including losses and the execution costs you assumed. For example, a high win rate does not compensate for large losses if the resulting average net trade is negative.
Maximum drawdown also needs context. State whether it is calculated from closed balance or marked-to-market equity. An overall drawdown figure does not establish that the strategy stayed within every daily-loss limit.
A study of 888 algorithmic strategies, each with at least six months of out-of-sample performance, found that commonly reported backtest metrics, including Sharpe, had explanatory power below R² = 0.025 for subsequent performance. The study also found an association between more backtesting and a wider gap between historical and later results.
That association is consistent with repeated selection fitting noise. More optimization does not automatically mean stronger evidence. Compare the profit range under higher costs with the result under your base assumptions, and report how many variants were tested.
Add selection and operational context
The deflated Sharpe ratio, developed by Bailey and López de Prado, adjusts for selection across trials and returns that are not normally distributed. It can put an optimized Sharpe ratio in context, but it does not replace realistic execution assumptions.
A return ratio can conceal operational failures. Track:
- Daily-loss breaches Count violations using the account's actual calculation method.
- Time underwater Measure how long equity stays below its previous peak.
- Execution exceptions Record rejected orders, unmatched positions, and shutdown events.
Place each metric beside its cost assumptions and configuration count. These figures help describe what the backtest did under specified conditions; they cannot promise what a live strategy will earn. This material is for education, not financial advice.
FAQ on Algorithmic Trading Backtesting
How much history is enough?
Several years can be a practical starting range, but sufficient history must include different conditions on the bar size you trade. A long daily dataset and a short intraday dataset don't contain equivalent evidence, and overlapping trades may tell you less than their count suggests.
- Next action: Map the sample into trend, quiet, and crisis periods before deciding whether it is representative.
Is a high Sharpe ratio enough to go live?
No. You need to know how the strategy was selected, what execution assumptions it used, and whether its risk remains acceptable after those assumptions become less favorable. A strong ratio from an undocumented search isn't a deployment decision.
- Next action: Require a written trial count and a cost-sensitive result before approving a forward test.
Does paper trading replace the backtest?
No. It checks real-time behavior after historical testing, including whether the platform processes your instructions as expected. It can't reconstruct unseen historical evidence after you've already used that period to tune the strategy.
- Next action: Compare the demo order log against the simulator's expected actions and investigate mismatches.
Can a backtest guarantee a funded-account payout?
No. Simulated profitability doesn't guarantee evaluation success, compliance with account rules, or any payout. An otherwise profitable system can breach a daily-loss or drawdown rule, and trading involves the risk of loss.
- Next action: Translate the target account's rules into executable simulation checks before committing to an evaluation.
Match the Backtest to a Funding Rule Set
Don't start a challenge because the equity curve looks good. Move forward only when the cost-grid range, execution-scenario band, and untouched test remain compatible with the rules you'll trade under.
Treat the funding decision as a compatibility check. A self-funded broker account, a demo research account, and a prop evaluation can impose different constraints even when the same algorithm generates the signals.
Compare conditions before choosing a path
MyFundedCapital is one option to assess: its evaluations and funded accounts operate in demo environments with real market quotes, and it allows manual trading, algorithmic trading by agreement with support, and copy trading between your own accounts and from other traders or signal services, within the trading rules. Its challenge rules describe Instant Funding, 1-step and 2-step challenges, account sizes from $5K to $100K, scaling paths up to $500K, a flat 5% daily-loss limit, up to 10% maximum drawdown, and profit splits starting at 80%, up to 95% with the split add-on.
All accounts trade in the MyFundedCapital Terminal, across 750+ forex, index, crypto, and commodity markets (plus 1,500+ US stocks in the Stocks program). Confirm current platform availability and the selected account's terms before adapting or purchasing an algorithm.
Use the rule set as a checklist:
- Loss calculations Establish the reset time, equity treatment, and exact breach conditions.
- Trading permissions Confirm how the chosen account handles automated strategies, copying, news, and weekend positions.
- Platform compatibility Test order types, symbol specifications, sizing increments, and reconnection behavior.
- Execution margin Leave room between modeled losses and the account's hard limits rather than sizing directly to the boundary.
Make the go-or-no-go decision explicit
Write down what would disqualify the strategy before choosing an account. If realistic execution produces rule breaches, reduce risk and retest, revise the system, or decline the challenge.
Profit-sharing terms don't compensate for a fragile execution model. Nothing here promises profits, and trading losses or rule breaches can cost you the account; this remains educational content, not financial advice.
MyFundedCapital offers simulated-capital funding paths for traders using manual or automated strategies. Visit MyFundedCapital to compare account types and challenge conditions, then choose a path only if your frozen strategy has survived realistic costs, execution stress, and the applicable loss rules.
