Slippage, the gap between the price you target and the price you actually get, can erode profits faster than you expect. In this guide on what is slippage in trading, you’ll learn practical steps to measure, manage, and minimize slippage for better execution. Trading involves risk of loss; this content is educational only and not financial advice.
Essential Slippage Overview
Markets don’t wait for your order to arrive. You might place a buy at $100 only to see it fill at $100.05 when volatility spikes.
That small difference can add up quickly. Slippage falls into two camps:
- Positive Slippage: Your order executes at a better price than you targeted.
- Negative Slippage: The fill drifts against you, shaving off potential gains.
Key Takeaway: Slippage touches every trader, from rookie to veteran.
Knowing how much wiggle room to expect helps you set realistic entry and exit points.
Summary of Slippage Types
Before we dig deeper, here’s a side-by-side comparison:
| Type Of Slippage | Definition | Typical Impact |
|---|---|---|
| Positive Slippage | Order executes at a more favorable price | Adds small gains, especially in calm markets |
| Negative Slippage | Order fills at a less favorable price | Cuts into profits or deepens losses during spikes |
This table gives you a quick snapshot of what each swing means for your bottom line.
Start by logging the difference between your target and executed prices on every trade. Over time, you’ll see patterns emerge.
- Protect profit margins against hidden costs
- Measure your broker’s execution quality
- Choose order types suited to market speed
Treat slippage as you would any risk metric
A few cents in positive slippage can stack up into meaningful gains over dozens of trades. On the flip side, negative slippage can quietly erode returns when positions are large or during sudden price gaps.
Glance at this table before each session to remind yourself of typical slippage ranges. Hold these insights in mind with every order so you’re ready for sudden moves.
Next, we’ll dive into the causes, precise measurement methods, and tactics to keep slippage in check.
Understanding Slippage Causes And Types
When you click “buy” or “sell,” the market doesn’t always match you at the price you saw. That gap is slippage, and it shows up when live fills drift away from your intended entry or exit. Let’s break down why it happens and how to spot it before it cuts into your profits.
Imagine the order book as a busy highway. Every pending trade is a car inching toward execution. When too many vehicles flood one lane, traffic stalls or reroutes.
- Market Volatility: Big orders or surprise news can send prices on a detour.
- Thin Liquidity: Few bids and offers mean large trades push through to worse levels.
- Order Type: Market orders rush through every price tier, while limit orders hold their ground.
- Algorithmic Flows: HFT programs can swoop in microseconds and drain available volume.
Order Book Traffic Jam Analogy
Picture the London forex session right as an interest-rate decision drops. Prices leap through shallow bids, like cars squeezing through a suddenly opened lane. Your buy order might end up several pips higher than planned.
On a quiet weekend in crypto, a single whale can spawn a cascade of fills at unexpected prices. These micro “traffic jams” can pile up slippage costs faster than you’d imagine.
“Traders who read depth-of-book like traffic density can pick smoother windows to enter.”
Positive And Negative Slippage
Slippage isn’t always your enemy. It comes in two flavors, each with a clear impact on P&L:
- Positive Slippage
You place a buy at $1.0000 and actually fill at $0.9995, or you sell above your target. These little wins add up. - Negative Slippage
Fast price moves push fills beyond your stop or entry, shaving off gains or inflating losses.
For example, during the London–New York overlap, EUR/USD market orders often net 0.2 pip in your favor. Contrast that with quiet Asian hours, where stop orders can incur up to 1.5 pip deficits.
Volume And Liquidity Effects
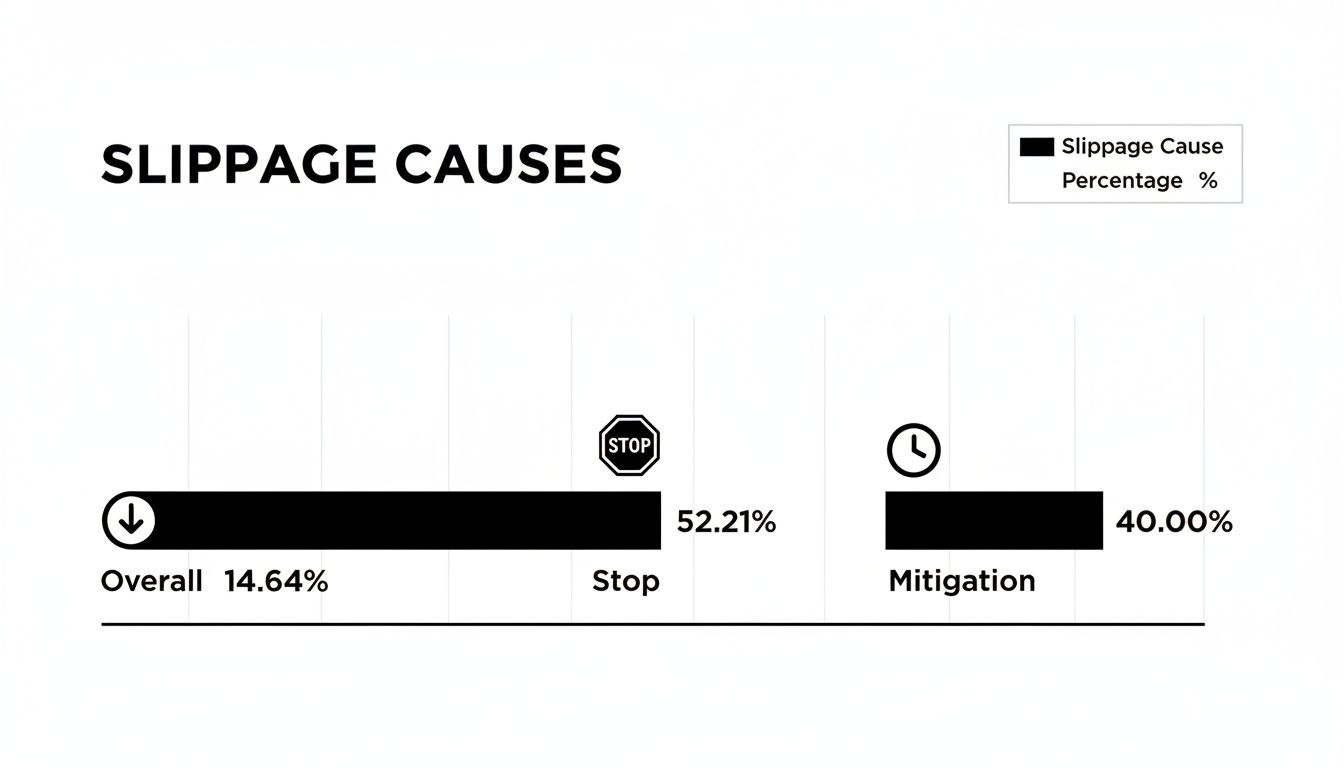
FXCM’s 2024 report records 14.64% negative slippage overall and a staggering 52.21% on stop orders under heavy volume. After-hours NYSE sessions slump by 70–80% in turnover, sending slippage risk skyward. In Asia’s thin forex hours, EUR/USD slippage is about 25% higher than during the London overlap.
By:
- Breaking large trades into smaller chunks
- Using iceberg limit orders
- Timing entries between 8–11 AM GMT
you can trim execution costs by roughly 40%. You can dive deeper in this NordFX article.
Timing your orders away from peak stress points and watching book depth before you hit send will keep slippage from eating your edge.
Check out our guide on trading during news events
Spotting Slippage Triggers
Turn these factors into a quick pre-trade checklist:
- Session overlaps (e.g., London/New York)
- Scheduled economic releases
- Sudden volume spikes or droughts
Match order size and type to the current market “traffic.” With practice, you’ll read those early warning lights and keep your fills on track.
Measuring Slippage With Real Examples
When you log slippage on every trade, hidden execution gaps jump off the page. Over time, you’ll see exactly where your fills stray from expectations—and why that matters.
Begin by opening a simple spreadsheet or journal. Jot down the target price at order submission alongside the actual fill price. Add columns for instrument, order type, time and market conditions. This transforms slippage from a vague concept into concrete data you can analyze.
Next, use a straightforward formula to calculate slippage:
(Executed Price − Expected Price) ÷ Expected Price × 100
Run this for each trade, then average your results over a session. You’ll quickly spot whether you tend to win or lose on fills.
Here’s a quick checklist to get you started:
- Record Target Price and Actual Fill Price for every executed order.
- Convert the difference into pips or ticks, then translate it into a percentage.
- Note the symbol, timestamp, order type and a snapshot of volatility.
- Review your weekly or monthly averages to uncover patterns in positive versus negative slippage.
Take FXCM Markets data from January 1, 2024 to December 31, 2024:
- 30.83% of orders enjoyed positive slippage—better prices than expected.
- 14.64% slipped negatively, shaving potential profit.
- Limit entry orders led the pack with 70.80% positive slippage, while stop orders struggled with 52.21% negative swings.
Learn more on FXCM Markets Execution Slippage Statistics.
Tracking Slippage Step By Step
Start by capturing both expected and executed prices at trade entry. Then plug them into the formula and tag each record with order details. Finally, group your data by session or time of day to spot high- or low-slippage windows.
Slippage Rates by Order Type
Below is a side-by-side look at how different order types fared in FXCM’s dataset. Notice how limit orders outperform in choppy markets, while stops carry higher risk.
| Order Type | Positive Slippage Rate | Negative Slippage Rate |
|---|---|---|
| Market | 30.83% | 14.64% |
| Limit | 70.80% | 29.20% |
| Stop | 47.79% | 52.21% |
By comparing these figures, you’ll see where your strategy needs tighter controls or alternative order choices.
Stop orders face the highest slippage risk, demanding tighter controls on stops and execution timing.
Example calculation: a EUR/USD market order at 1.1000 filling at 1.1003 translates to roughly 0.027% slippage—about $27 on a $100,000 position.
A daily slippage journal can add hundreds of dollars of edge when compounded over dozens of trades. Aim to log at least three trades each day. Over weeks, you’ll track your progress and refine execution settings for better performance.
In the next section, we’ll dive into how slippage shapes your overall strategy and impacts P&L.
Effects Of Slippage On Strategies And PnL
Even a tiny bit of slippage, when repeated dozens of times, can erode your trading edge. Over time, those fractions of a pip add up into real dollars—or lost opportunities.
For instance, a scalper who experiences 0.5 pip of slippage across 100 trades each day is giving back roughly 50 pips, or $500, in cumulative costs. Swing traders, with just 10 trades a month, might face 2 pips on both entry and exit—4 pips round trip, equating to about $40 on a $100,000 position.
Scalping Sensitivity To Slippage
Scalping lives and dies by millisecond moves. A small drift in execution can wipe out profit margins fast. Consider:
- 100 scalp trades per day
- 0.5 pip average slippage
- $5 cost per pip on a mini lot
In a month, that stealthy price drift can total $10,000.
Factoring Slippage Into Backtests
Never assume perfect fills in historical tests. A simple approach is:
Executed Price = Expected Price ± Slippage Estimate
Include both best-case and worst-case scenarios, then forward-test in demo or prop-firm setups with the same slippage settings.
Testing slippage in simulation helps you avoid nasty surprises in live markets.
Adjusting Position Sizing And Drawdown Management
When news hits or liquidity dries up, slippage can spike. Here’s how to keep risk in check:
- Set a maximum slippage tolerance (for example, 1% of your stop distance)
- Cut position size if slippage breaches your threshold
- Build extra buffer into your risk-per-trade calculation
A strict drawdown rule is your safety net. If slippage eats 20% of your profits in a week, a hard limit shields your funded account.
Tweaking Entry And Exit Rules To Guard Your Edge
Small tweaks to order types can make a big difference:
- Use limit orders around key support/resistance instead of market entries
- Avoid market-on-close during volatile bars
- Monitor depth-of-book for thin liquidity warnings
Market orders often incur 1–2 pips, while limit entries cap slippage to 0–0.5 pips.
Test these adjustments in both backtests and demo runs to see your P&L stabilize.
Case Study Scalping Versus Swing Positions
In a pure scalping setup, you might enter and exit within seconds. Even 0.3 pip of slippage per trade costs $3 on a mini lot.
Swing traders only take a few positions but feel slippage twice per trade. Three swing entries at 1 pip slip each means 3 pips lost, or $30, eating up 15% of a typical 20 pip target.
- Scalping trades volume for speed and risks tiny drifts
- Swing trading faces larger per-trade slippage but fewer executions
- Over time, net slippage costs can converge
Even a modest 0.1% slippage per trade can shave 2.5% off annual returns.
Recognizing these patterns lets you set realistic goals and protect your edge.
Incorporating Realistic Slippage In Forward Testing
When you move into a prop-firm demo or funded account, log every slippage on each fill. Use your platform’s trade reports or third-party tools to capture price differences in real time. Then:
- Tick the slippage logging option in your DXtrade or cTrader settings
- Compare slippage by instrument to choose tighter pairs or assets
- Retrospectively adjust targets and stops for each symbol
Tracking slippage rigorously not only refines your strategy but also impresses prop-firm auditors. By folding realistic price drift into both backtests and forward tests, you’ll safeguard capital and set achievable performance targets.
Platform Execution And Instrument Slippage
Slippage isn’t a one-size-fits-all issue. It shifts according to your broker’s execution setup and which markets you tap into.
Here, we’ll walk through how different execution models and liquidity levels shape the price you actually receive when your order fills.
Execution Model Impacts
Orders run through various architectures, and each has its quirks:
- ECN routes your trades straight to multiple liquidity pools. In calm markets, you enjoy razor-tight spreads, but during sharp moves, 0.5 pip slips can occur.
- STP funnels orders through the broker’s internal pool. This typically brings moderate spreads and about 0.3 pip of slippage on average.
- Market-Maker models internalize your position, which widens spreads when volatility spikes, sometimes pushing slippage beyond 1 pip.
Visual Slippage Rates By Asset Class
Different instruments react in unique ways to market depth. The chart below illustrates slippage under varying liquidity scenarios.
As you can see, thinly traded markets can punish big orders with slippage soaring to 1–2% or even higher.
Asset Class Liquidity Comparison
Trading volume plays a starring role in how far your order deviates from the desired price. Here’s a quick breakdown based on FXCM’s 2024 report:
| Metric | Value |
|---|---|
| Negative Slippage Overall | 14.64% |
| Worst Fills on Stops | 52.21% |
| Positive Slippage in Liquid Conditions | 30.83% |
| After-Hours NYSE Volume Drop | 70–80% |
| Illiquid Crypto Slippage on $100K+ Orders | 5–10% |
Splitting large trades, deploying iceberg orders, and sticking to high-volume windows (like 8–11 AM GMT) can trim slippage by up to 40%.
Key Insight: Liquidity droughts and off-peak sessions are prime culprits for slippage spikes.
Time Of Day Effects
Time zones and session overlaps dictate liquidity pulses:
- During the London–New York crossover, major forex pairs benefit from deep books and minimal slippage.
- In the Asian session, order flow thins and EUR/USD slippage can climb by 25%.
- NYSE after-hours see volumes plummet by 70–80%, driving slippage higher on thinly traded stocks.
You might be interested in: Learn more about execution integrity and how pricing or executions can be manipulated in my live account.
Best Practices For Instruments
- Stick to major pairs when volume is highest.
- Break giant orders into smaller slices for exotics or small-caps.
- Use iceberg or hidden orders to mask your size in thin markets.
- Keep an eye on the order book depth before you hit “buy” or “sell.”
- Choose platforms that have proven performance under real stress tests.
Broker And Platform Selection
Your choice of broker can make or break your slippage experience. Look for:
- Detailed fill-quality reports and genuine user feedback on execution speed.
- Independent slippage stats from third-party services.
- Direct Market Access (DMA) capabilities or sophisticated order-routing engines.
Testing your setup during high-impact news events is the ultimate reality check for any platform.
Slippage Mitigation Tactics For MyFundedCapital Traders
Slippage can quietly chip away at your gains, especially when you’re trading a funded account. By putting a few simple rules in place, you’ll keep more pips in your pocket. Below, you’ll find practical steps to tighten up your execution on MyFundedCapital.
Choose Ideal Order Types
Order choice makes all the difference. A market order will get you filled fast but expect 1–2 pip moves when volatility spikes. On the flip side, limit orders lock in your price range but might sit unfilled if the market jumps over your level.
- Use a market order on liquid FX pairs during the London–New York overlap
- Place limit entries around support or resistance in swing setups
- Try stop-limit orders to cap slippage and manage risk
Slice Large Trades
Think of a big order as a huge wave crashing in one go. Breaking it into smaller ‘ripples’ helps you blend in with the market.
- Split a 100K lot into 5–10 chunks of 10K–20K
- Space slices during peak volume to prevent one big impact
- Automate the process with an EA or script for reliable timing
Set Realistic Tolerances
Your platform’s slippage tolerance is your guardrail. Too tight and you’ll see rejected orders; too loose and you’ll drift far from your target.
- Cap FX majors at 1% slippage and exotics at 3–5%
- Adjust limits before high-impact news releases
- Review slippage logs weekly to fine-tune settings
Monitor And Log Slippage
You can’t improve what you don’t measure. Logging every fill turns guesswork into clear patterns.
“Once I started tracking slippage in every session, I spotted the worst timeframes and fixed my entry points,” says a funded trader.
- Enable slippage logs in DXtrade or cTrader
- Export daily reports and compare expected vs. executed prices
- Match your log with P&L statements to spot problem instruments
Many traders combine these tactics with an expert advisor for slippage control for extra consistency.
Time Entries Around Liquidity
Liquidity ebbs and flows like tides. Riding the high-volume waves keeps slippage low.
- Focus on the 8–11 AM GMT overlap for tighter spreads
- Consult an economic calendar to sidestep headline shocks
- Disperse orders if you must trade during volatile windows
Compare Routing And Platforms
Different routing models deliver different fill qualities. Below is a quick comparison of our supported platforms:
| Platform | Routing Model | Typical Slippage |
|---|---|---|
| DXtrade | ECN | 0.2 pip |
| cTrader | DMA | 0.15 pip |
| Match-Trader | STP | 0.3 pip |
- Demo-test each platform before committing live
- Place identical orders to compare fills across days
- Set your preferred routing in your account dashboard
By applying these slippage controls—tweaking order types, timing entries, and logging every fill—you’ll protect your funded balance and sharpen your edge. Track your progress weekly, and you’ll see steady gains in execution quality.
Ready to put these tactics into action? Launch your challenge with MyFundedCapital and secure up to $100,000 in funding, flexible risk rules, and weekly payouts.
Check our community forum for advanced slippage tips and peer insights today.
Slippage FAQ
Slippage has a habit of sneaking up and pushing your fill price away from your intended level. In this FAQ, we’ll unpack what slippage really is, show you how to set sensible tolerance levels, adjust your backtests, and choose the right order types. You’ll walk away with clear, actionable steps to close execution gaps and sharpen your trading edge.
How Do I Recognize Normal Versus Excessive Slippage
When markets are calm, slippage might nudge you a few ticks off your target price. That’s normal. But if liquidity dries up or a major news event strikes, you can see spikes that dwarf everyday moves.
Try this quick checklist:
- Check session overlaps—London–New York often offers the deepest liquidity.
- Compare your slippage journal against average pip ranges.
- Highlight any fills that exceed your 1% tolerance threshold.
Key Insight: Slippage under 0.5% usually isn’t a worry; once it climbs above 1%, it’s time to investigate.
What Tolerance Should I Set For Slippage
Defining clear slippage limits helps you avoid nasty surprises in your P&L. As a starting point:
- FX Majors: 1% of your stop distance
- Exotics: 3–5% of stop distance
- Crypto Tokens: 5–10% during low-volume periods
These guidelines balance execution certainty with price drift risks. In demo or prop-firm tests, log every rejection so you don’t accidentally skip crucial orders.
How Do I Add Slippage To Backtests
Skipping slippage in your backtests is like racing blindfolded. Tackle it with a simple formula:
Executed Price = Expected Price ± Slippage Estimate
Run your strategy under best-case and worst-case slippage scenarios. Then compare the equity curves to see how drift affects drawdowns and net returns.
How Do I Choose Order Types To Limit Slippage
Order type matters when markets move fast:
- Market Orders guarantee a fill but can introduce 1–2 pips of slippage.
- Limit Orders cap your slippage around 0–0.5 pips, though they might not fill.
- Stop-Limit Orders blend control with risk management but can leave you unfilled at key levels.
| Order Type | Fill Certainty | Slippage Risk |
|---|---|---|
| Market | High | 1–2 pips |
| Limit | Variable | 0–0.5 pips |
| Stop-Limit | Moderate | 0.5–1 pip |
Use limit orders around major support/resistance and switch to market orders when you know liquidity is deep. Always trial these setups on a demo account first.
Logging every fill in your trading journal reveals patterns you can exploit. It’s the roadmap to continuous improvement.
How Does Slippage Differ Across Assets And Platforms
Slippage varies with liquidity and volatility. FX majors like EUR/USD often slip under 0.2 pips, while exotic pairs or thinly traded crypto tokens might gap 1–3% on orders.
To compare slippage:
- Track fills by asset class in your journal
- Benchmark across platforms like cTrader, DXtrade, and Match-Trader
- Note session overlaps and major news events
Pro Tip: A weekly slippage summary by symbol flags markets where you need tighter order rules.
Use color codes or flags in your journal to spot high-drift instruments. Then adjust position sizes and order types to keep your funded capital protected.
Ready to tighten your execution and safeguard your funded account? Start your challenge with MyFundedCapital and explore our funding programs today!