You've probably done this already. You spot a clean hammer or engulfing candle, jump in, and then watch price chop sideways or rip straight through your stop. That's the gap between recognizing japanese candlestick patterns and trading them well.
Candlestick patterns can help you read momentum, rejection, and shifts in control. But in live markets, especially under prop-style risk limits, the pattern itself isn't enough. You need context, confirmation, and disciplined execution. This article is educational only, not financial advice, and trading always involves risk of loss.
Introduction to Japanese Candlestick Anatomy
Japanese candlestick charting began in the Japanese rice markets and later became standard reading for technical traders in the West, with broader adoption after Steve Nison's Japanese Candlestick Charting Techniques helped introduce the method to a wider audience (candlestick chart history). The history is interesting, but the practical point is simpler. One candle shows the open, high, low, and close in a format you can read in seconds.
That speed matters when you are trading under prop firm rules. If you are one bad impulse trade away from your daily loss cap, you do not need more chart decoration. You need a clean read on who pushed price, who failed, and whether the close supports taking risk at all.
Read the candle for order flow, not labels
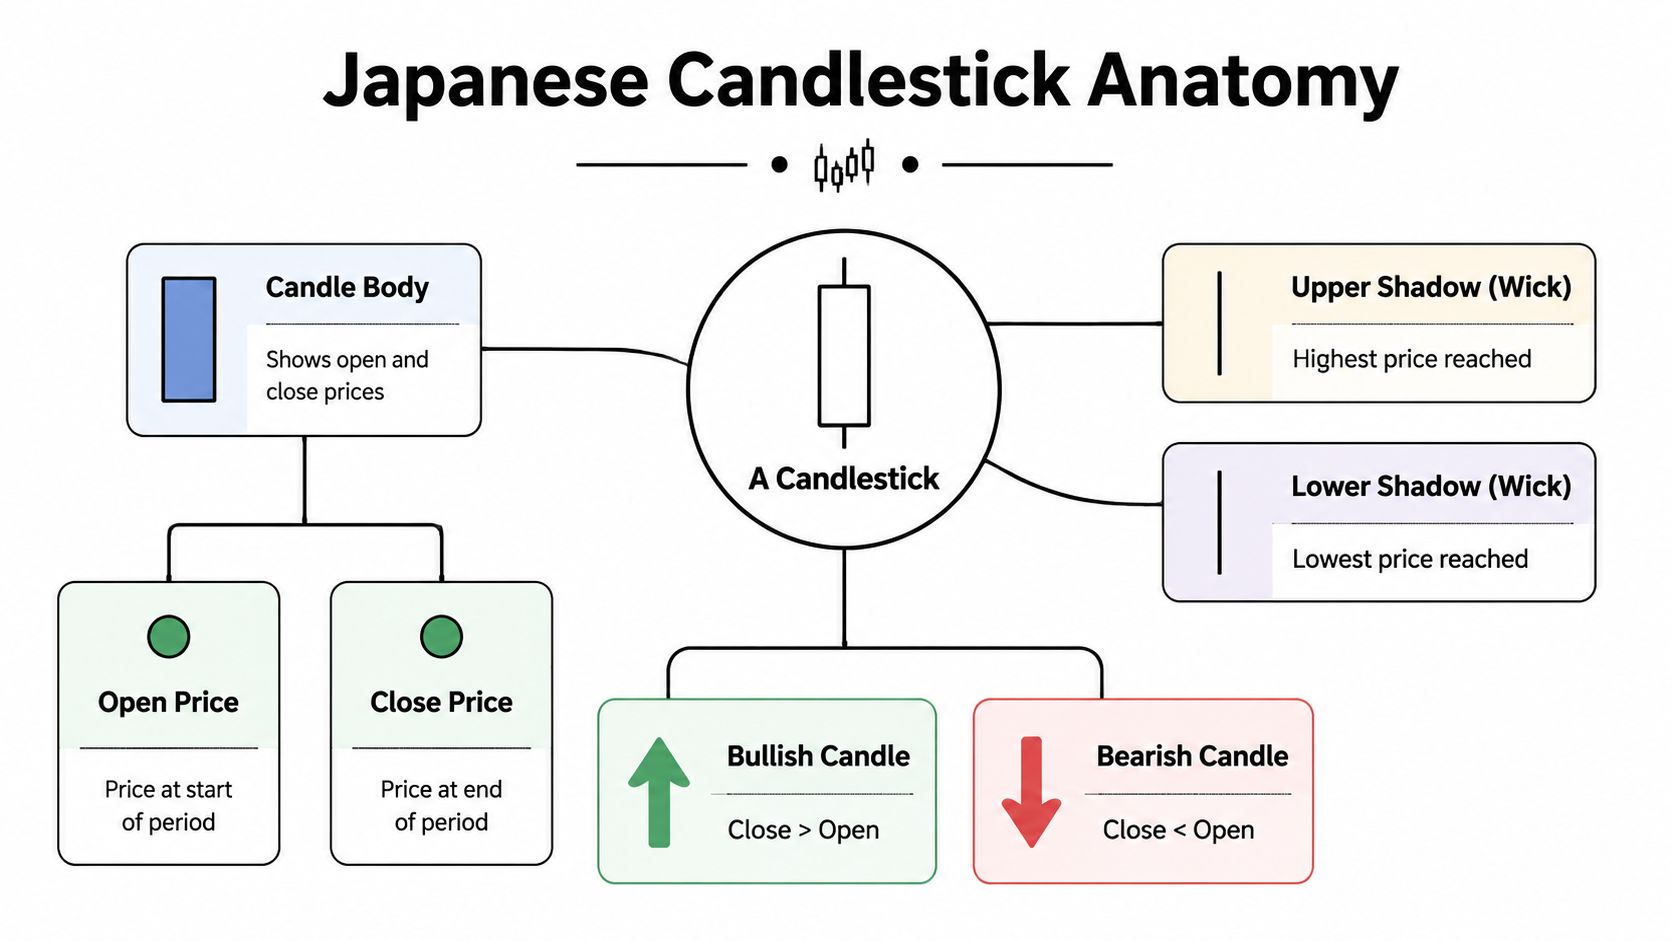
Each candle represents a session of conflict between buyers and sellers.
- The body marks the distance between the open and close. A larger body usually shows firmer control during that period.
- The upper wick shows where price traded before sellers pushed it back down.
- The lower wick shows where price traded before buyers stepped in.
- A bullish candle closes above its open.
- A bearish candle closes below its open.
The label matters less than the behavior inside the bar.
A long lower wick that closes well off the low shows sellers had room to press, but could not keep control into the close. A long upper wick near resistance shows buyers pushed into higher prices and got rejected. In both cases, the wick shows an attempt. The close shows whether that attempt held.
Practical rule: Ask who controlled the close, where the rejection happened, and whether that location justifies risk under your current drawdown limits.
What body size and wicks actually tell you
Body size and wick length help you judge conviction, failed auctions, and hesitation. That matters more than memorizing candle names, especially if you trade FX or crypto during fast sessions where weak entries can hit a prop account hard before the next setup appears.
A quick read looks like this:
Start with the close
The close carries the most weight. It shows where price finished after all the noise inside the candle.Measure control
A wide body with small wicks often shows one side held control into the end of the period. A small body with long wicks usually shows disagreement and poor follow-through.Judge rejection
A long lower wick shows rejection of lower prices.
A long upper wick shows rejection of higher prices.Check location
The same candle can be useful at support, dangerous into resistance, and meaningless in the middle of a range.
Newer traders often stop at anatomy. That is where avoidable losses start. A candle is not a signal by itself. It is a record of behavior, and that behavior only has trading value when it appears in the right place with a stop that fits your risk limits.
For a closer look at building setups from raw chart behavior, study price action trading principles. Candlesticks are one of the clearest ways to build that skill, but only if you read them with context and size positions like your account can be lost by one careless trade.
Decoding Major Single-Candle Patterns
A single candle can save a prop account from a bad entry, or bait a trader into forcing one.
That trade-off matters under firm rules. If you are working with a daily loss cap, one impulsive reversal trade off a random candle can do more damage than missing three clean setups. Single-candle patterns help most when they tighten decision-making. They help least when traders treat them like automatic buy or sell buttons.
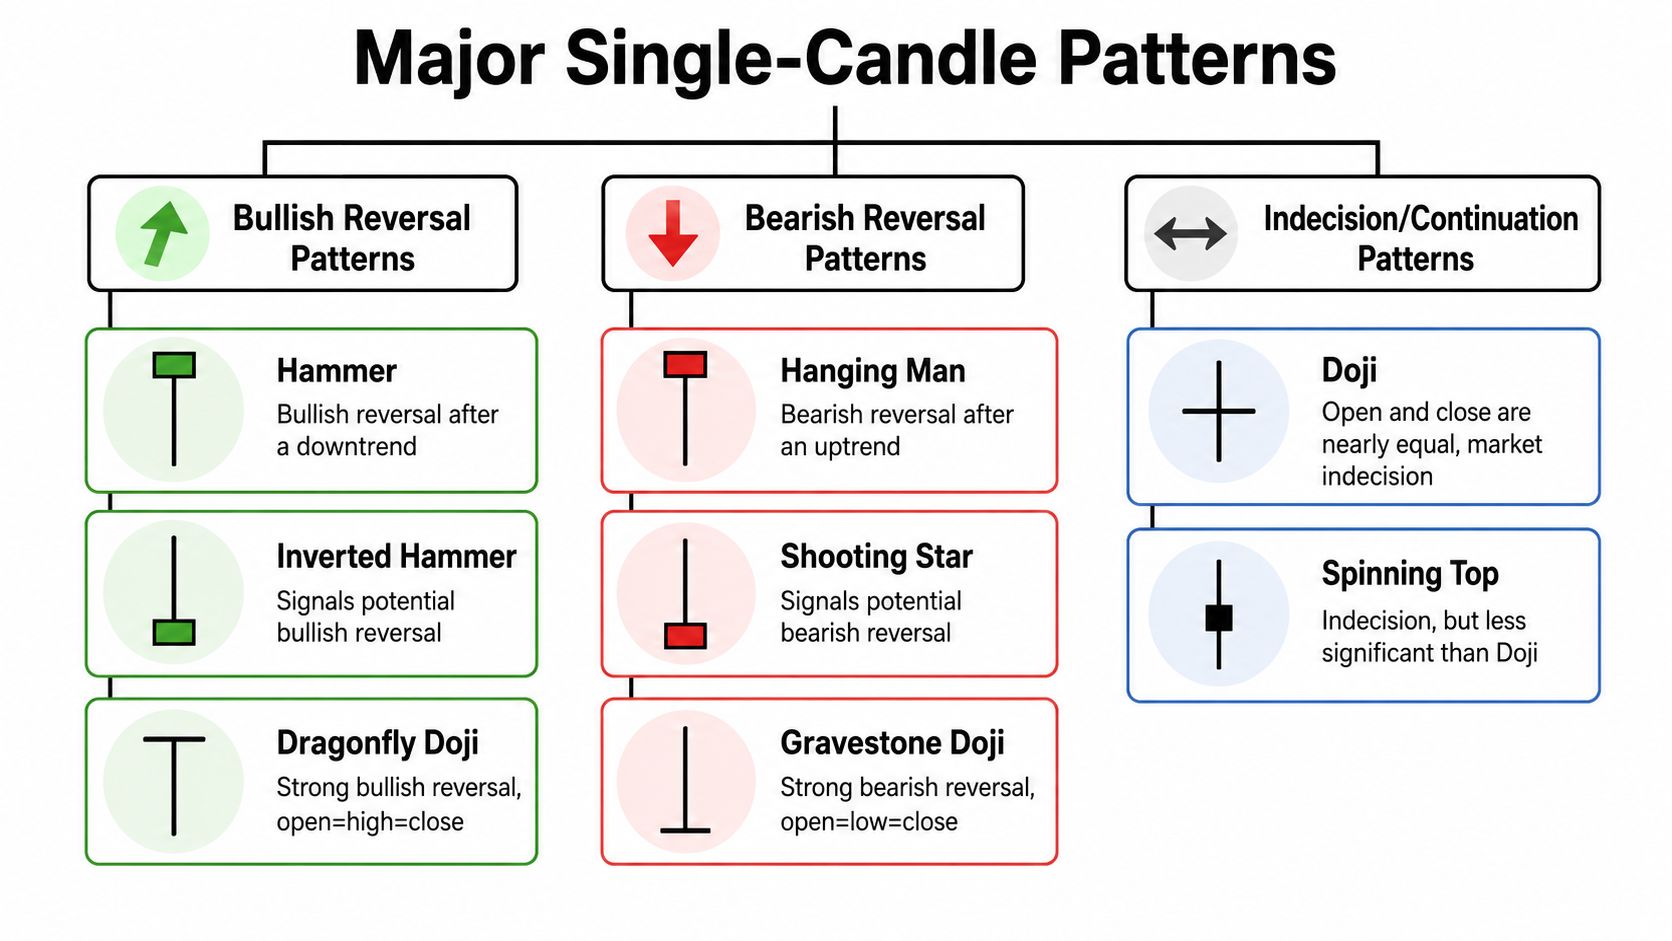
Doji and spinning indecision
A Doji forms when the open and close finish near the same level. Price moved, tested, and failed to produce a clear winner by the close. That can matter after an extended move into support, resistance, a session high, or a prior day's extreme. In the middle of dead space, it usually means the market is killing time.
The practical read is simple. A Doji warns that momentum may be stalling. It does not give permission to jump in early.
Use it like this:
- After a strong push higher, it can show buyers are no longer closing with authority.
- After heavy selling, it can show lower prices are being rejected or absorbed.
- Inside chop, it often has no edge at all.
For a tighter explanation of the setup, see this guide on what a Doji candle is.
Hammer and hanging man
The Hammer and Hanging Man share the same shape. The market context decides which one you are looking at.
A hammer forms after selling pressure. It has a small body near the top of the range and a long lower wick. Sellers pushed price down and failed to keep it there. Buyers regained ground before the close. That does not guarantee a reversal, but it does show rejection where a selloff should have continued cleanly.
A hanging man forms after an advance. Same structure, different message. If sellers can force a sharp intraperiod drop near the top of a move, upside control is weaker than it looked a candle earlier.
I treat both patterns as tests of location. At a well-defined level, they can justify a planned trade with a tight stop. In the middle of a broad range, they are chart decoration.
A clean hammer near support can justify risk. The same candle in the center of a noisy range does not deserve capital.
Marubozu and one-sided control
A Marubozu shows decisive control from one side. The body is large and the wicks are small or absent. That tells you price did not spend much time rejecting the move. Buyers stayed in control for a bullish Marubozu. Sellers stayed in control for a bearish one.
Newer traders often get trapped. A strong Marubozu looks obvious, so they chase it late and place the stop too wide for the account. On a prop evaluation, that is a fast way to burn risk on a candle that already did most of its move.
A better approach is to judge what happens after the candle closes.
| Pattern | What it suggests | What to watch next |
|---|---|---|
| Bullish Marubozu | Buyers controlled the session decisively | Price holds above the candle midpoint or low, then continues |
| Bearish Marubozu | Sellers dominated the session | The next candle accepts lower prices instead of snapping back |
| Doji | Indecision or a pause in control | Wait for a break and close beyond nearby structure |
| Hammer | Rejection of lower prices | Best used near support or after a stretched selloff |
The label matters less than the risk it creates. Long-wick candles often allow tighter invalidation. Large Marubozu candles often require wider stops or a pullback entry. That choice matters more in funded trading than in theory, because the right pattern with the wrong size can still violate your drawdown limits.
Identifying Powerful Dual and Multi-Candle Formations
Single candles are quick signals. Two- and three-candle formations tell a more complete story because you can see one side lose control and the other side step in.
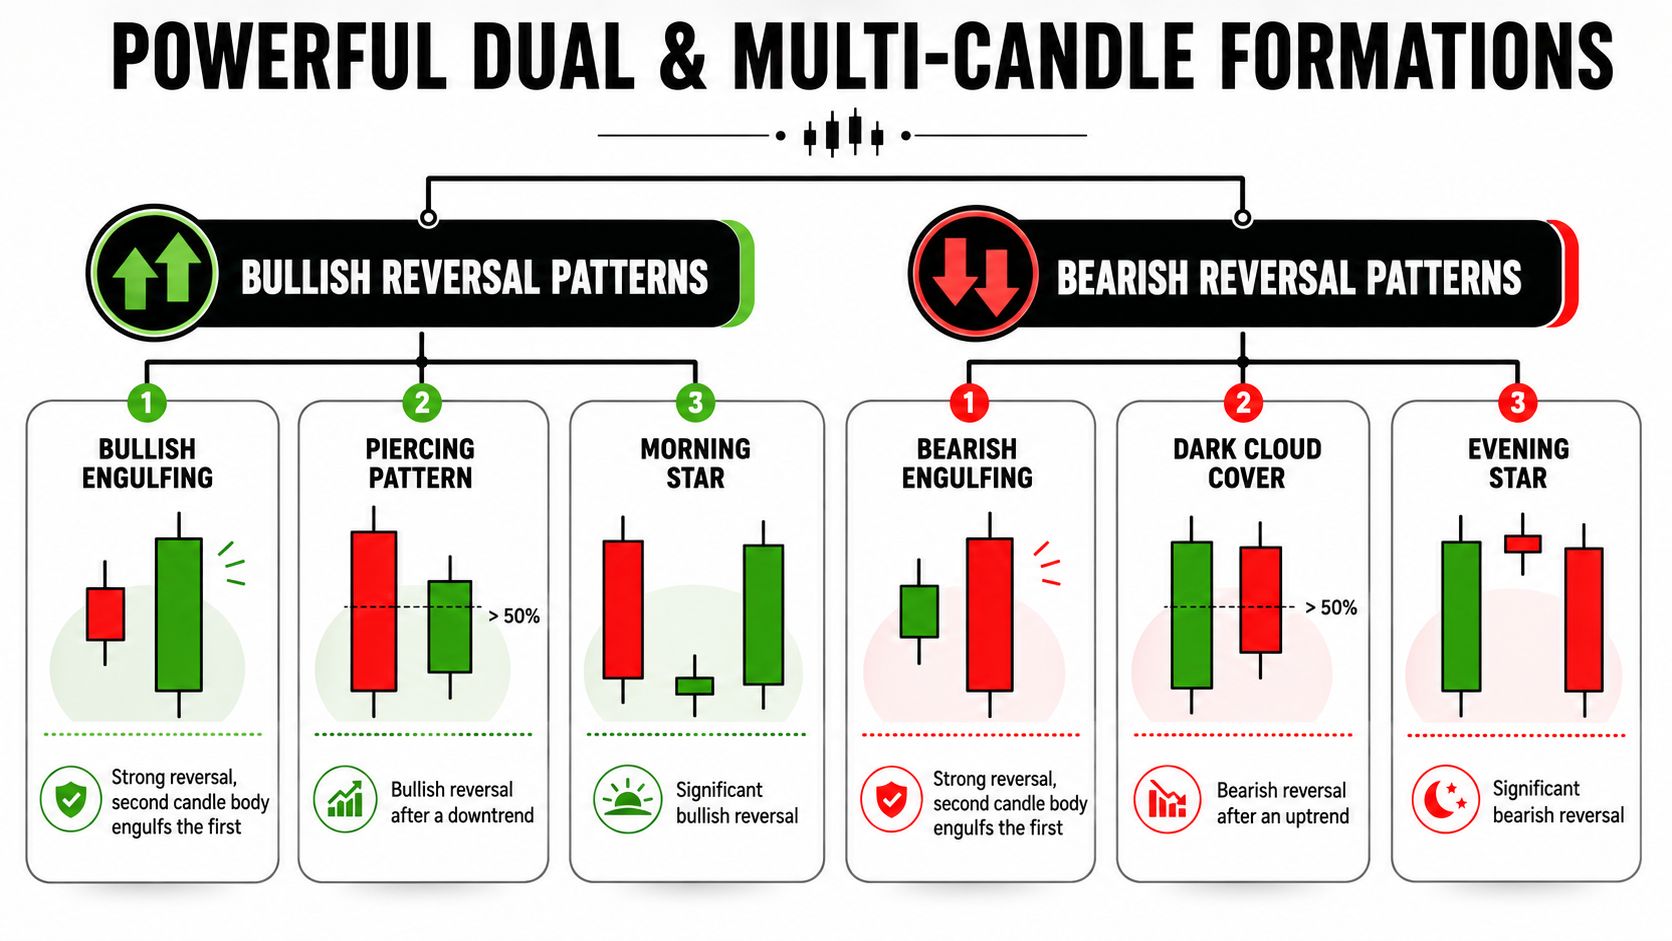
Engulfing patterns and sudden control shifts
A bullish engulfing pattern usually appears after weakness. The first candle closes bearish. The second candle reverses that tone and its body overtakes the previous candle's body. In plain terms, sellers had control, then buyers stepped in hard enough to overwhelm that pressure.
A bearish engulfing pattern is the same logic in reverse. Buyers were in charge, then sellers took back control with force.
What matters most:
- Where it forms matters more than how pretty it looks.
- How stretched price was before it appeared changes the quality of the signal.
- What the next candle does tells you whether the reversal was real or just a brief squeeze.
Harami and slowing momentum
A Harami is a smaller second candle that sits inside the prior candle's body. It doesn't show force the way an engulfing pattern does. It shows contraction.
That's why Harami patterns often work better as caution signals than aggressive entry signals. They can tell you momentum is slowing, but they don't tell you who wins next unless price confirms the change.
Morning star and evening star
Three-candle patterns usually give a clearer narrative.
A Morning Star often appears after a decline:
- A strong bearish candle shows active selling.
- A smaller middle candle shows hesitation or loss of momentum.
- A strong bullish candle shows buyers taking control.
An Evening Star flips that sequence after an advance.
These patterns became standardized across technical analysis as candlestick methods evolved from chart-reading lore into a formal framework for stocks, indices, commodities, and FX, including common single-, double-, and triple-candle formations such as Doji, engulfing, and Morning Star, as discussed in this statistical study of Japanese candlesticks.
The best multi-candle patterns don't just “appear.” They develop where one auction is ending and another is starting.
A practical reading method
When you see a dual or multi-candle setup, read it in sequence:
- First candle sets the prior control.
- Second candle shows whether that control weakened, stalled, or got reversed.
- Third candle often provides the first clean evidence of follow-through.
That sequence keeps you from treating every engulfing bar as a reversal and every star pattern as a guaranteed turning point. Most false signals happen because traders memorize shapes and ignore the conversation between candles.
Candlestick Patterns on Real FX and Crypto Charts
Charts in textbooks are clean. Live charts aren't. You'll get overlap, news spikes, fake breaks, and candles that look strong until the next bar erases them.
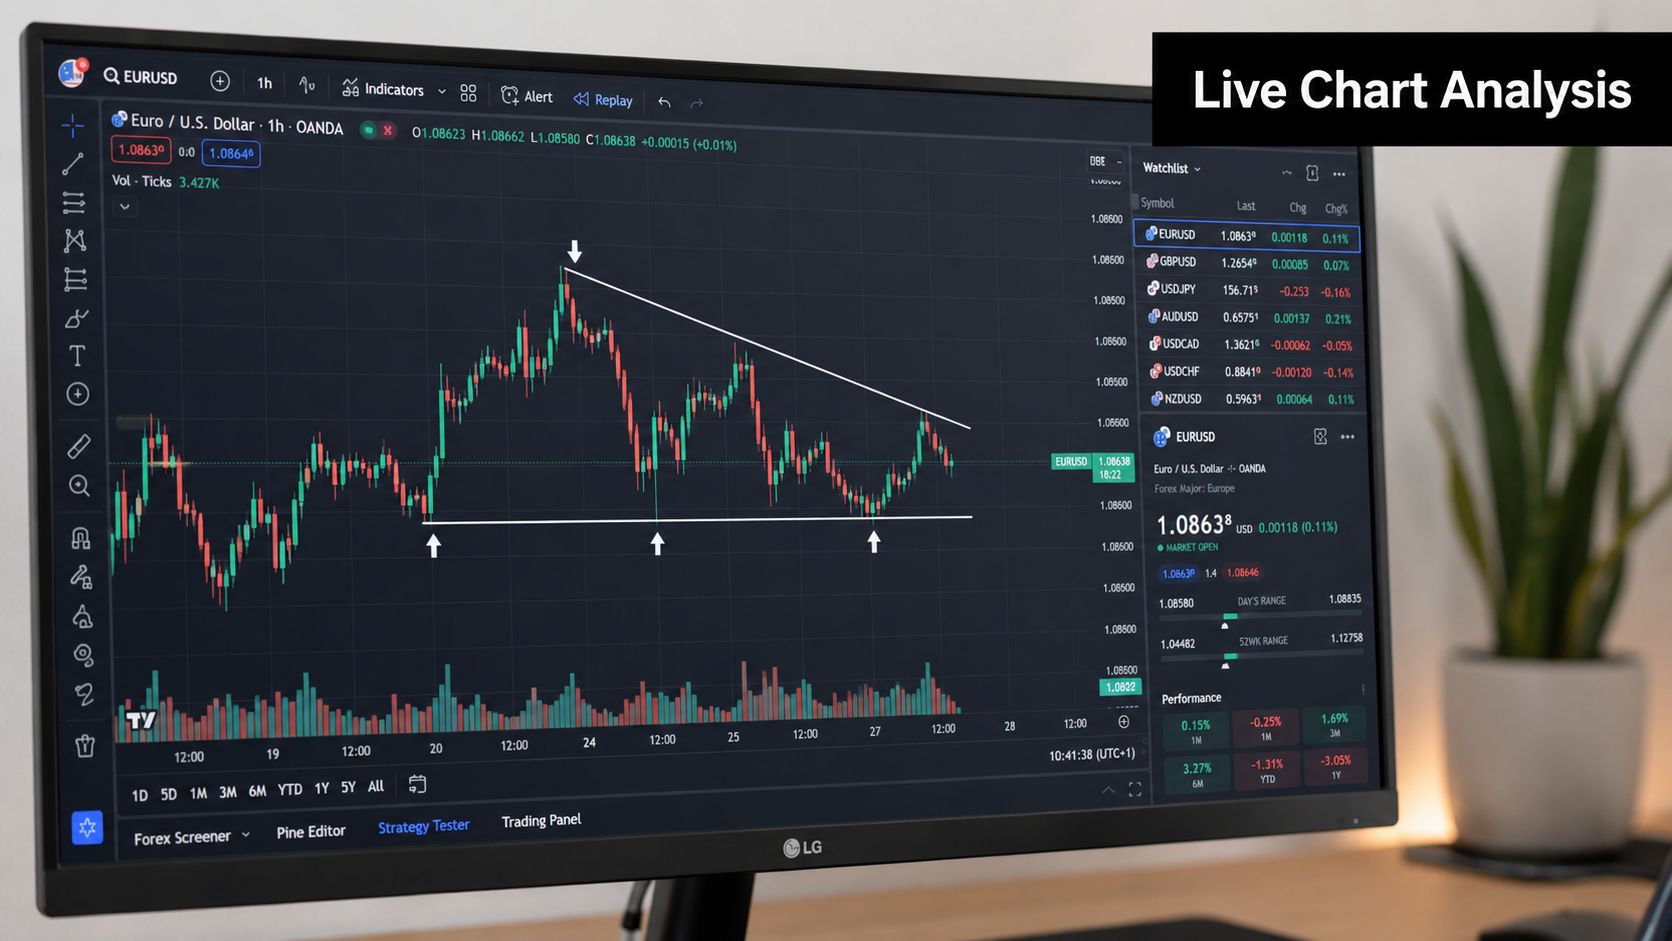
EUR/USD near prior support
A common FX setup looks like this. EUR/USD sells off into an obvious prior low on the intraday chart. At that level, you get a hammer or bullish engulfing candle. New traders often buy the close immediately.
A better read is slower.
Ask:
- Did the pattern form exactly at a level other traders are likely watching?
- Did the next candle hold above the signal candle's low?
- Did price start accepting above nearby short-term structure?
If the answer is no, it's just a shape. If the answer is yes, you may have the start of a tradable rotation.
XAU/USD after an extended push
Gold often prints dramatic wicks because volatility expands fast. A shooting star into a resistance zone can look perfect and still fail if broader momentum stays aggressive.
Traders get trapped here. They short the candle because the wick looks extreme. Then the next candle trades right back through the high.
The better use of the pattern is as an alert. If price rejects the high, then fails to reclaim it on the next candle, the setup becomes much more credible.
BTC/USD in fast conditions
Bitcoin and other crypto markets can print strong candlestick signals, but they also punish traders who ignore environment. A bearish engulfing pattern after a vertical run can lead to a clean pullback. It can also become a one-candle pause before continuation.
Here's the practical difference:
| Market context | Better interpretation |
|---|---|
| Strong trend with shallow pullbacks | Reversal patterns often become pause candles |
| Key level after extended move | Reversal patterns carry more weight |
| Low-liquidity chop | Many candles are unreliable |
| Clean break and retest | Candlestick confirmation becomes more useful |
Real chart work isn't about proving patterns “work.” It's about deciding when the story behind the candle lines up with structure, momentum, and risk.
A Practical Framework for Trading Candlestick Signals
Patterns alone aren't a strategy. If you trade japanese candlestick patterns without a framework, you'll overtrade, force entries, and confuse visual familiarity with edge.
A workable setup has three parts.
Pattern, location, confirmation
Educational trading guidance consistently warns that candlestick patterns don't have absolute edge in isolation. Their usefulness depends on context, especially trend and support or resistance, and confirmation matters before treating a signal as actionable, as noted in IG's Japanese candlestick trading guide.
That translates into a clean checklist:
Pattern
You need a clear signal. Hammer, engulfing, morning star, Doji rejection. If you have to squint at it, skip it.Location
The pattern should appear somewhere meaningful. Prior swing high or low, support, resistance, trendline interaction, range edge, or a pullback area in trend.Confirmation
At this point, most traders get impatient. The next candle, or the next small sequence, should prove acceptance or rejection.
A checklist you can actually use
Before taking the trade, run through this:
- Is the market trending or ranging
- Did the pattern form at a level I marked before the candle printed
- Does the setup align with the higher-timeframe bias
- Has the next candle confirmed the idea
- Can I place a stop where the trade idea is clearly invalidated
- Is the target logical based on structure, not hope
- Does the trade fit my daily risk limit
If any of those answers are weak, the trade is probably weak.
Execution note: The candle gets your attention. Confirmation earns your order.
Entry, stop, and target logic
A practical way to structure the trade:
| Component | Practical approach |
|---|---|
| Entry | After the confirmation candle closes, or on a controlled retest if your plan allows it |
| Stop-loss | Beyond the point that invalidates the pattern, often beyond the wick extreme or structure level |
| Target | Next area of structure, opposing liquidity zone, or a preplanned reward objective |
| Trade management | Reduce exposure only if your rules say so. Don't manage emotionally |
A few habits separate disciplined traders from reactive ones:
- Wait for the close: Intrabar patterns often look great and finish badly.
- Respect invalidation: If the wick low or high is the reason for your stop, don't widen it because you “still believe.”
- Pass on mid-range setups: Candles have more value at edges than in the middle of noise.
Losses will still happen. The point isn't to avoid losses. The point is to take losses that make sense and avoid the ones created by impatience.
Trading Candlesticks within Prop Firm Risk Rules
At this juncture, most pattern traders either mature fast or wash out. Under prop-style rules, you can't afford to treat every nice-looking candle as a trading opportunity.
The good news is that strict limits can improve your process if you use them properly.
Risk rules force better selection
A valid candlestick setup still fails sometimes. That's normal. What destroys traders isn't one failed hammer or one bad engulfing signal. It's stacking weak trades, forcing entries without confirmation, and putting too much risk on a setup that didn't deserve it.
Execution-focused traders need follow-through. A candle becomes tradable when price confirms acceptance or rejection after the signal bar, especially near prior swing highs or lows, which is the key point made in TraderMade's guide to Japanese candlestick patterns.
That's even more important when daily loss and drawdown rules are in play.
How to adapt your candlestick trades
Treat your account limits as guardrails.
Risk small enough to survive normal variance
If one stopped-out trade ruins your day, your size is too large.Use the candle to define invalidation, not to justify oversized trades
A wide wick means a wider stop. A wider stop often means smaller size. That's part of the trade, not a flaw in the setup.Prefer clean locations over frequent signals
One confirmed pattern at a major level is worth more than several random intraday candles in chop.Know when to stand down
After a loss or two, your judgment usually gets worse, not better.
For traders trying to build a stable process, these risk management best practices are worth reviewing alongside any pattern work.
If your pattern requires perfect execution and zero adverse movement to survive, it's too fragile for a risk-limited environment.
Timeframe choice matters
Candlestick traders often drop to very low timeframes because they want more signals. That can backfire under prop rules.
Lower timeframes usually bring:
- More noise
- More false breaks
- More spread sensitivity
- More temptation to revenge trade
Higher intraday timeframes often give clearer structure and cleaner invalidation points. You don't need to trade every session. You need setups that fit your risk budget and your mental bandwidth.
A prop-style decision filter
Before entering any candlestick trade, ask yourself:
| Question | If the answer is no |
|---|---|
| Is the pattern at a meaningful level | Pass |
| Did price confirm after the signal bar | Wait or pass |
| Can I place a logical stop without forcing size | Reduce size or skip |
| Does this trade fit my remaining daily risk | Skip |
| Would I still take this trade if I were already down on the day | If not, it's probably emotional |
That filter is boring. Boring is good. Boring keeps you in the game.
Frequently Asked Questions
Modern traders usually ask the right questions about japanese candlestick patterns. The issue isn't whether the names are useful. The issue is when the patterns carry decision-making value in current market conditions.
Practitioner guidance still supports their relevance, but only when they're tied to momentum, trend context, confirmation, and underlying market structure, which is the core message in this price action guide on candlesticks.
Common questions traders ask
| Question | Answer |
|---|---|
| Do Japanese candlestick patterns still work in modern markets | They can still be useful, but not as standalone signals. They matter more when they appear at important locations and get confirmation. |
| Which candlestick pattern is the most reliable | There isn't a universal winner. A hammer at key support with follow-through can be useful. A perfect hammer in random chop often isn't. |
| Do candlestick patterns work on all timeframes | Yes, but the meaning changes with context. Lower timeframes can produce more noise, while higher timeframes often give clearer structure. |
| Should I combine candlestick patterns with indicators | Yes. Trend, momentum, support and resistance, and market structure all help you judge whether the candle has real significance. |
Short answers that matter
- Don't memorize patterns in isolation. Learn where they matter.
- Don't treat one candle as proof. Let the next candle confirm or reject it.
- Don't force reversals against strong momentum. Many reversal candles fail in aggressive trends.
- Don't ignore risk. Even strong-looking setups lose.
The best traders don't collect pattern names. They build a repeatable decision process around price behavior.
If you want to apply candlestick trading inside a realistic prop environment, explore MyFundedCapital. You can compare funding programs, review account types, and choose a path that fits your trading style, whether that's an evaluation or instant funding model. Trading involves risk of loss, and funded trading is best approached with a rules-based plan, not hype.