If you're staring at a chart with moving averages, oscillators, signals, and color-coded overlays, you're not alone. Most newer traders add tools to feel more certain, then freeze when those tools disagree. Price action trading strips that clutter away and brings you back to the only thing every indicator is built from: price itself.
A clean chart won't make trading easy, but it will make your decisions clearer. That is the value. You learn to read structure, levels, candles, and momentum directly, then manage risk with rules that fit a professional environment instead of chasing perfect signals.
Introduction The Cluttered Chart Problem
A lot of traders reach the same point. They start with a clean chart, add RSI, MACD, moving averages, VWAP, maybe Bollinger Bands, then end up with five reasons to buy and five reasons to stay out.
That confusion gets worse inside a prop-style evaluation. You don't just need a decent setup. You need a setup that makes sense, has a defined invalidation point, and doesn't tempt you into forcing trades because you're staring at a screen all day.
Price action is the reset.
It removes the filter and puts the chart back in plain view. Instead of asking what an indicator says about price, you ask what price is doing right now. Is it making higher highs and higher lows. Is it rejecting a level. Is it compressing into a tight range. Is a breakout holding, or failing immediately.
Clean charts don't remove uncertainty. They remove excuses.
That's why experienced discretionary traders keep returning to price action. It isn't flashy, and it isn't a shortcut. It's a practical framework for reading the market's behavior, planning entries and exits, and keeping risk tied to structure instead of emotion.
Decoding the Language of the Market
What is price action trading? It's a form of technical analysis that focuses on price movements over time rather than relying on indicators. Many traders study recent price history, often the last 3 to 6 months, to mark swing highs, swing lows, support, resistance, and repeating chart behavior, as explained in PriceAction.com's overview of price action trading.
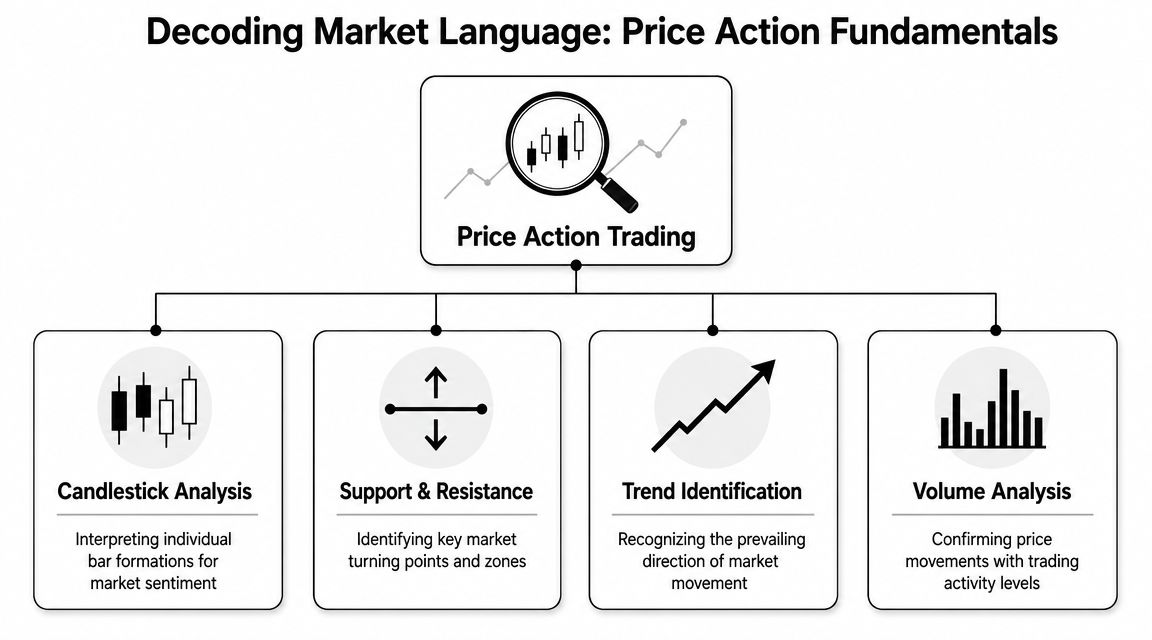
A good way to think about it is this. Price action is the market's language. If you can read the grammar, you stop reacting late and start understanding context.
Market structure comes first
Start with swing highs and swing lows. This is the backbone.
If price keeps printing higher highs and higher lows, buyers are still in control. If it keeps producing lower highs and lower lows, sellers are in control. If those sequences break down and price starts chopping sideways, the market isn't trending cleanly anymore.
On a working chart, I usually mark structure before anything else:
- Recent swing points that clearly changed direction
- Obvious turning zones where price reacted more than once
- Untested extremes that may attract another reaction
- Current directional bias based on whether structure is still intact
Most bad trades start when a trader ignores structure and takes a pattern in the wrong place.
Support and resistance are decision zones
Support and resistance aren't magic lines. They're areas where the market has already shown a decision.
Sometimes price bounces there. Sometimes it breaks through and accepts beyond it. The point isn't to predict every reaction. The point is to know where reaction is more likely and where your trade idea can be proven wrong quickly.
That matters more than people think. A pin bar in the middle of nowhere is just a candle. A rejection candle at a well-defined level is information.
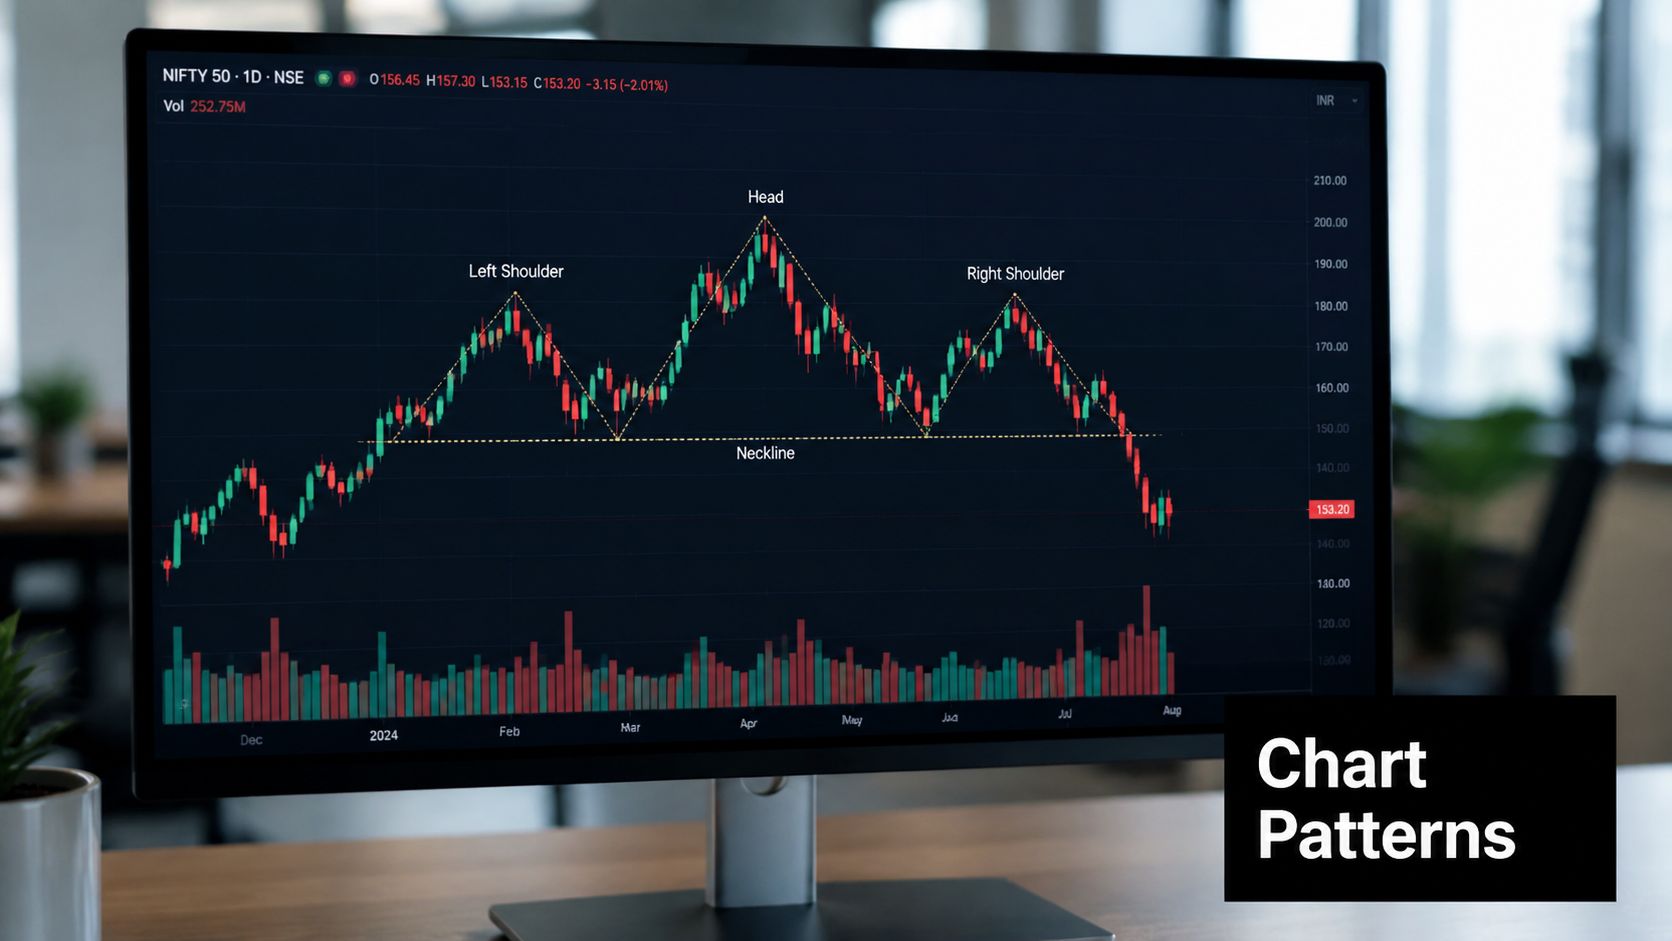
If you're still learning how repeated formations show up around those zones, studying forex chart patterns in this guide helps connect the shape on the chart to the story behind it.
Candlesticks show short-term psychology
Candles matter because they compress a tug-of-war into something readable.
A long rejection wick can show failed continuation. A strong close near the high can show acceptance and pressure from buyers. A small candle inside a large one can show pause, compression, or indecision before expansion.
Don't overcomplicate candlestick analysis. Focus on three questions:
- Where did the candle form
- How did it close
- What does that imply about the next likely response
A candle pattern without context is noise. The same pattern at a key level can become a trade.
Order flow sits underneath all of it
You don't need a full depth-of-market screen to understand the basic idea. Every move on the chart comes from transactions between buyers and sellers. Price action is the visible result of that process.
That's why breakouts, pullbacks, reversals, and failed moves matter. They're footprints of participation and imbalance, even if you're reading them from a simple candlestick chart.
Common Price Action Setups and Patterns
The best setups aren't memorable because of their names. They're useful because they tell a clear story. Rejection, pause, continuation, failure. That's what you're really trading.
One reason traders keep using these setups is that they can be tested instead of treated like folklore. An independent review of more than 1,300 trading setups across Forex, Gold, and Indexes found that classic price action patterns had win rates above 50%, according to this price action pattern analysis on YouTube.
That doesn't mean every setup is good. It means context and selection matter.
Pin bar
A pin bar is a rejection story. Price pushes into an area, gets rejected, and closes back off the extreme.
The pattern gets stronger when it forms:
- At a clean support or resistance zone
- After an extended move
- In line with broader structure
- With obvious rejection rather than a tiny wick
A bearish pin bar at resistance says buyers pushed higher and couldn't hold it. A bullish pin bar at support says sellers drove lower and got absorbed.
The mistake is taking every pin bar you see. In random chop, pin bars are everywhere.
Inside bar
An inside bar shows compression. The market pauses inside the range of the prior candle.
That can mean indecision, but in the right location it often means the market is storing energy before the next move. Traders watch these around breakout zones, trend pullbacks, and major session transitions.
A practical way to read it:
| Pattern context | What it often suggests |
|---|---|
| In a trend pullback | Pause before continuation |
| At major resistance or support | Compression before a break or rejection |
| In a messy range | Usually noise |
Inside bars work best when the surrounding structure is already clear.
Engulfing pattern
An engulfing candle is a momentum shift. One side takes over enough to cover the prior candle's range.
This pattern matters less because it looks dramatic and more because it shows urgency. If sellers fully absorb the previous bullish candle at resistance, that says something. If buyers do the same at support after a washout, that says something too.
Breakout and failed breakout
A breakout is not just a move through a line. It has to hold.
The better question is never "did price break." It's "did price accept beyond the level, or did it snap back." Failed breakouts are often more informative than successful ones because they expose trapped traders.
When a breakout can't hold, don't argue with it. The failure is the signal.
For beginners, this is enough. Learn a few repeatable patterns. Tie them to structure. Ignore the urge to memorize dozens of names.
Price Action Versus Indicator-Based Trading
This isn't a fight between "smart traders" and "wrong traders." Both approaches can work. The key issue is understanding what each one gives you, and what it costs you.
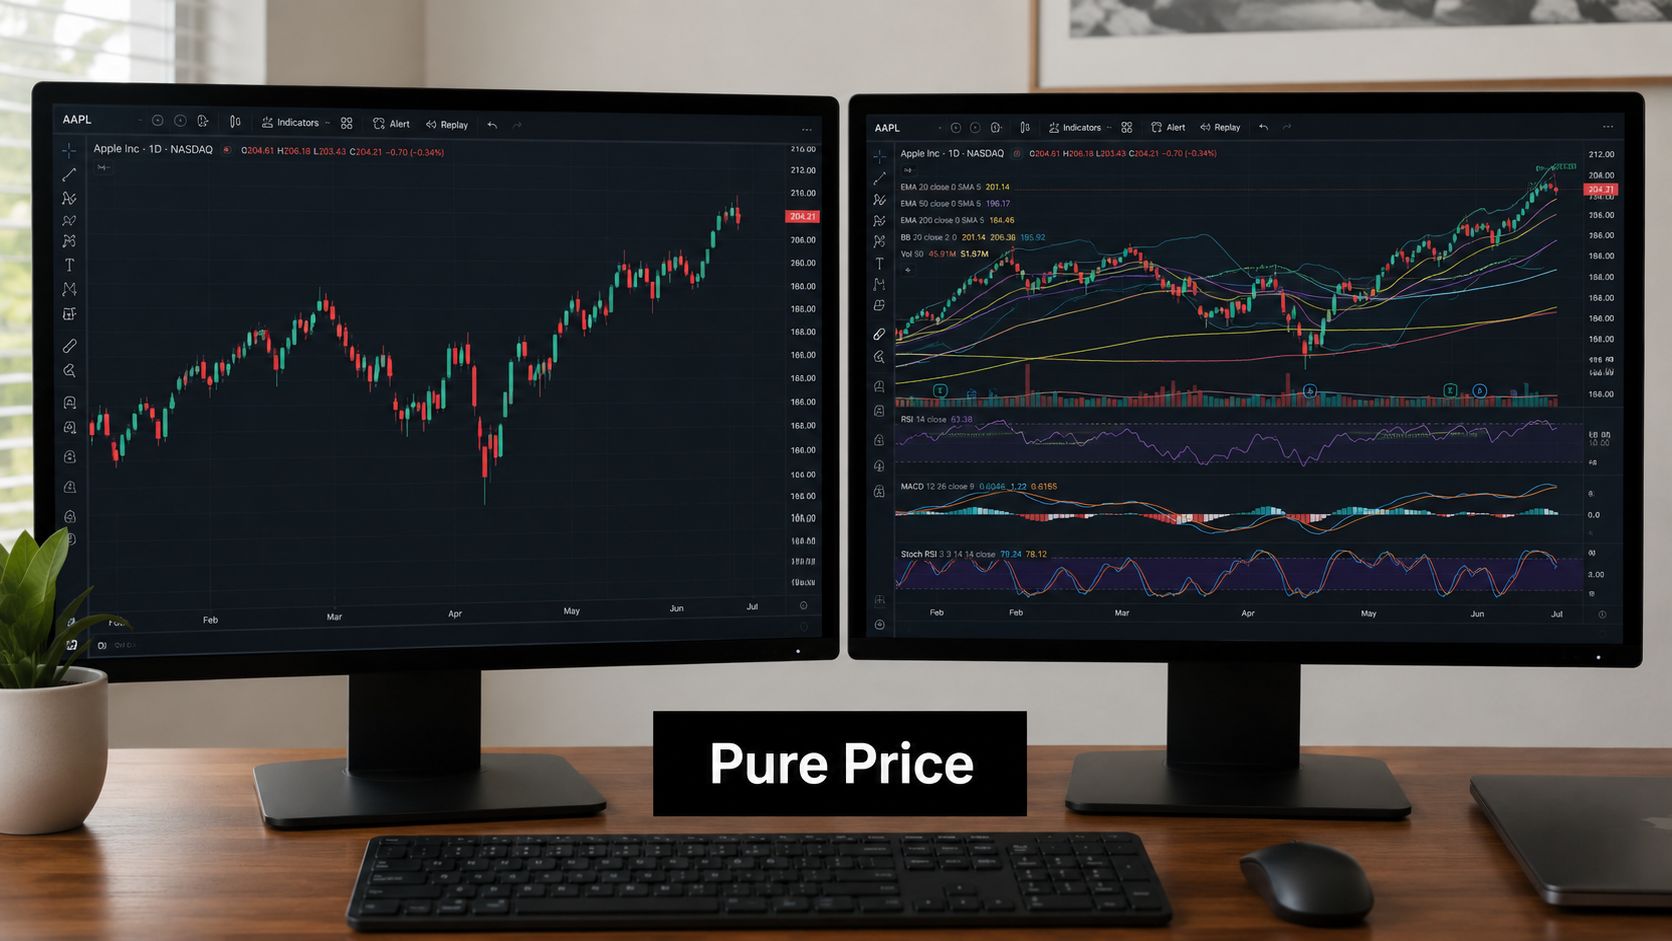
Indicators are derived from price. Price action is the raw feed.
That difference changes how you think, how you execute, and how quickly you recognize that your idea is wrong.
Side-by-side trade-offs
| Approach | Strength | Limitation |
|---|---|---|
| Price action trading | Clear chart, direct read on structure and behavior | More discretionary, takes screen time |
| Indicator-based trading | More objective rules, easier to standardize | Signals can lag and conflict |
| Hybrid approach | Can combine context with confirmation | Easy to overbuild and overfit |
Price action tends to suit traders who want to understand why a market is moving. Indicator systems tend to suit traders who prefer predefined rules and simpler execution logic.
Neither fixes poor discipline.
Execution is often cleaner with price action
Classical price action execution is simple. Traders often use a buy stop 1 tick above a signal bar high or a sell stop 1 tick below a signal bar low, with the protective stop 1 tick beyond the opposite side of that signal bar, as described in Wikipedia's summary of price action trading mechanics.
That structure gives you a clean invalidation point. You're not entering because a line crossed another line. You're entering because price confirmed a bar pattern, and you're exiting if that pattern fails.
Indicators still have value. A trader might use session tools, volatility tools, or something like VWAP in this guide to Volume Weighted Average Price as a reference point. But the strongest use of indicators is usually supportive, not dominant.
If an indicator helps you organize price, fine. If it replaces reading price, that's where problems start.
Practical Application and Risk Management
Spotting a setup is the easy part. Building a trade around it is where most traders either become consistent or stay stuck.

A practical edge in price action comes from structure-based regime detection. When higher highs and higher lows stay intact, traders treat the market as trending. When that structure disappears, they treat it as a range or consolidation, as outlined in TradeThatSwing's explanation of market structure and range conditions.
That single filter cuts out a lot of bad trades.
Start with regime before pattern
Many traders reverse the process. They find a candle pattern first, then try to justify it.
Do the opposite.
Ask:
- Is the market trending cleanly
- Is it ranging
- Is the range wide enough to trade
- Is this chart moving with clean waves or random chop
If the structure is messy, a textbook pattern won't save it. In weak conditions, the market can stop out both sides before it goes anywhere.
Build a trade around invalidation
Every price action trade needs one sentence behind it.
Examples:
- Trend continuation idea because price pulled back into support and held structure
- Reversal idea because price rejected resistance and failed to continue higher
- Breakout idea because price closed through a level and held above it
Then define what invalidates that sentence. Usually that's behind a swing high, swing low, or signal bar extreme.
A practical checklist looks like this:
- Bias first. Decide whether you're trading with trend, against trend, or fading a range edge.
- Location second. Mark where price is relative to the nearest important zone.
- Trigger third. Wait for a candle or breakout behavior that confirms the idea.
- Stop placement. Put the stop where the setup is objectively wrong, not where the loss feels smaller.
- Target planning. Aim for the next logical reaction area, not a fantasy move.
Use multiple timeframes without overthinking it
Higher timeframe structure gives context. Lower timeframe price action gives execution.
A common mistake is drilling so deep into lower timeframes that every candle feels urgent. The lower you go, the more noise you accept. For many newer traders, cleaner reads come from starting with a higher chart for structure, then refining entry on a lower one.
Protect capital like a professional
Prop-firm logic and trader logic should match. If your stop is too wide for the setup, pass on the trade. If the nearest target is too close to justify the risk, pass on the trade. If the market is chopping around a level and offering no clear invalidation, pass on the trade.
Passing is a position.
Good risk management starts before entry. It starts when you decide a chart isn't worth your capital.
Price Action Trading Within Prop Firm Rules
A trader passes on a breakout, chases the second candle, then spends the rest of the session trying to repair the mistake. In a prop evaluation, that single lapse can do more damage than three good reads can fix.
That is why pure price action fits the prop model so well. The rules are tight, the margin for error is small, and every trade has to earn its place. A clean chart helps because it forces a hard question before entry: where is the setup wrong? If that answer is vague, the trade usually does not belong in a challenge account.
The prop environment changes how a trader should use price action. The pattern still matters, but rule pressure matters too. A failed breakout that looks tradable on a personal account may be a poor choice if the stop needs too much room, the session is already volatile, or one more loss would put the day at risk. Good challenge traders read the chart and the rulebook at the same time.
Why price action works under funded-account pressure
Indicator-heavy trading often creates a delay between what price is doing and what the trader believes is happening. In a prop challenge, that delay is expensive. Price action keeps attention on structure, momentum, and reaction at levels that other traders can see.
That matters most in three situations:
- After a loss, when revenge trading starts to look like conviction
- Near daily drawdown limits, when one loose stop can end the session
- During chop, when weak setups pile up and fees, slippage, and poor decisions start to add up
Price action gives a simple filter. If price is trapped in the middle of a range, leave it alone. If a breakout has no acceptance beyond the level, treat it with caution. If a rejection candle forms at a meaningful area but the invalidation is too far away for the account rules, pass and wait.
Passing keeps traders in the game.
What disciplined prop traders do differently
The traders who perform well in evaluations usually simplify their decision process. They are not trying to catch every move. They are trying to avoid the mistake that breaks the account.
A practical approach looks like this:
- Trade around obvious structure, not in the middle of random movement
- Size the position from the stop distance, so the chart defines the risk
- Cut the idea when structure breaks, instead of negotiating with the market
- Reduce activity after one or two poor decisions, because discipline often slips before the account does
Journaling and review are essential. Traders who want a repeatable process under firm rules usually need more than screenshots and memory. A simple framework for backtesting one setup and tracking execution quality helps separate a bad read from bad discipline.
Price action does not make prop trading easy. It does make mistakes easier to spot early, which is what keeps a challenge alive.
Backtesting and Journaling Your Way to Consistency
Most traders ask whether price action works. A better question is which setups work for you, in which market, under which conditions.
That answer doesn't come from social media clips. It comes from testing and review. The reliability of any pattern likely depends on context, timeframe, and execution discipline, and backtesting is one of the best ways to examine that with market-specific evidence, as discussed in this video on context, slippage, and regime change in price action.
A simple process is enough:
- Backtest one setup only such as a pin bar at a major level
- Record the context including trend, range, and session conditions
- Save a chart screenshot before and after the trade
- Track execution errors separately from setup quality
If you need a starting framework, this guide on what backtesting is and how traders use it gives a practical base.
Journaling matters just as much. Your journal should show whether you're following your method or just reacting to chart movement. That's how discretionary trading becomes more professional and less emotional.
Frequently Asked Questions and Getting Funded
Can beginners learn price action trading
Yes. In many cases, it's the better place to start because you learn how markets move instead of memorizing indicator settings. The trade-off is that it takes chart time and deliberate practice.
What is the best timeframe for price action trading
Price action principles apply across timeframes. Many newer traders find higher timeframes easier to read because the moves are slower and the structure is clearer.
Can price action be used with algorithms
Yes, but you have to define the setup in rules that code can recognize. Some patterns are easier to automate than others because discretionary context is hard to translate.
Is price action trading enough on its own
It can be, if your execution and risk management are solid. Most traders don't fail because the chart method is missing. They fail because they trade poor conditions, size badly, or ignore invalidation.
Trading involves substantial risk of loss. This article is educational only and isn't financial advice.
If you're ready to apply price action in a more structured environment, explore MyFundedCapital to compare funding programs, account types, and challenge paths that fit disciplined traders.