A Doji candle on a chart often signals market indecision, a potential turning point where a trend could reverse or pause. Understanding this candlestick pattern is crucial for reading price action, but trading it requires more than just spotting its cross-like shape. In this guide, you'll learn the different types of Doji, how to interpret their psychology, and how to use them in a practical trading plan with concrete steps.
What a Doji Candle Signals to Traders
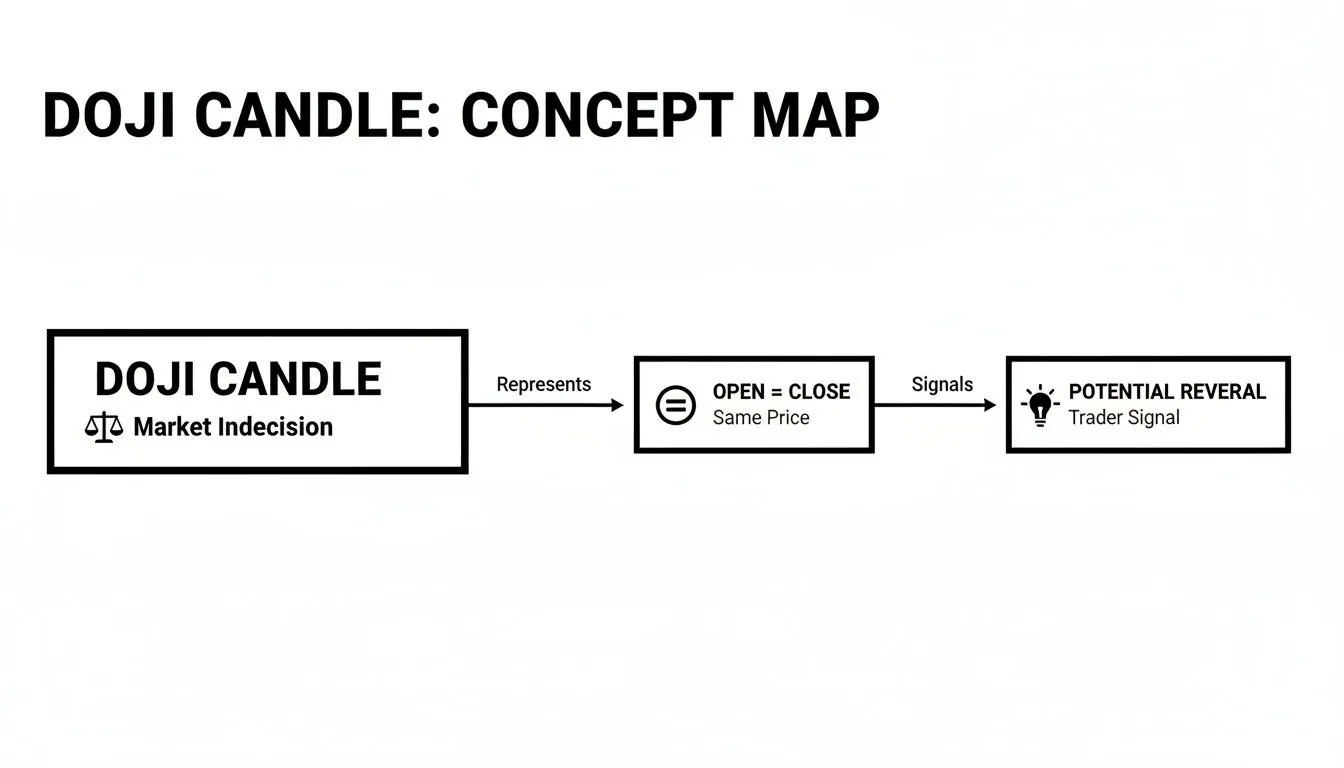
A Doji forms when a session's opening and closing prices are nearly identical, creating a candle with a very small or non-existent body. While the price may have moved significantly up and down, creating long upper and lower wicks, it ended in a stalemate between buyers (bulls) and sellers (bears).
For a trader, this signals that the conviction behind the current trend may be weakening.
- In an uptrend: A Doji suggests buyers are losing momentum and sellers are starting to fight back.
- In a downtrend: A Doji indicates selling pressure is easing as buyers step in to defend a price level.
This signal becomes more significant when it appears at a key technical level, like support or resistance. It highlights that the level is being defended and a reversal could be imminent.
However, a Doji alone is a sign of indecision, not a guaranteed reversal. Trading on this pattern without further evidence is highly risky. Experienced traders use it as a warning to watch for confirmation from subsequent price action. Always remember that trading involves substantial risk, and candlestick patterns are not guarantees of future performance. This content is for educational purposes only and is not financial advice.
The Four Main Types of Doji Candles
While all Doji candles signal indecision, their specific shapes tell different stories about the battle between buyers and sellers. Recognizing these variations helps you understand the underlying market psychology more deeply.
This map breaks down the core idea: a Doji signals a stalemate, a moment of equilibrium that often precedes a significant shift in market direction.
Learning to read these nuances is key to anticipating potential market moves. Let's break down what each type signals.
Standard and Long-Legged Doji
- Standard Doji: Looks like a cross (+). Its wicks are relatively symmetrical and short, indicating a brief, low-volatility pause. Think of it as a moment of quiet indecision.
- Long-Legged Doji: This candle has much longer upper and lower wicks. It signals a period of high volatility where both buyers and sellers made aggressive moves but neither could secure a win. The intense struggle suggests that when a winner finally emerges, the subsequent move could be powerful.
Gravestone Doji
The Gravestone Doji is a bearish reversal pattern, especially potent when it appears at the peak of an uptrend. It looks like an inverted "T" with a long upper wick and almost no lower wick.
Here’s the story it tells:
- Buyers initially pushed the price up significantly (creating the long upper wick).
- Sellers then took complete control, pushing the price all the way back down to the opening level.
This pattern shows a clear rejection of higher prices. The bulls’ attempt failed, signaling that buying pressure has likely been exhausted.
Dragonfly Doji
The Dragonfly Doji is the bullish counterpart to the Gravestone. It’s a bullish reversal pattern that typically appears at the bottom of a downtrend and looks like a "T."
Here’s its story:
- Sellers initially pushed the price down hard (creating the long lower wick).
- Buyers then stepped in with force, absorbing all the selling pressure and driving the price back up to the open.
This pattern shows a strong rejection of lower prices, indicating that sellers may have lost control and a bottom could be forming.
Why You Should Never Trade a Doji in Isolation
Seeing a Doji at a potential top or bottom can be exciting, but acting on it immediately is a common mistake. A Doji is a signal of indecision, not a command to trade. It’s a yellow light, not a green one.
Trading a Doji without confirmation is a 50/50 gamble. To increase your odds, you must wait for the market to show you who won the battle.
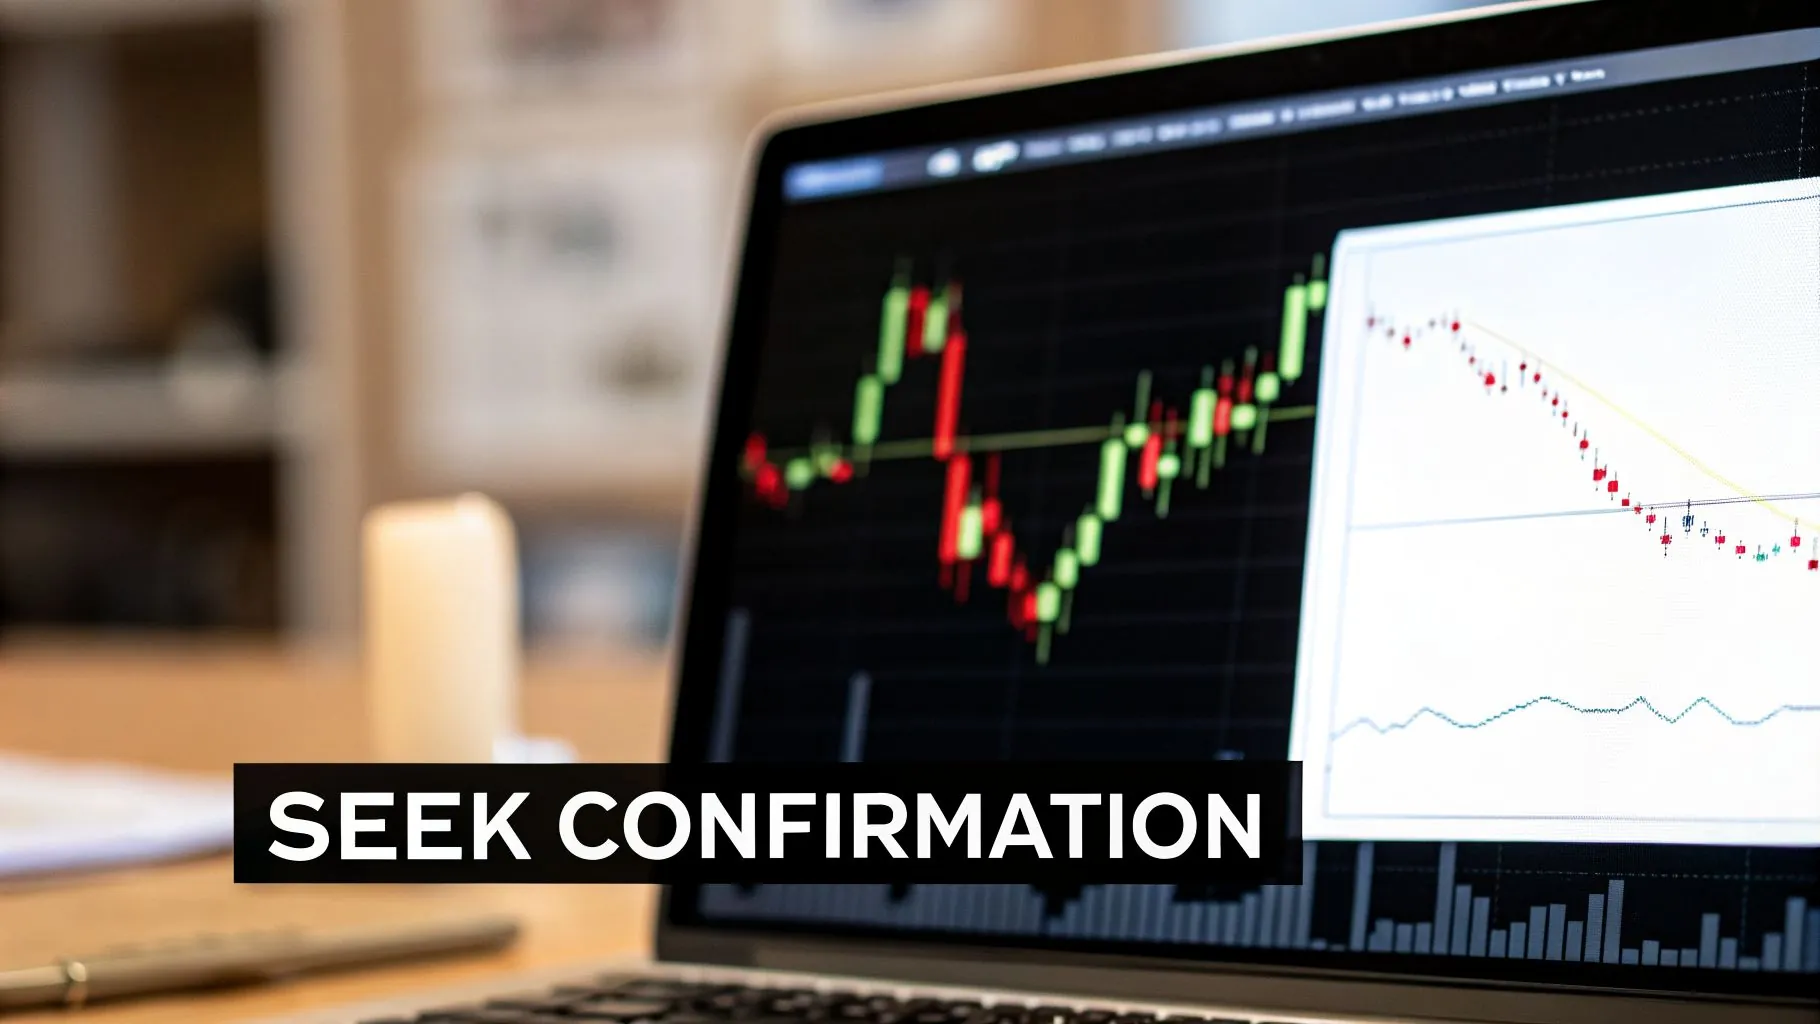
Seeking Confirmation After a Doji
Confirmation comes from the price action after the Doji forms. It validates the potential reversal and gives you a more reliable entry trigger.
Here’s a practical checklist for seeking confirmation:
- For a Bullish Reversal (e.g., Dragonfly Doji):
- Wait: Do not buy immediately.
- Confirm: Wait for the next candle to close as a bullish candle above the high of the Doji. This shows buyers have taken control.
- For a Bearish Reversal (e.g., Gravestone Doji):
- Wait: Do not sell immediately.
- Confirm: Wait for the next candle to close as a bearish candle below the low of the Doji. This shows sellers have won the fight.
Building Confluence for Stronger Signals
The strongest trade setups have confluence—multiple technical signals pointing to the same outcome. Our guide on price action trading digs deeper into this concept.
Combine the Doji with other indicators for a more robust signal:
- Support and Resistance: A Doji at a major support or resistance level is far more significant than one in the middle of a range.
- Trendlines: A Dragonfly Doji whose low touches an ascending trendline provides an extra layer of validation.
- Moving Averages: A Gravestone Doji rejected at the 200-day moving average strengthens the case for a short trade.
- Oscillators (like RSI): A Doji appearing in an uptrend while the RSI is in the "overbought" zone (above 70) adds weight to a potential bearish reversal.
Remember, no strategy is foolproof and trading always involves the risk of loss. Using confluence helps build a higher-probability setup, which is essential for disciplined risk management.
Practical Doji Trading Setups and Examples
Let's translate theory into actionable steps with two concrete examples. These are for educational purposes only to illustrate a process; they are not financial advice and do not guarantee profits.
Bearish Reversal Setup: Gravestone Doji at Resistance
This example is for a short-term day trade on a 15-minute chart.
- Context: The price is in an uptrend and approaches a known resistance level.
- Signal: A Gravestone Doji forms at resistance, showing buyers were rejected.
- Confirmation: The next candle is bearish and closes below the low of the Gravestone Doji.
Trade Plan:
- Entry: Enter a short (sell) position at the close of the confirmation candle.
- Stop-Loss: Place the stop-loss a few pips above the high of the Gravestone Doji. A break above this level invalidates the bearish signal.
- Take-Profit: Set a target based on a risk/reward ratio, for example, 1:2. If the stop-loss is 15 pips, the target would be 30 pips below the entry price.
Bullish Reversal Setup: Dragonfly Doji at Support
This example is for a swing trade on a daily chart.
- Context: The market is in a downtrend and approaches a major support level or an ascending trendline.
- Signal: A Dragonfly Doji forms, with its long lower wick touching the support level.
- Confirmation: The following candle is bullish and closes above the high of the Dragonfly Doji.
Trade Plan:
- Entry: Enter a long (buy) position at the close of the confirmation candle.
- Stop-Loss: Place the stop-loss a few pips below the low of the Dragonfly Doji's wick. A break below this level invalidates the bullish signal.
- Take-Profit: Target the next major resistance level or use a fixed risk/reward ratio like 1:3.
Backtesting can help validate such strategies. A study by Commodity.com found that combining Dojis with Fibonacci levels and RSI confirmation correctly identified market turns with 71% accuracy. While past performance is not indicative of future results, this highlights the power of a disciplined, evidence-based approach—a core principle detailed in our guide on creating a forex strategy based on technical analysis.
FAQ: Common Questions About Doji Candles
What is the difference between a Doji and a Spinning Top?
The key difference is the size of the body. A Doji has virtually no body because the open and close prices are the same. A Spinning Top has a small, but clearly visible, body, indicating a small net price change. Both signal indecision, but a Doji represents a more perfect stalemate.
Which timeframe is best for trading Dojis?
Dojis are more reliable on higher timeframes like the 4-hour, daily, or weekly charts. A Doji on a daily chart represents a full day of indecision, which carries more weight than a Doji on a 1-minute chart that could just be market noise. A good practice is to spot a Doji on a higher timeframe (e.g., daily) and then use a lower timeframe (e.g., 1-hour) to find a precise entry after confirmation.
Can Dojis appear in any market?
Yes, Doji candles can appear in any market—forex, stocks, commodities, or cryptocurrencies—and on any timeframe. The psychology of indecision between buyers and sellers is universal, making the Doji a versatile pattern for technical analysts across all asset classes.
Is a Doji candle bullish or bearish?
A Doji itself is neutral; it signals indecision, not direction. Its meaning—whether it's a bullish or bearish signal—depends entirely on the preceding trend and the confirmation candle that follows. A Doji after a downtrend followed by a bullish candle is a bullish reversal signal. A Doji after an uptrend followed by a bearish candle is a bearish reversal signal.
Ready to Apply Your Knowledge?
You now have a practical framework for identifying Doji candles, understanding the market psychology behind them, and building a trade plan with clear entry, stop-loss, and confirmation rules. Theory is the first step, but true competence comes from applying these concepts in live market conditions.
If you're confident in your strategy and risk management, it might be time to take the next step. Our funding programs are designed for disciplined traders who can demonstrate a consistent edge.
Compare our funded account types and find the challenge that’s right for your trading style.