Most Volume Spread Analysis advice tells you high volume reveals what professionals are doing, but on a spot FX chart you may not be looking at traded volume at all. You'll learn how to read effort versus result, when to distrust a broker's volume display, and how to test a signal before risking money on it.
Why Volume Spread Analysis Matters for Modern FX Traders
You've probably had this moment. Price pushes into resistance, the volume bar underneath spikes, and you can't tell whether buyers are taking control or walking into a wall of selling. Volume Spread Analysis tries to answer that question by reading three things together, traded volume, the candle's high-to-low range, and where price closes inside that range.
That's useful, but only up to a point. The popular claim that volume shows you a universal footprint of large traders doesn't survive contact with spot FX, where there's no central exchange and many charts show tick volume instead of executed volume. Treat VSA as a relative, instrument-specific context tool and it becomes much more defensible.

What you'll actually learn to do
- Read effort against result Compare how much activity a bar required with how far price moved and where it closed.
- Normalize before judging Measure a bar against recent bars from the same instrument and session, not against an absolute idea of high or low.
- Filter the regime first Separate normal liquidity from news releases, session transitions, rollovers, and abnormal spreads before naming a pattern.
- Demand confirmation Let following bars prove or kill your reading instead of entering on one candle.
That last habit is the difference between using VSA as evidence and using it as decoration. A narrow bar on heavy activity might be absorption, where opposing orders stop price moving. It might also be a burst of quote updates, a widening spread, or traders repricing after data. The bar alone can't settle it.
Don't ask what a candle is called. Ask whether the next bars behaved the way your interpretation predicted.
Trading involves risk of loss, and this guide is educational only, not financial advice. No VSA label protects an account if position size, invalidation, and maximum loss aren't decided before entry.
The Wyckoff and Williams Roots of VSA
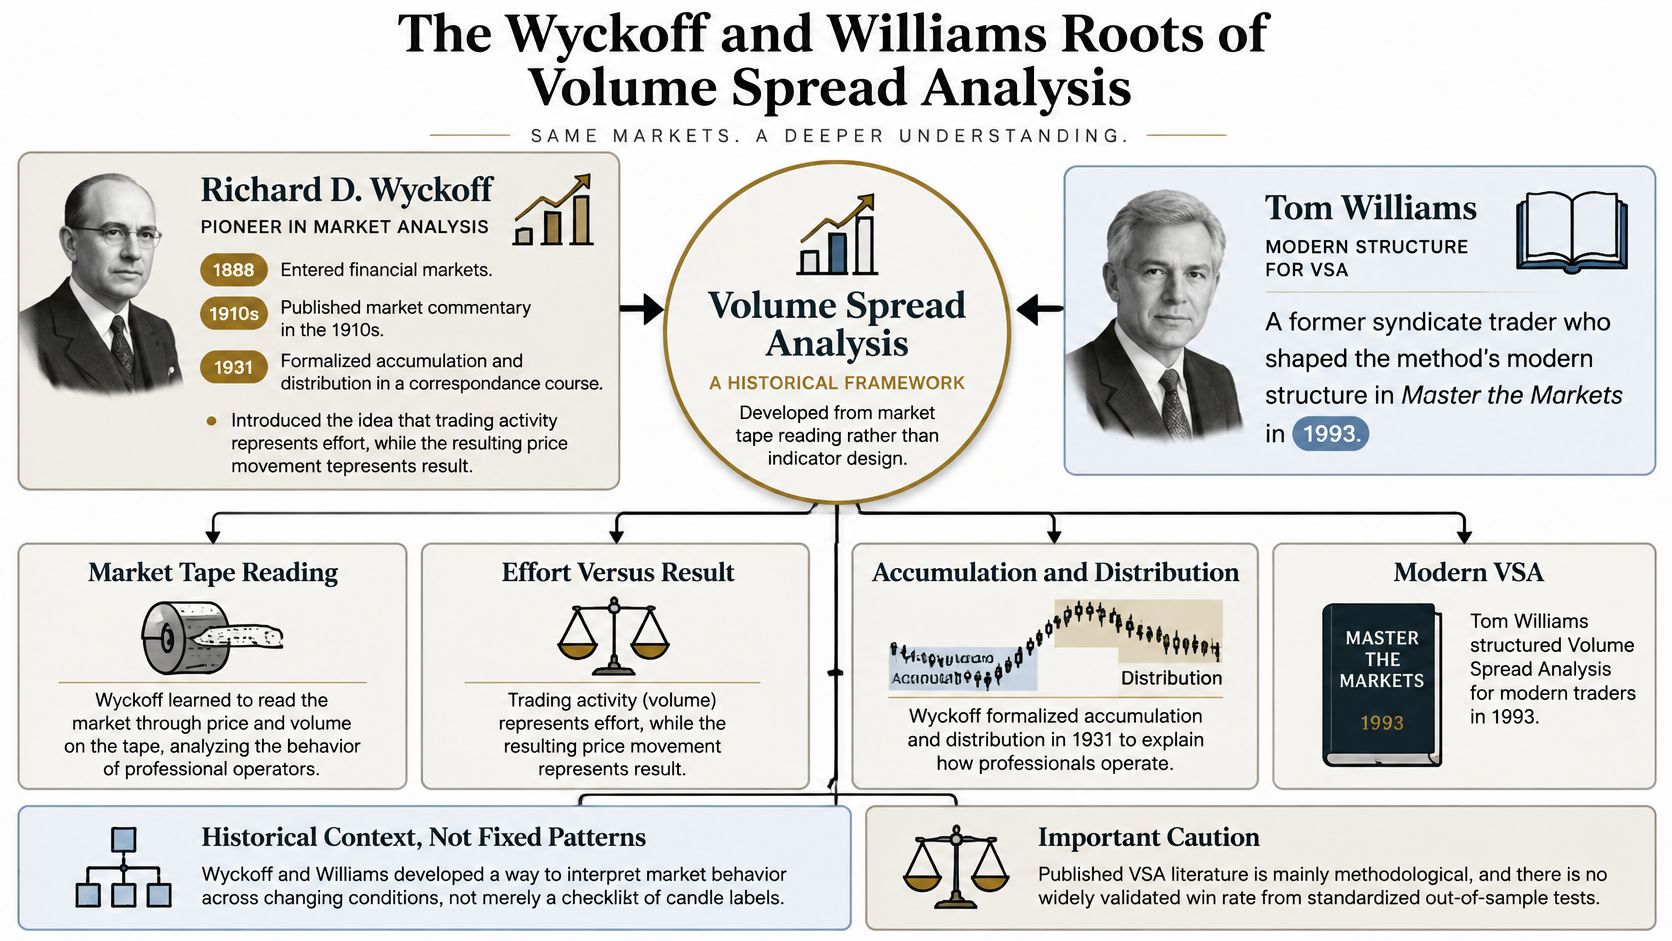
VSA didn't begin as an indicator package. It grew out of tape reading, where traders watched transactions and price changes and tried to infer whether large operators were accumulating a position or distributing one. That origin explains both its strength and its weakness. It's built around market behavior, but it was never built around a standardized signal test.
Richard D. Wyckoff provided the foundation. As the history set out in this overview of the Wyckoff method and its development records, Wyckoff began working in financial markets in 1888, formalized his method through a 1931 correspondence course, and Tom Williams later structured it as VSA in Master the Markets in 1993, making the framework more than a century old.
Wyckoff published market commentary during the 1910s and developed ideas around accumulation and distribution. If you trade those ranges today, it helps to study how Wyckoff distribution patterns develop at market tops alongside the bar-by-bar work. His core proposition was simple and durable. Unusually high or low activity, the size of the price bar, and the closing location can reveal whether buying or selling pressure is dominant.
What Williams changed
Williams, a former professional syndicate trader, made that thinking more explicit. Instead of asking you to absorb a broad market philosophy, he directed attention to a repeatable comparison on every bar:
- Effort How much trading activity occurred?
- Result How far did price travel for that activity?
- Close Who appeared to control the end of the bar?
That structure is why VSA is better understood as a historical framework than a bag of candle names. Wyckoff asked what large participants might be doing across a campaign. Williams gave retail traders a smaller unit of analysis they could apply bar by bar.
Be candid about the evidence, though. The published literature is primarily methodological, and it doesn't establish a universally validated win rate for VSA signals from large, standardized out-of-sample tests. A method can be logically coherent and still fail on your instrument, your session, or your costs. History gives VSA a rationale. It doesn't give your setup an edge.
The Three Inputs of Volume Spread Analysis
Every VSA reading starts with the same three measurable inputs. Spread is the distance between the bar's high and low. Volume represents the activity behind the bar. Closing location shows where price finished within that range. Mistakes start when traders read one input and ignore the other two.
Think of a packed stadium that stays oddly quiet versus a half-full one that erupts. Crowd size alone tells you little. You need to know how much noise all that presence produced. VSA works the same way. Volume is the crowd, range is the noise, and the close tells you which side was still standing at the end.
A worked comparison
Take a wide-range up bar on high volume that closes near its high. Effort produced a proportional result, and buyers controlled the close. That's a demand candidate, not a proven demand signal. It only earns that label if following bars hold the advance or continue without heavy selling appearing.
Now change one detail. Volume is just as high, price rises, but the range is narrow and the close sits near the middle. Buyers spent plenty of effort and got little movement. Sellers may have absorbed that buying with limit orders, or liquidity may have been deep enough to fill buyers without pushing price far. Either way, volume alone would've misled you.
Reverse the proportions and you get another useful warning. A wide range on light volume can look decisive, but price may have moved easily because few opposing orders were present. That's not the same as conviction. Once normal liquidity returns, that move can retrace quickly.
- High effort, wide result, strong close Activity and movement agree. Look for continuation or a quiet retest.
- High effort, narrow result, mid-range close Possible absorption. Look for price to fail at the same area again.
- Low effort, wide result Price moved through thin conditions. Treat breakouts with suspicion.
- Low effort, narrow result Little information. Don't manufacture a story from an inactive bar.
Before calling volume high, normalize it. CME's explanation of futures volume and participation reports that futures volume measures contracts exchanged and that high-volume periods typically feature narrower bid-ask spreads, faster fills, and fewer gaps, which is why volume normalization by session and instrument is the practical first step for VSA. Compare the current bar with a rolling 20 to 50 bar median from comparable hours, then wait for confirmation. If you can't describe effort, result, and close in one sentence, you don't have a VSA reading yet.
Spot FX Volume and the Broker Problem
Here's the assumption worth challenging. A big volume bar on your EUR/USD chart doesn't necessarily mean a comparable amount of currency changed hands across the market. Spot FX is decentralized, and broker platforms commonly display tick volume, a count of price updates from that broker's feed. It's a proxy for activity, not a consolidated tape.
That distinction can change the trade. One broker may print a high-tick-volume, narrow-range bar during a busy quote burst while another feed looks unremarkable. If you call the first one absorption and short into it, you may be trading your broker's data feed rather than market-wide selling.
Why liquidity changes the reading
Volume doesn't carry the same meaning in every liquidity regime. In market microstructure research on price, volume, and spreads, a 2021 study of 45 U.S. firms found a long-run positive price-volume relationship in 62% of firms, but most firms showed no stable relationship between volume and bid-ask spread, showing volume cannot be read independently of liquidity conditions.
For an FX trader, that means a signal needs context before it needs a name:
- Check the session Compare London activity with London baselines and quieter hours with their own baselines.
- Check the spread Abnormal bid-ask spreads can distort range and make fills worse than your chart suggests.
- Check another feed Where possible, compare the same event across brokers for consistency.
- Check futures Cross-reference major pairs against centralized CME currency futures volume when it's available.
- Check the calendar Scheduled data, market opens, and rollovers belong in a separate category from normal trading.
Practical rule: If the event exists on only one broker feed, treat it as unconfirmed data, not institutional intent.
This doesn't make tick volume useless. Used relatively, within one instrument, one broker, and one session, it can still flag unusual activity. You just can't promote it into proof that large traders absorbed supply. Centralized equities and futures offer exchange-reported volume. Spot FX, many CFDs, and fragmented crypto venues don't share one tape, so your confidence should reflect that difference.
Reading VSA Setups in Practice
Use setups as scenarios to study, not promises. Each one below has an invalidation point because a plausible story without a failure level isn't a trade plan.

Setup one absorption at resistance
Price rises into a well-tested resistance level during an active session. A bar prints unusually high relative volume, but its range stays narrow and the close sits near the middle. Buyers are active, yet price can't progress. That's your absorption candidate.
You still don't short that bar. Mark its high as invalidation and wait for a following bar to break its low, which shows sellers following through after absorbing demand. If price instead closes above the candidate bar's high, the absorption reading failed. Walk away. This is also where studying order flow analysis as a confirmation layer can help, provided you use it to test the idea rather than stacking signals until one agrees with you.
Setup two wide range with a weak close
Now picture a wide-range up bar that closes near its low. Price traveled a long way, but sellers controlled the finish. If relative volume is also falling compared with earlier advance bars, you're seeing movement without durable support. A next-bar break below the low strengthens the reversal case. A strong close back above the midpoint weakens it, and a close above the high invalidates it.
VSA bar patterns at a glance
| Bar Pattern | Volume vs Range | Close Location | Interpretation | Invalidation |
|---|---|---|---|---|
| Absorption candidate | High volume, narrow range | Middle | Opposing orders may be absorbing effort | Close beyond the bar's extreme |
| Demand candidate | High volume, wide range | Near high | Buyers produced and held progress | Failure to hold the advance |
| Weak advance | Wide range, unconvincing volume | Near low | Sellers regained control late | Close above the bar's high |
| Thin breakout | Low volume, wide range | Near high | Price moved through sparse liquidity | Quick return inside the prior range |
- Classify the regime Skip the setup during major releases, abnormal spreads, and unstable session transitions.
- Write the prediction State what the next bars should do if your reading is right.
- Place invalidation beyond the zone Use the candidate bar's extreme, not a level chosen to make position size convenient.
- Size from the stop Decide maximum loss first, then calculate size. Strong-looking volume is never a reason to increase it.
Give the idea a short confirmation window and score what happened. If price doesn't follow through, the market has answered you.
Backtesting VSA Without Fooling Yourself
Counting attractive candles on old charts isn't a backtest. You'll remember the absorption bar that marked a top and skip the similar bar that preceded a breakout. An honest test defines the event before looking at outcomes, then measures expectancy after spread, slippage, and commissions.
Start by converting discretionary language into standardized inputs. High volume might mean a volume z-score or percentile calculated against a rolling window from the same session. Narrow range might mean a low true-range percentile. Weak close can be recorded as a close-location value, where the close is measured as a position between the bar's low and high. Add the contemporaneous bid-ask spread so abnormal conditions do not pollute the sample.
A cleaner testing protocol
- Export the raw bars Pull open, high, low, close, tick volume, and spread data from DXtrade or cTrader for one instrument at a time.
- Normalize inside each session Build rolling percentiles separately for comparable trading hours rather than mixing quiet and active periods.
- Tag every regime Label normal liquidity, scheduled-news windows, post-news repricing, session transitions, and abnormal spreads before testing entries.
- Write the confirmation rule Specify whether entry requires a break of the signal bar, a close beyond it, or another objective follow-through event.
- Subtract real costs Model the spread you'd pay in that regime, plus slippage around fast moves.
- Split the sample Develop rules on one period and judge them on later, untouched data.
Segment results by instrument, session, and volatility regime. A pattern that survives only after you've removed every losing condition by hand is probably curve-fitted. Keep the exclusion rules explicit, especially if you automate or copy trades, because software can't apply your unspoken discretion. If you need a broader framework first, work through how to backtest trading strategies without overfitting the result and then adapt that discipline to VSA events.
Futures data adds one more check that spot FX can't provide cleanly. CME's guide to volume and open interest reports open interest as contracts that remain open and not offset, with each transaction counted once, so high volume with rising open interest suggests new positions while high volume with declining open interest more often reflects position closing or liquidation.
A contemporaneous price and volume relationship isn't predictive proof. Your test has to show that the signal still pays after costs on data you didn't use to design it.
Require a large enough sample inside each segment before drawing conclusions. If expectancy disappears outside one pair, one broker feed, or one quiet regime, report that directly. A narrow edge you understand is more useful than a universal story you invented.
FAQ on Volume Spread Analysis
Why does the same VSA signal look different across brokers?
Spot FX feeds aren't consolidated, so tick counts and ranges can differ by broker and liquidity provider. Compare the event across feeds, normalize each one separately, and reduce confidence when only one platform shows it.
Can VSA work with market structure and trend filters?
Yes, if each tool has a separate job. Use higher-timeframe structure for location and direction, session timing for regime, and VSA for bar-level evidence. Don't keep adding indicators until disagreement disappears.
Which timeframe works best?
The logic scales across timeframes, but the data quality and costs don't. Lower timeframes contain more quote noise and spread sensitivity, while higher timeframes produce fewer events. Test your chosen timeframe independently.
Remember the account rules too. The SEC's day-trading margin disclosure explains that SEC day-trading margin rules allow up to four times maintenance-margin excess for qualifying pattern day traders, restrict buying power to two times during a margin call, and impose a 90-day cash-only restriction for unmet calls, showing why account-level limits must be checked before any VSA setup is taken.
If you've built a tested VSA process and want to apply it without tying up your own capital, MyFundedCapital offers Instant Funding and 1-Step or 2-Step Challenges across forex, indices, commodities, and crypto on DXtrade and cTrader. Compare the account types, loss limits, and profit splits carefully, then start with the structure that matches the risk controls you've already proven in testing.