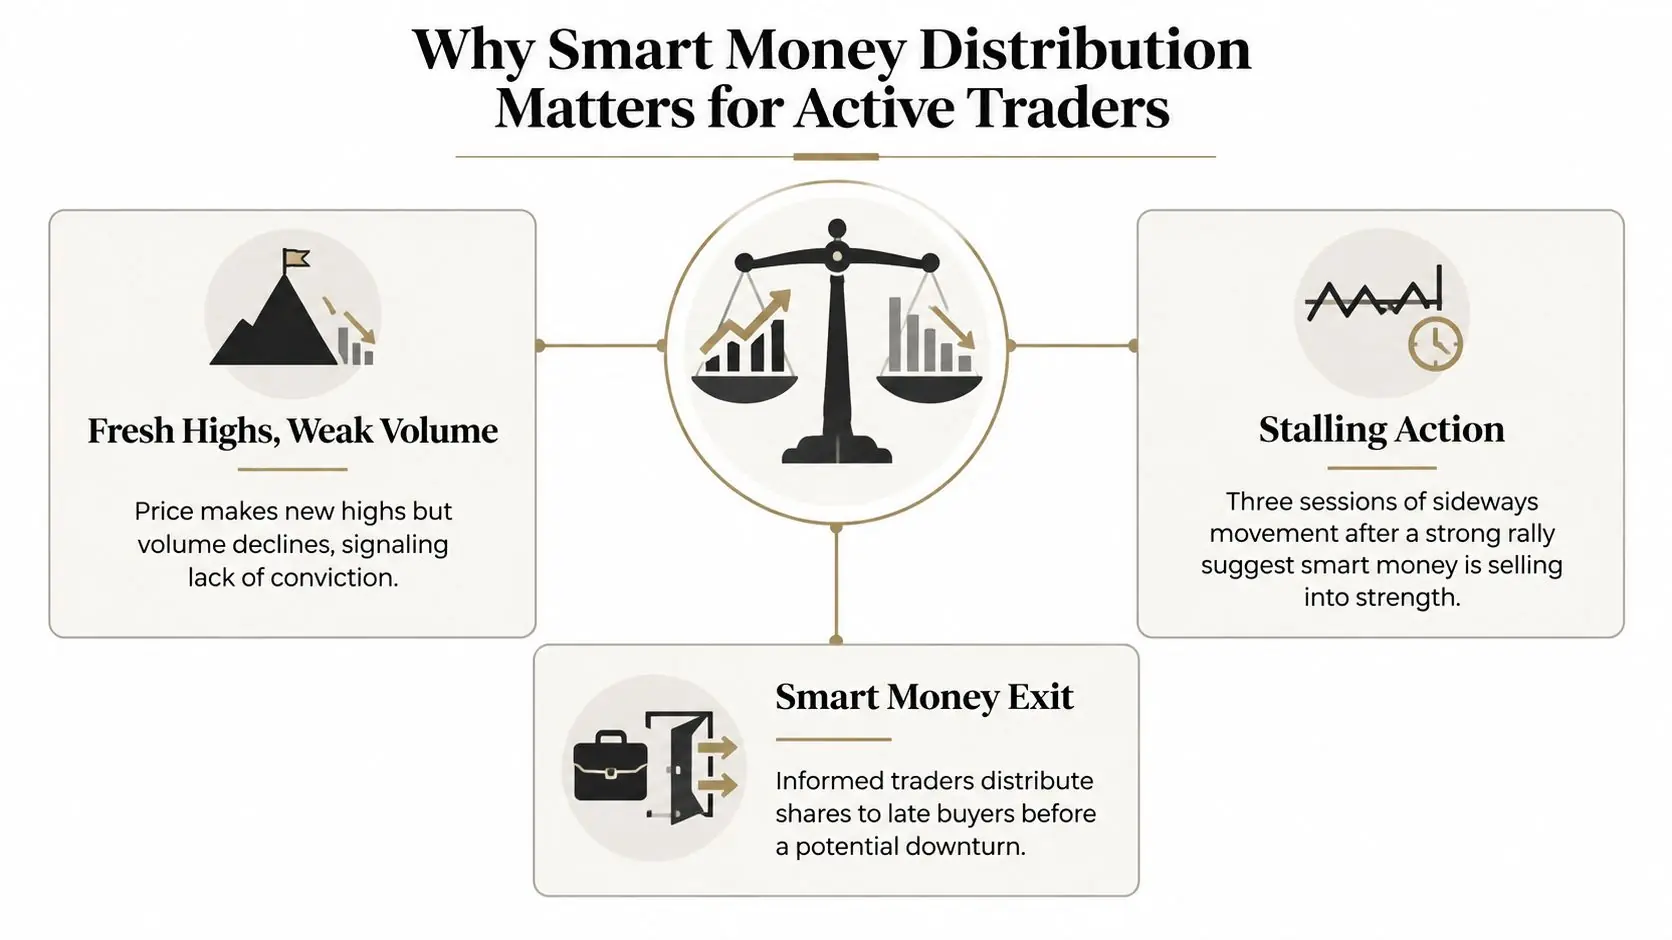
You watch an index print a fresh high after strong headlines, then it stalls for three sessions while volume fades. Is the rally resting before another leg higher, or are large holders using the optimism to exit? Wyckoff distribution patterns give you a practical way to answer that question by combining price structure, volume, failed breakouts, and confirmation instead of relying on one dramatic candle.
Why Smart Money Distribution Matters for Active Traders
Distribution is the market's supply-side counterpart to accumulation. After a sustained advance, large participants can sell into enthusiastic demand while price remains near its highs. Richard D. Wyckoff developed this price-and-volume framework in the early 1900s to study how informed sellers unload positions before a markdown. The key is to read the change in behavior, not label every sideways range as distribution.
A modern index can show the process clearly. Suppose it rallies from 4,800 to 5,000, pushes briefly above 5,000 on expanding volume, then closes back inside the range. A later rally reaches 4,990 on noticeably lighter volume and stalls again. That failed follow-through, especially after an apparent upthrust, carries more information than the fresh high alone. Crypto often stretches the same structure: a coin may spike above resistance during a news-driven session, attract breakout buyers, and then spend several days unable to hold that level.
Before adding to a long position, ask three questions:
- Where did the range form? A range after a sustained advance deserves more suspicion than one appearing after a decline.
- How do rallies behave? Higher prices with fading participation, shorter advances, or repeated rejection suggest that demand is losing force.
- What happens on reactions? Expanding volume on declines, weaker rebounds, and failed resistance tests indicate that supply may be gaining control.
The practical risk is giving back a profitable long while treating every bounce as confirmation. Shorting the first sharp rejection creates the opposite risk, because a distribution range can keep testing its upper boundary before breaking lower. The overview of smart money concepts provides useful context, but the chart must confirm the story through price spread, volume, and follow-through.
Reduce long exposure as the structure loses quality, wait for evidence before shorting, and mark the price level that invalidates the thesis. Wyckoff distribution patterns work best as a process: observe the range, test the competing explanations, then act when supply gains confirmation.
Practical rule: A high matters because of what follows. Failed follow-through often reveals distribution before the breakdown.
The Three Wyckoff Laws Behind Every Distribution
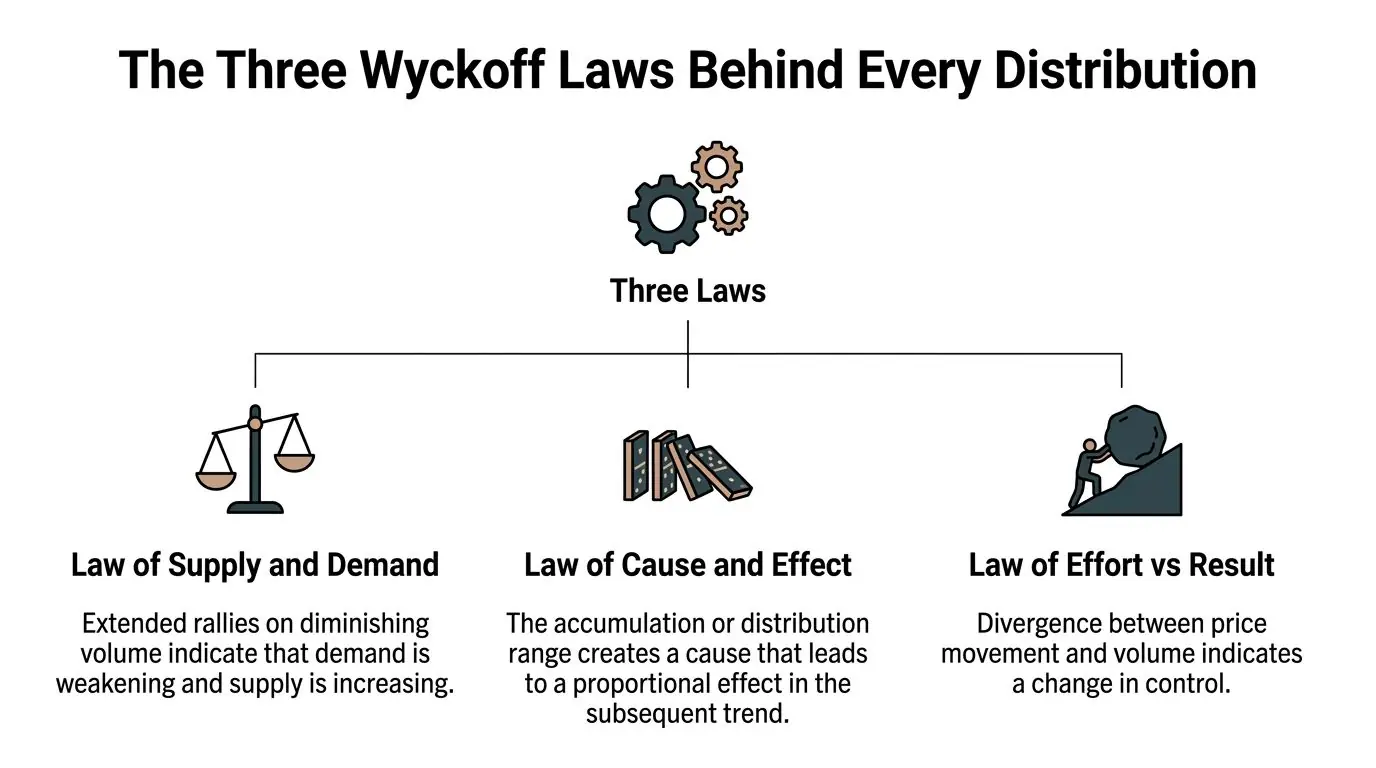
A crypto index can push to a fresh high while volume surges, yet the next rally barely extends the range. That conflict deserves more attention than the pattern's label. Before calling Phase A or Phase C, examine the mechanics behind the range. StockCharts' explanation of the Wyckoff laws links distribution to supply and demand, cause building, and the eventual effect of a markdown.
Supply and demand
Prices rise when demand exceeds available supply and fall when supply exceeds demand. During distribution, sellers can absorb aggressive buying at higher prices, holding the market in a range instead of forcing an immediate collapse. Positive headlines and repeated resistance tests can therefore coexist with deteriorating upside progress.
Read the sequence, not one candle. Suppose price advances on expanding volume but adds only a few points, then drops on a wide spread and needs several attempts to recover. The combination suggests supply is meeting demand more effectively. A sharp reaction on light volume, by itself, proves less. It may reflect temporary profit-taking, so the next rally and reaction must confirm the interpretation.
Cause and effect
The range builds the cause. Its width, duration, and internal activity help frame the potential effect, usually a markdown. This law gives you a way to measure the structure rather than inventing a target after support fails. It does not guarantee that price will reach the projection.
A range spanning 25 to 40 points can produce a meaningful projected move when its height is applied below support. Treat that estimate as a reference, not a promise. Volatility can stretch the range, invalidate the first support break, or produce a deeper test before the larger move develops. This matters in crypto and indices, where fast swings can make a classic schematic look compressed or oversized.
Effort versus result
Volume represents effort. Price progress represents result. If buyers trade heavily near resistance but price gains little and closes back inside the range, their effort produced a weak result. Wyckoff Analytics' treatment of the Wyckoff method describes this divergence as evidence that supply may be absorbing demand.
Use the laws together:
- Demand weakens when rallies require more activity but deliver less progress.
- Supply strengthens when reactions widen and rebounds fail to reclaim prior levels.
- The range creates a cause that may support a larger move after control shifts.
A distribution top is not bearish because it resembles a diagram. It becomes credible when the prior advance, stalled buying effort, expanding supply, and loss of support form one consistent explanation. Keep alternative explanations alive until follow-through settles the question.
Reading the Five Phases of a Distribution Top
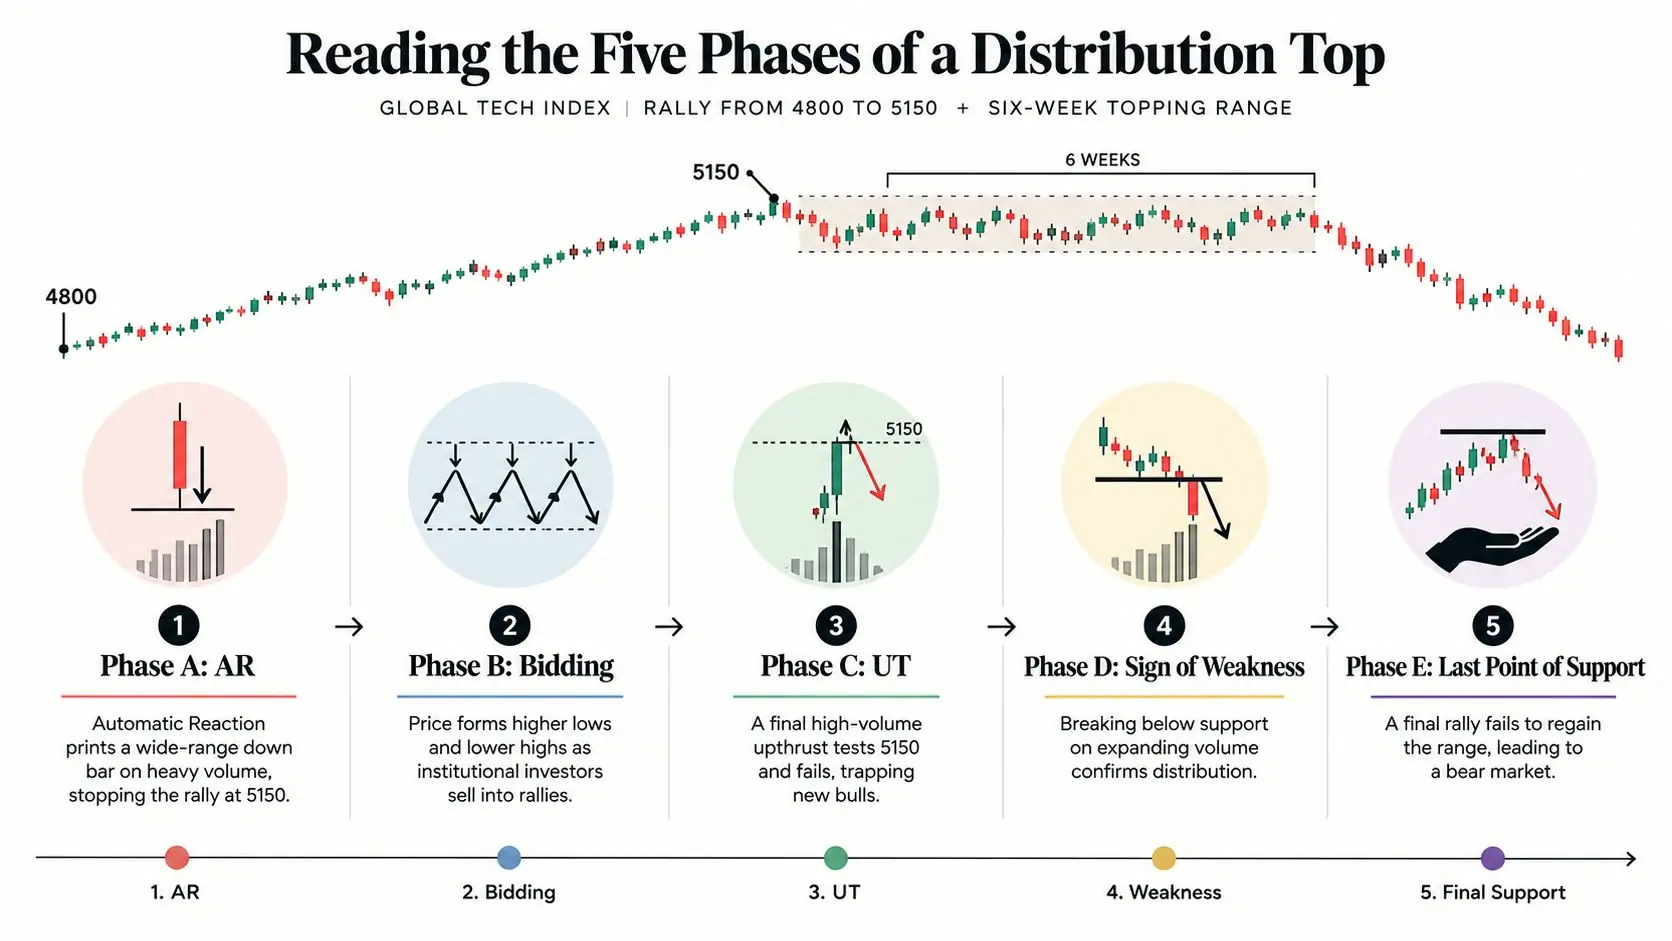
Use a fictional Global Tech Index to read the structure in sequence. It rallies from 4800 to 5150, then spends six weeks forming a topping range. The prices are illustrative rather than a historical case study. Focus on how price reacts at each boundary, and remember that crypto or index volatility can stretch these phases until the textbook shape becomes difficult to recognize.
Phase A stops the prior uptrend
At 5150, the index prints a wide-range down bar on climactic volume. This is the Automatic Reaction, or AR. It interrupts the advance and sets an initial lower boundary for the range.
A later secondary test returns toward the high but stays above the AR low. The chart now has a question to answer. Buyers may be pausing, or the prior uptrend may be losing control. Phase A is the first evidence of that change, not the markdown itself.
Phase B builds the range
Price oscillates between the AR low and the 5150 area. Rallies meet selling, while reactions attract enough buying to prevent an immediate breakdown. This back-and-forth gives larger participants room to distribute shares or contracts while other traders treat each rebound as proof that the original trend remains intact.
In a fast market, Phase B may look messy. A range can widen after a news-driven spike, or several tests can occur at slightly different resistance levels. Springs and upthrusts may appear within or around the band, but neither is an automatic signal. Check whether price can hold above resistance and whether each rally makes real progress.
Phase C tests demand
A final upthrust pushes above resistance, then closes back inside the range on heavy volume. This is the classic Phase C failure. Breakout buyers entered above 5150, while sellers absorbed that demand and forced the close back into the earlier structure.
The rejection carries more information than the brief new high. A breakout that holds above resistance shows acceptance. An upthrust that quickly loses the level shows failed acceptance. In crypto, a wick above resistance can be unusually large, so judge the close and the following reaction rather than measuring the wick alone.
Phase D shows weakening rallies
The index then breaks toward the lower part of the trading range and produces a Last Point of Supply, or LPSY. Late longs buy the rebound, but the rally stops below the prior range high while volume declines. That lower high shows that demand can no longer repair the earlier damage.
A break below the trading-range low followed by a weak rally that cannot reclaim support provides stronger confirmation than the initial upthrust. The failed recovery is the evidence. The label only summarizes it.
Phase E begins the markdown
In Phase E, supply controls the market. Wide-range down bars move below the range, and volume expands as price leaves the topping structure. A failed retest can turn former support into resistance, while successive lower highs keep the markdown intact.
These phases form a sequence, not a checklist of candles. In modern indices and crypto, Phase C may be shallow, Phase D may arrive after several false breaks, and Phase E may begin with abrupt liquidation. Read the relationships between highs, lows, closes, and volume, then ask whether the whole structure supports distribution rather than forcing every move into the schematic.
Effort vs Result and the High-Volume Upthrust Signal
Read distribution by comparing effort with result, not by measuring volume or a wick in isolation. A rally supported by heavy volume should usually make clear upward progress. If price travels far but cannot hold the advance, supply may be absorbing the buying.
Consider an index that reaches 5,520, trades across a 1.8% intraday spread, and records 1.4 million contracts. The candle then leaves a long upper wick and closes near 5,470. Buyers created substantial activity, yet they could not keep price near the high. That mismatch makes the bar a potential high-volume upthrust.
Treat the signal as a testable hypothesis. Mark the resistance zone and study what follows:
- The first test returns toward the high on lower volume and with a narrower spread.
- The reaction fails to recover strongly, showing less demand than the upthrust.
- The next rally cannot reach the prior extreme or closes weakly again.
The sequence matters more than the reversal candle. In a fast market, one news-driven spike can produce the same wick without proving distribution. Repeated failure to hold higher prices gives the pattern more weight, especially when each bounce achieves less despite renewed effort.
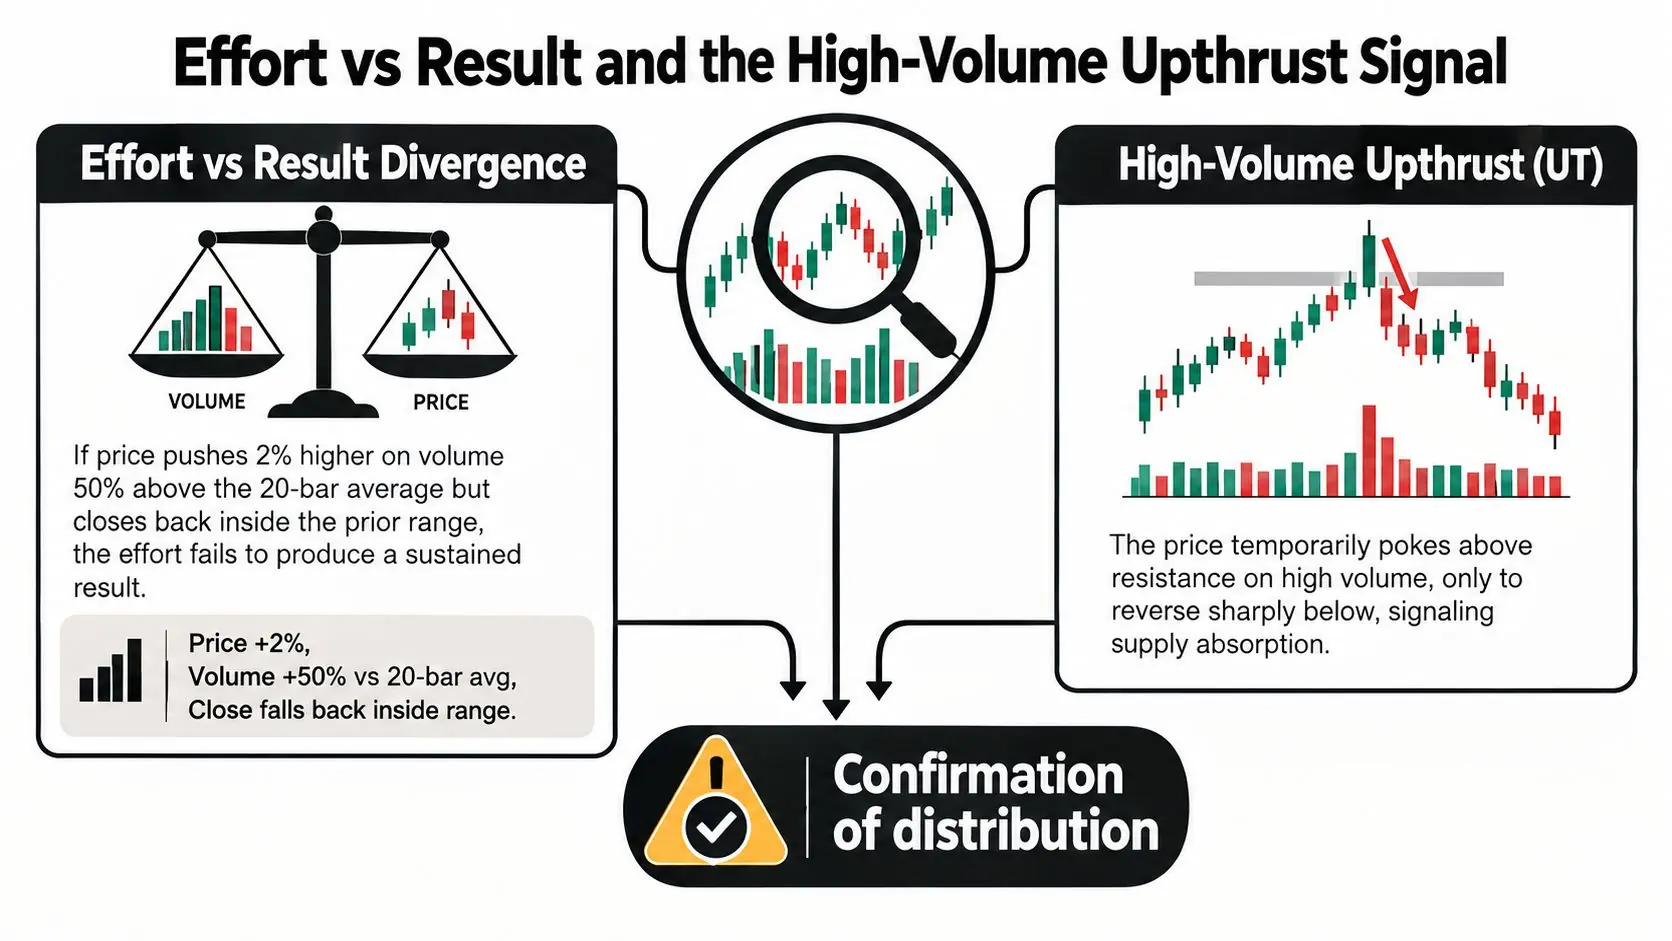
A healthy breakout behaves differently. Price expands above resistance, holds the new level, and continues upward with supporting volume. Effort produces result. In an upthrust, effort attracts buyers, but sellers control the close and the following tests.
For a broader explanation of what volume means in trading, review how activity measures participation rather than direction. Volume can confirm a developing structure, but it cannot predict every next candle. Keep the conclusion conditional until price confirms it.
How Distribution Looks Different Across Indices and Crypto
The classic Wyckoff schematic came from early twentieth-century equity tape reading. Modern indices and crypto still display supply and demand, but their trading mechanics can stretch, compress, or distort the visual pattern.
A slow-moving index such as the S&P 500 may spend long periods moving sideways near resistance. Its rallies can weaken gradually, and its reactions may remain orderly. Crypto markets such as BTC and ETH can complete similar-looking transitions much faster, with sharp moves that create false breakdowns and violent recoveries.
| Feature | Slow-Moving Index, such as S&P 500 | Fast-Moving Crypto, such as BTC or ETH |
|---|---|---|
| Range behavior | More orderly swings between resistance and support | Larger wicks, abrupt reversals, and unstable boundaries |
| Upthrust appearance | A failed push above resistance with a weak close | A rapid liquidity move above resistance followed by a sharp reversal |
| Volume interpretation | Exchange volume can offer a relatively consistent comparison | Fragmented venue activity and derivatives trading complicate the signal |
| Breakdown behavior | Support may fail with clearer follow-through | Leverage cascades can break support, reverse sharply, and break again |
| Confirmation | Lower highs and failed retests often develop visibly | You may need to distinguish spot demand from derivative-driven activity |
Crypto traders also contend with 24/7 trading, derivatives funding, and ETF flows. Those forces can make a classic volume signature less clean than it appears in a textbook. A large bar may reflect forced liquidation or positioning changes rather than a deliberate distribution campaign.
The schematic still helps, but the faster the market, the more dangerous it is to treat one wick as proof.
Read liquidity instead of relying only on printed volume. A practical resource on liquidity reading for crypto traders can help you examine available orders and potential gaps around key levels. That information won't validate a Wyckoff pattern by itself, but it can explain why a crypto market overshoots resistance or slices through support.
The modern question isn't whether Wyckoff works mechanically. It's whether the sequence remains coherent after accounting for volatility and fragmented participation. Recent commentary has applied Wyckoff to Bitcoin, including a 2025 narrative that mapped a move above $122,000, a breakdown below $102,000 to $104,000, and a Phase E target near $86,000. BitMEX's Bitcoin distribution discussion presents that reading as narrative rather than statistically validated evidence. Treat it as an interpretation, not proof of a repeatable edge.
Turning the Pattern Into a Manageable Trade
A correct read has no value if your trade plan is vague. The safer approach is to wait for structural evidence, define invalidation before entry, and size the position around the stop rather than around conviction.
Wait for confirmation
Don't automatically short the upthrust. A more controlled sequence is:
- Identify the upthrust and its rejection. Price must fail back inside resistance rather than pause above it.
- Watch the test. A later attempt toward the highs should show weaker volume and less price progress.
- Wait for Phase D behavior. Look for a lower high, a Last Point of Supply, and a break of the trading-range low.
- Enter on confirmed weakness. A break below range support with expanding volume offers more evidence than an early short inside the band.
Require at least two of three confirmations before risking capital: the upthrust, the lower-volume test, and breadth divergence. Breadth divergence is a supporting filter, not a replacement for price structure.
Define the trade
Stops can sit above the upthrust high, with an ATR-based buffer, or above the last secondary-test high when that level offers a tighter, structurally sensible invalidation. If price reclaims the failed breakout and holds, the bearish interpretation is wrong or premature.
Risk should be capped at 1% of the account for this framework. Size the position so a stop placed at 1.2 ATR represents that planned loss. Those figures are risk rules for the example plan, not a claim that the setup will produce a particular outcome.
For targets, take the lower boundary of the trading range first. Then consider a measured move equal to the range height projected downward, while recognizing that the law of cause and effect describes a potential effect, not a guarantee. Many traders reduce exposure at the first target and trail the remainder beneath successive lower highs.
For broader context on market testing and analysis, you can review the PolyBackTest market analysis page 17. Before placing an order, study liquidity, spread, execution conditions, and event risk. A deeper understanding of order flow analysis can complement the Wyckoff read, but it can't remove the risk of loss.
Common Mistakes That Turn a Good Read Into a Bad Loss
The clean textbook top is rare. Traders lose money when they treat every sideways range as distribution and every rejection as an invitation to short.
First, context comes before pattern shape. A range in the middle of a powerful advance may be continuation rather than distribution. A range during an established decline may represent redistribution, not a major market top. If you skip the preceding trend, your labels lose meaning.
Second, don't short the first wide-range bar. A dramatic reaction can be an Automatic Reaction, but it can also be a shakeout before buyers regain control. Effort-versus-result divergence becomes more useful after the structure develops and a Phase C test fails. A single bar can't establish that sequence.
Third, beware of forced analogies in crypto. A 2024 crypto rally could produce an AR-style rejection, trigger short covering, and then continue higher. That outcome doesn't disprove Wyckoff. It shows why an upthrust needs a failed test, weakening rallies, and breakdown confirmation.
Use this failure filter before entering:
- Trend check Was the range preceded by a meaningful advance?
- Structure check Can you identify resistance, support, and a credible Phase C test?
- Volume check Does supply appear on reactions while demand weakens on rallies?
- Confirmation check Has Phase D produced an LPSY or failed retest?
- Invalidation check What price action would prove the thesis wrong?
A premature short without a Phase D LPSY or a confirmed test is gambling dressed up as analysis.
Algorithmic markets can overrun obvious levels, especially when liquidity interacts with borrowed funds. Wait for the market to demonstrate that prior demand has failed before committing capital.
Your Distribution Checklist and Next Steps
Use the checklist as a series of yes-or-no gates. If an answer is unclear, skip the trade rather than forcing a pattern onto the chart.
- Prior uptrend: Did a sustained advance precede the range?
- Phase A: Can you locate an Automatic Reaction and a meaningful secondary test?
- Phase B: Has price spent enough time showing repeated interaction between resistance and support?
- Phase C: Did an upthrust push above resistance and fail to hold?
- Demand quality: Do later rallies show weaker spread, weaker closes, or lower volume?
- Phase D: Is there an LPSY, a Sign of Weakness, or a failed retest below prior support?
- Breakdown: Did price move through the range low with expanding volume and follow-through in the next two sessions?
- Risk: Is the position sized around a defined stop and the height of the distribution range?
The pattern becomes useful when patience filters out incomplete structures. Trading involves risk of loss, and no Wyckoff distribution pattern guarantees a reversal. Keep the planned loss small enough that one failed upthrust doesn't damage your ability to trade the next valid setup.
MyFundedCapital offers Instant Funding plus 1-Step and 2-Step Challenges for traders who want access to simulated capital under defined risk parameters. Visit MyFundedCapital to compare account types and explore a structured way to practice disciplined distribution-based setups across indices, crypto, forex, and other supported markets.