Tired of charts that look busy but still don't tell you when a swing setup is worth taking? The edge isn't hunting for one magic indicator, it's learning which tools confirm trend, momentum, volatility, and participation together. If you trade daily or 4H charts, the best indicators for swing trading are the ones that help you filter noise, avoid weak entries, and manage risk with rules you can repeat.
Free resources: Best Indicators for Prop Traders (the five indicators funded traders use most, with settings).
1. Relative Strength Index RSI for Momentum Timing
RSI is one of the first tools swing traders learn because it shows when momentum is stretched. The core idea is simple, RSI measures recent price change on a 0 to 100 scale, so overbought and oversold conditions stand out quickly. Use 30 and 70 as reference zones, then check them against support, resistance, and trend direction before acting on the oscillator alone.
Timeframe choice matters. RSI(14) fits 4H to daily holds well, while RSI 10 reacts faster for shorter swings. A practical comparison guide linked RSI alone to only 45% to 55% accuracy, while pairing RSI + MACD + volume was associated with 65% to 75% accuracy, which is why RSI works best as a timing tool rather than a full system. That same guide described RSI(14) as a 2 to 3 bar lag tool, so it helps with filtering, not forecasting, and swing trading in general targets moves lasting a few days to a few weeks.
Practical rule: if price is already in a confirmed trend, do not fade every RSI extreme. Wait for divergence, or for RSI to line up with a strong level.
A cleaner workflow is to set alerts near 25 and 75, then watch for price to react at support or resistance. In choppy conditions, RSI can whip back and forth without giving a tradable edge, so the surrounding chart context matters more than the reading itself. On the daily chart, I want RSI to agree with the broader direction before I treat it as a usable signal.
For a deeper framework, the RSI trading strategy guide is worth reviewing once. For a broader view of how RSI fits with other swing tools, the indicator comparison guide is useful, especially if you are building a rules-based setup that also has to respect prop firm limits like weekend holds and news filters.
2. Moving Average Crossover for Trend Confirmation
A moving average crossover gives a clean read on whether a swing is still carrying trend or starting to fade. The faster average reacts first, the slower average smooths out noise, and the cross between them helps define when momentum has shifted enough to matter. That matters in swing trading because the goal is not to predict every turn, it is to join a move after direction is clearer.
The most practical setup is usually 20 EMA and 50 EMA on the 4H or daily chart. A broader setup that pairs RSI(14), MACD(12,26,9), and 20/50 moving averages can help separate trend, momentum, and confirmation, which is why many traders build around that structure. If you want a deeper reference on the moving average side of the setup, the moving average indicator guide is a useful place to start. The lag is part of the job here. Longer moving averages react after price, so crossovers work best as confirmation, not as prediction.
How to make the crossover more useful
- Use volume as a filter take crosses only when volume is clearly above the recent average, otherwise the signal can be thin and unreliable.
- Match the timeframe to the hold use 20/50 for 4H to daily swings, and 10/20 only for faster intraday work.
- Let the daily chart lead if the daily trend is against you, a lower-timeframe cross can fail fast.
- Place stops with structure a stop 0.5 to 1 ATR below the slower average is more defensible than a random fixed distance.
The practical trade-off is simple. Faster averages get you in earlier, but they also whip around more in range-bound markets. Slower averages filter noise better, but they give up some entry price and often confirm only after part of the move has already happened. That is why I treat the crossover as a trend filter first and an entry trigger second.
GBP/USD daily crosses and EUR/USD 4H crosses are the kind of setups swing traders look for, but the logic holds across markets. A crossover without participation is just one line crossing another. With price structure behind it, it becomes a usable filter for the kind of swing move you can hold.
3. MACD for Momentum and Trend Strength
Can a swing trader really tell when momentum is improving before price fully breaks out? MACD helps answer that by showing whether momentum is building, fading, or rolling over. That matters in swing trading, because the entry often comes after the first push, while the edge comes from holding long enough for follow-through. The histogram is the part I watch most closely, since it often narrows or expands before price makes the move obvious.
The standard swing setup is MACD(12,26,9) on the daily or 4H chart. That parameter set is a practical default for swing work, and MACD still sits in the core indicator stack alongside RSI, moving averages, and volume (Cloudzy setup reference, effectiveness ranking). Regime matters just as much as the settings. MACD tends to work well in trends and loses a lot of value in choppy consolidation, while RSI often behaves better in downtrends and range conditions than it does in a strong uptrend (regime analysis).
Wait for the MACD line to cross the signal line, not just come close. Near-crosses look tempting, but they usually arrive too early.
How swing traders use it in practice
MACD has three practical jobs. It confirms that trend momentum is still healthy, it helps filter weak entries when the histogram is flat, and it warns you when momentum is fading so you can protect open profit.
A simple daily-chart rule works well. If the daily MACD turns up, drop to the 4H chart for cleaner entry timing, especially when price has been choppy. If the histogram starts shrinking while price is still moving in your favor, that is usually the point to cut risk or scale out, not to wait for a full reversal. That approach is especially useful for prop firm traders who need to respect holding rules, avoid unnecessary weekend exposure, and stay out of trades that can be hurt by news spikes. The best MACD trades are straightforward. They line up with trend, confirm with momentum, and do not ask you to guess.
4. Stochastic Oscillator for Precise Entry and Exit Timing
Stochastic works best after RSI has already told you the market is stretched, but you still need a cleaner trigger. It measures where the close sits inside its recent range and plots %K and %D, which is why traders use it to time entries and exits near support or resistance. The useful part is simple, oversold and overbought readings matter most when price is reacting at a level that other traders can see.
Use the Slow Stochastic (14,3,3) on 4H and higher charts if you want fewer false signals. That slower setting helps because Stochastic can flip too fast in noisy conditions. The usual guides are 80 and 20, but the read is stronger when the oscillator lines up with a real chart level instead of sitting in the middle of a range. One practical swing workflow treats Stochastic as an entry timing tool, not a direction tool, which helps keep traders from forcing reversals where the tape still looks weak.
A clean setup usually has price testing a level first, then the oscillator turning. If Stochastic is oversold while price is sitting above support, the signal has context. If it is oversold in empty space, the reading is much less useful. That distinction matters for prop firm traders too, because the best timing setups are the ones you can define tightly and manage without letting a small loss turn into a holding problem.
What to wait for
- Only take oversold entries near support an oversold reading in open air isn't enough.
- Use divergence selectively if price makes a new low but the oscillator doesn't, that can justify a tighter stop.
- Check participation signals are stronger when volume is above average.
- Avoid messy consolidations if the range is too tight and choppy, let price break first.
A good example is a clean bounce setup where Stochastic curls up from oversold while price tests an old support zone. That gives you a clear risk line and a reason to act without guessing whether the market will reverse. If the level fails, the setup is invalid, and that is part of the trade plan. The goal is not to catch every turn, it is to take the ones with structure behind them.
5. Bollinger Bands for Volatility and Mean Reversion
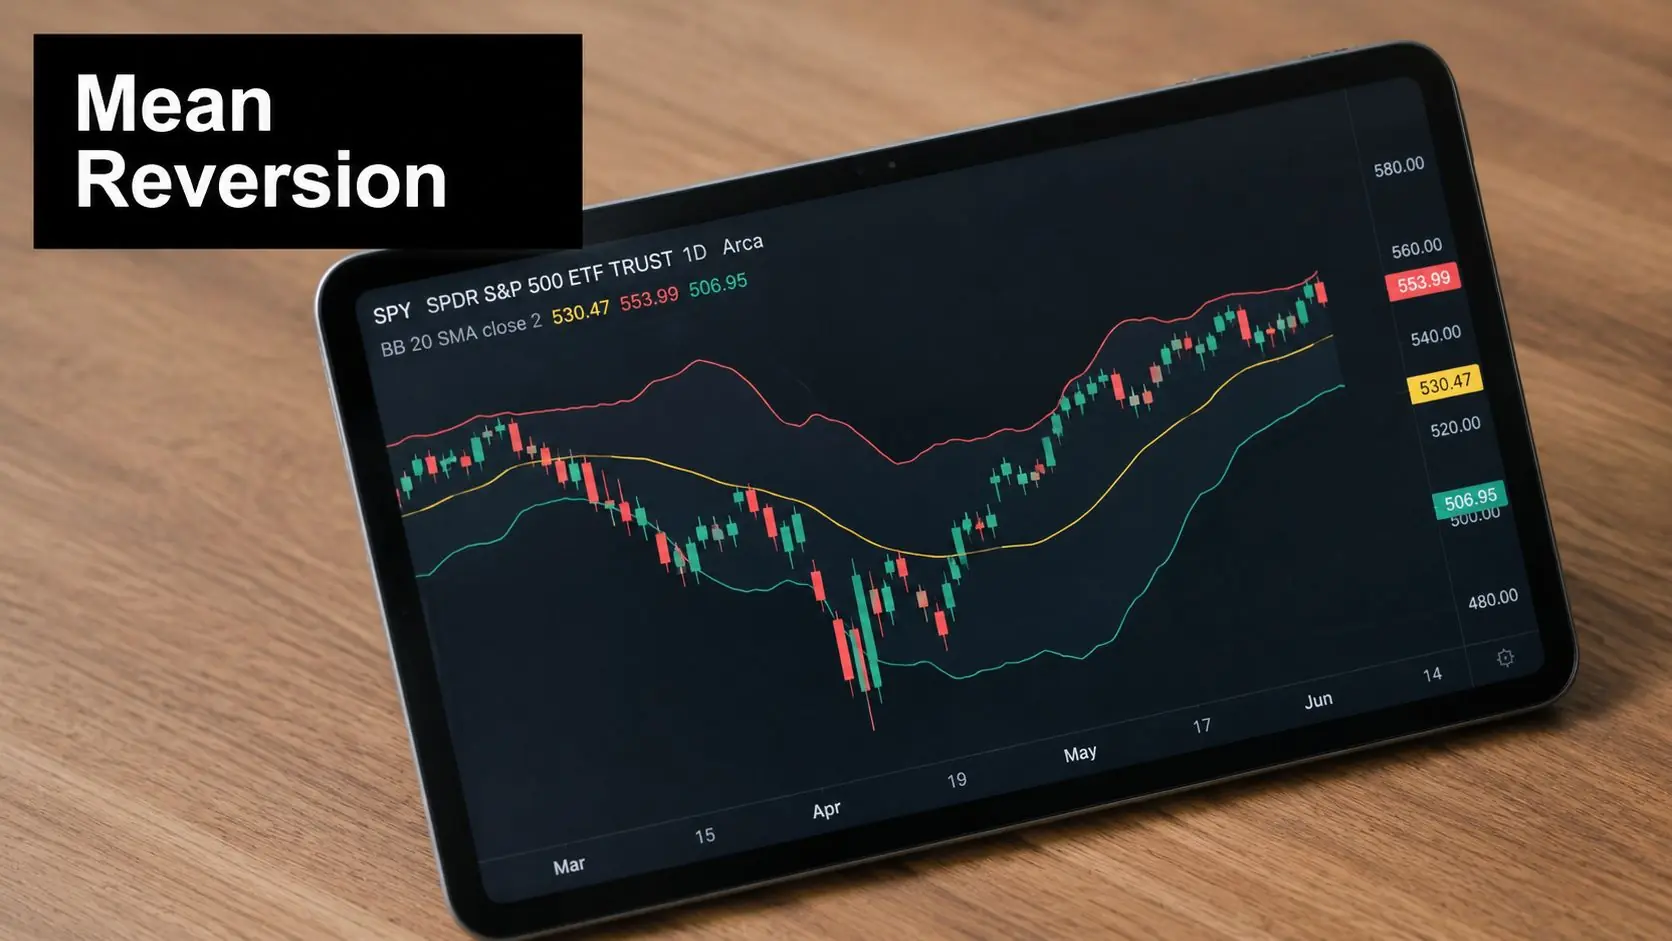
How do you know whether a swing market is coiling for a move or already stretched enough to fade? Bollinger Bands answer that question by showing where price sits relative to its recent average and how much volatility is available around it. They use a 20-period SMA as the middle band, with upper and lower bands set at 2 standard deviations. That setup helps swing traders spot both exhaustion and breakout conditions, so the same indicator can support two very different trade plans.
The mistake is treating every band touch as a reversal signal. In a strong trend, price can ride the upper band or the lower band far longer than a trader expects, and fading that move too early usually means fighting momentum. Bollinger Bands are most useful when price is moving inside a range or stretching into an area where volatility has already become extended. They work best when another tool confirms whether the move still has direction, which is why traders often pair them with momentum tools like RSI or MACD instead of using them alone (indicator overview).
When the bands matter most
A contracting band width usually means the market is coiling. That is not a reason to guess direction early, it is a reason to wait for the break and let price show its hand. For swing traders, the cleanest setups often come after compression, when price finally expands away from the middle band and gives you a defined place to manage risk. If the move is already far outside the bands, a continuation trade may still work, but a fresh entry needs a tighter stop and a clearer reason to stay with it.
Mean reversion setups need context. If price tags the lower band while the broader trend is flat and momentum is already stretched, a bounce back toward the middle band can offer a practical entry. If price closes back through the middle band after an entry, many traders will trim risk or take partial profits there, because that level often acts as the first checkpoint for whether the move has real follow-through. A workflow that combines Bollinger Bands with RSI, MACD, and volume gives a cleaner read on whether the market is expanding, compressing, or too extended to chase (structured swing workflow).
For prop firm traders, the band setup also needs discipline around risk. If you are trading into a weekend rule or avoiding major news windows, the bands can help you define whether the setup is worth holding or whether it is better to close before the event risk hits. Bollinger Bands do not predict reversals on their own, and they do not replace a stop. They give structure to a trade that would otherwise be guesswork, especially when you need a clear invalidation point and a reason to pass on low-quality noise.
6. Support and Resistance Zones for Price Action Trading
Do you want a cleaner way to spot where swing trades matter? Support and resistance zones are the backbone of price action trading because they show where price has already been accepted or rejected. A zone works better than a single line, because real markets do not reverse at one exact price. They cluster, wick, and overshoot before turning, so a zone gives you a more realistic map of where traders are likely to respond again.
Start with the daily chart, then refine on the 4H chart. That order keeps you from reacting to short-term noise before you know the larger area that matters. One swing-trading source recommends treating zones as 0.5 to 1 ATR wide rather than as thin lines, which fits the way price trades. A separate workflow guide also places support and resistance at the center of the swing-trading process, with trend, momentum, and volume layered around them (zone framing), (structured workflow).
Practical rule: a zone is only useful if it tells you where to enter, where to stop, and where the idea is wrong.
What makes a zone actionable
- Daily first, intraday second mark the higher-timeframe area before zooming in.
- Look for confluence a zone that overlaps a moving average or swing low is stronger.
- Use multiple confirmations three or more alignments reduce the need for extra indicators.
- Wait for price behavior if price stalls inside the zone, wait for a close beyond it or an oscillator signal.
The edge comes from context. Support and resistance turn the other indicators into a specific place on the chart instead of leaving them as abstract signals. RSI can show stretched momentum, MACD can show a shift in pressure, but the trade often happens where buyers and sellers have already fought before. That is where patience gets rewarded, because you are entering near a level where the market has already shown its hand.
For risk control, zones also help you avoid trades that look good on paper but fail under live conditions. If price is sitting inside a messy area with no clear rejection, pass. If the zone lines up with the broader trend and gives you a clean invalidation level, the trade is easier to manage. When you need volatility-aware stop placement and sizing around that structure, ATR-based stop guidance helps keep the position aligned with current market movement.
7. Average True Range for Stops and Position Size
ATR is the indicator that keeps your trade structure honest. It doesn't tell you direction. It tells you how much room the market is currently using, which matters because a stop that's too tight gets clipped, and a stop that's too wide can ruin your risk plan. For swing traders, ATR is less about prediction and more about matching position size and stop placement to current volatility.
A practical example makes that clear. If EUR/USD daily ATR is 95 pips, an entry at 1.0800 with a 1.5 x ATR stop puts the stop about 143 pips away, near 1.0658, while a 2.5 x ATR target lands about 237.5 pips above, near 1.1038. The useful part isn't just the math, it's the discipline of sizing the position so that stop distance matches your risk plan. One reference on swing trading explicitly lists ATR as a core tool for volatility-aware stop placement and sizing, and it's especially relevant when markets are quiet or stretched (ATR guide).
How to use ATR without overcomplicating it
Use a higher ATR as a signal to reduce size, not widen risk. Compare daily ATR with 4H ATR so you don't confuse intraday noise with real expansion. If ATR is very low, the market may be coiling before a larger move, which is exactly when traders get tempted to use stops that are too tight.
The most practical rule is simple. Let ATR define the market's breathing room, then place the stop just beyond that room and size the trade around the stop, not the other way around. That approach is far more useful for prop traders too, because it helps keep drawdowns controlled without choking good setups.
8. Combining Indicators and Risk Management for Swing Trades
The best swing trades usually come from confluence, not from one indicator flashing by itself. A clean setup often pairs a bullish MA crossover with RSI turning up from oversold, price holding a daily support zone, and volume showing real participation. Another workable stack is MACD momentum turning higher while Bollinger Bands contract and then expand, with ATR used to set a stop at a distance that fits current volatility.
That approach is backed by trader-focused guidance. One source recommends combining about 2 to 4 indicators from different categories so you avoid stacking the same signal twice, while another advises waiting for at least two signals to line up before taking a trade (indicator stacking guidance). A wider swing-trading summary makes the same point, saying that pairing 2 to 3 indicators can improve backtested win quality into the 75% to 85% range, though that figure should be treated carefully because it comes from a marketing-style summary rather than an audited institutional study (stacking summary).
Use indicators for different jobs. One should define trend, one should trigger entry, and one should confirm that the move has room to continue.
A practical rule set for prop-style trading
- Use one trend filter: moving averages or support and resistance.
- Use one momentum trigger: RSI, MACD, or Stochastic.
- Use one confirmation tool: volume, OBV, or a clean price break.
- Use ATR for risk: set the stop before entering.
- Respect the calendar: reduce size or skip trades around major news, especially 15 minutes before and after releases.
- Scale out logically: take partial profits at the first target, then trail the rest.
- Check holding rules: if your prop account limits weekend exposure, close or trim trades before the session ends instead of hoping for a gap in your favor.
For prop firm traders, the rules matter as much as the setup. Weekend holding limits, news filters, and daily loss caps determine whether a good chart pattern is tradable in the account. The right indicator stack should help you stay inside those limits, not push you into overtrading or holding risk you did not plan for.
A simple example keeps it practical. If a stock or forex pair is trending above its 20 and 50 moving averages, RSI is climbing out of oversold, and price is reacting cleanly from a support zone, the trade already has structure. Add MACD confirmation or a volume expansion on the breakout, and you have enough alignment to justify a smaller, well-defined position. If the signals conflict, stand aside.
That discipline is what separates a usable swing system from a messy chart full of indicators. The goal is not to collect more signals, it is to build one repeatable process for entry, stop placement, and trade management.
Top 8 Swing Trading Indicators Comparison
| Indicator / Method | 🔄 Complexity | 💡 Resource & Setup | ⭐ Expected effectiveness | ⚡ Ideal use cases | 📊 Key advantages |
|---|---|---|---|---|---|
| Relative Strength Index (RSI) – Momentum Oscillator for Overbought/Oversold Detection | Low, simple formula, easy chart setup | RSI 14 (10–14 for swings); OB/OS 70/30; Daily/4H | ⭐⭐⭐⭐, strong at detecting reversals & momentum confirmation (best 4H+) | ⚡ Swing reversals, confirmation at support/resistance, volatile pairs/crypto | 📊 Clear thresholds, responsive, good divergence signals |
| Moving Average Crossover (MA) – Trend Confirmation and Entry Timing | Low–Medium, trivial to plot; needs multiple MAs & filters | 20/50 EMA (or 20/200); use volume filter (≥120% avg); 4H/Daily | ⭐⭐⭐, reliable trend confirmation but lagging | ⚡ Trend-following swings, entry timing after trend confirmation | 📊 Reduces noise, clear visual signals, scalable across assets |
| MACD – Momentum and Trend Strength | Medium, multiple EMAs + histogram interpretation | 12/26/9 EMAs; histogram; 4H/Daily | ⭐⭐⭐⭐, good momentum confirmation; divergence and histogram useful | ⚡ Momentum swings, timing entries/exits and trend-strength assessment | 📊 Combines trend and momentum; histogram aids exit timing |
| Stochastic Oscillator – Overbought/Oversold Entry and Exit Timing | Low, two-line oscillator, fast/slow variants | %K/%D (14,3,3 typical); OB/OS 80/20; use Slow Stochastic on 4H+ | ⭐⭐⭐⭐, precise entries in oversold/overbought zones; can whipsaw | ⚡ Precise entry/exit timing near support/resistance and volatile moves | 📊 Two-line confirmation, effective divergences, clear thresholds |
| Bollinger Bands – Volatility and Mean Reversion Setups | Medium, needs SMA + std dev interpretation | 20 SMA ±2 SD; monitor bandwidth; 4H/Daily | ⭐⭐⭐, strong for mean-reversion and squeeze breakouts when confirmed | ⚡ Mean reversion trades, volatility-squeeze breakout anticipation | 📊 Visual volatility, middle-band support/resistance, bandwidth signals |
| Support & Resistance Zones – Price Action and Level-Based Trading | Medium, subjective drawing; needs confluence checks | Identify daily swing highs/lows, Fibonacci, round numbers; mark zones (0.5–1 ATR wide) | ⭐⭐⭐⭐, highly reliable with confluence and volume confirmation | ⚡ Entries/exits, stop placement, context for oscillator signals | 📊 Objective price areas, clear stop placement, high confluence reliability |
| Average True Range (ATR) – Position Sizing, Stop Placement, and Volatility Adjustment | Low, mathematical average; applied to sizing/stops | ATR 14 (adjustable); use 1–1.5× ATR for stops; 4H/Daily | ⭐⭐⭐⭐, essential for volatility-adjusted risk management | ⚡ Position sizing and stop-setting across instruments/timeframes | 📊 Volatility-aware stops, instrument-agnostic sizing, reduces false stop-outs |
| Combining Indicators & Risk Management, Practical Rules for Swing Trading | High, requires rule design and multi-indicator coordination | Multi-timeframe MAs/MACD/RSI/ATR/Bollinger + volume & zone confluence | ⭐⭐⭐⭐⭐, highest probability when rules and confluence applied | ⚡ Structured swing trading with risk controls and scaled exits | 📊 Reduces whipsaws, aligns risk-adjusted returns, enables tighter stops with confluence |
Build Your Swing Trading System and Get Funded
Which indicators belong in a swing trading system? The best indicators for swing trading are the ones that work together without crowding the chart. RSI helps with timing, moving averages define direction, MACD shows momentum, Stochastic sharpens entries, Bollinger Bands frame volatility, support and resistance anchor price, and ATR keeps risk realistic. If you try to use every tool on every setup, you usually end up with more hesitation than edge.
A cleaner approach is to build a small, repeatable system and test whether you can follow it trade after trade. Start with one trend tool, one momentum tool, and one risk tool. Keep the chart simple, take trades only when the pieces align, and review whether the result came from structure, discipline, or just luck.
That discipline matters in funded trading. Prop firms care about downside control, rule-following, and whether you can repeat a process without forcing entries. If your setup works on daily and 4H charts, test it in a structured environment where risk limits, payout rules, and execution quality all matter. An algorithmic trader job description often reads like a checklist for that same mindset, because the work depends on process, patience, and consistency.
Swing trading is not about catching every move. It is about waiting for a setup with a clear entry, a logical stop, and enough space for the trade to develop. That is a professional habit, and it is the same habit that separates random chart watching from trading that can handle larger capital responsibly. Trading involves risk of loss, and no indicator removes that risk, but a disciplined system keeps it defined instead of letting it spread.
Backtest your stack, tighten your rules, and keep only the tools that improve decision quality. Pay attention to the trade-offs as well. Weekend holding rules can limit how long you stay in a position, and news filters can keep you out of trades that look clean on the chart but carry event risk. If your swing plan depends on clean execution and strict risk control, review the funding options that fit that style and see whether the account structure matches the way you trade.