You've passed a trading challenge, opened a funded-style account, and started producing profitable days. Then one revenge trade, an unnoticed unrealized loss, or a position that's too large pushes the account past a rule you weren't actively tracking. This guide shows you how performance tracking tools can separate genuine edge from luck while helping protect your funded account from avoidable breaches.
Why Most Funded Traders Fail Before They Start
A capable trader passes the MyFundedCapital challenge, wins a $100,000 account, and feels ready to scale. In the second week, a losing trade triggers frustration. The trader enters again, increases size, and keeps trading while the intraday loss grows. They're focused on recovering the session, not watching the account dashboard. By the time they check the numbers, the 5% daily loss limit has already been breached.
That failure may look like a strategy problem. Often, it's a tracking problem.
A trader can have a sound setup and still fail because they don't know their current equity, daily drawdown, open risk, or distance from the maximum drawdown line. A green week can hide oversized losses, revenge trades, and gradual rule drift. Raw profit doesn't tell you whether your process is repeatable or whether one lucky position carried the entire result.
Practical rule: If you can't see your risk and rule distance before placing the next trade, you're trading from memory.
Performance tracking tools give you a running record of decisions, not just account balance. They can help you:
- Define your actual edge Compare expectancy, trade distribution, and risk-adjusted returns across setups.
- Monitor account safety Track daily loss, trailing drawdown, open exposure, and remaining buffer.
- Identify behavior drift Find revenge entries, late-session trades, inconsistent stops, and repeated rule violations.
- Prepare for review Keep an auditable record that supports payout planning and disciplined scaling.
The order matters. First, protect the account. Then judge the strategy. A trader who tracks only wins and losses feeds the ego. A trader who tracks context, risk, and compliance creates evidence they can use.
What Performance Tracking Tools Actually Do
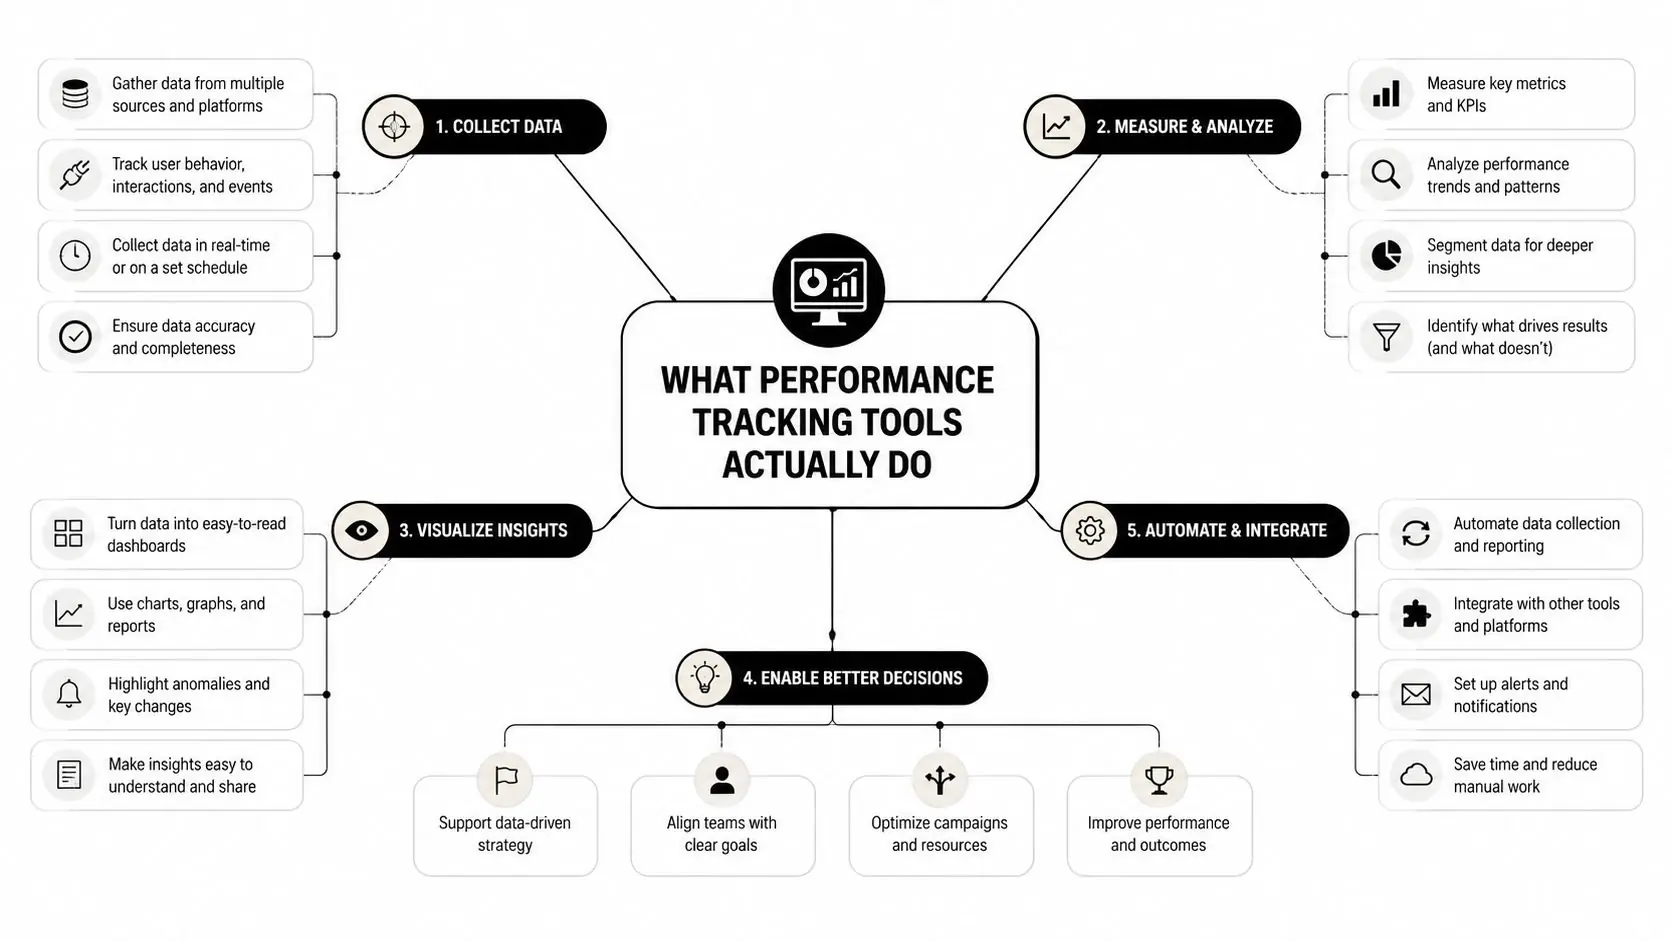
Think of a trading journal as a fitness tracker for decision-making. A fitness tracker records more than whether you reached a destination. It captures movement, timing, intensity, and patterns. Trading performance tracking tools work similarly. They record the entry, exit, position size, stop, market, session, setup, and emotional context behind each trade.
A profit-and-loss statement is still useful, but it's the least informative number by itself. A positive week might contain a revenge trade, an oversized loser that happened to recover, or a sequence of entries that violated your plan without causing an immediate breach. The account survived, but the process weakened.
ActivTrak describes productivity management tools as software that “collect and organize data about employee productivity” and distinguishes them from simple activity displays through its productivity management overview. The same principle applies to trading. Your journal should organize data so you can make better decisions, not merely confirm that you traded.
The four jobs that matter
Capture the trade and its context. Record broker data, screenshots, entry reasoning, setup tags, market conditions, and whether the trade followed your plan.
Calculate useful metrics. A capable system should calculate win rate, average win, average loss, expectancy, R-multiple, drawdown, and trade distribution without forcing you to rebuild formulas every week.
Flag account thresholds. Your tool should show your distance from the daily loss limit, maximum drawdown, and any other conditions affecting account eligibility or payout readiness.
Expose repeated behavior. Reports should answer questions such as whether you lose more during a particular session, abandon stops after entry, or perform differently with manual, algorithmic, and copy trades.
For a funded trader, the primary job is account protection. A dashboard that celebrates net profit while hiding open risk is incomplete. The best setup makes unsafe behavior visible before it becomes expensive.
Key Metrics That Reveal a Real Edge
Total profit can be distorted by account size, one exceptional trade, or a lucky market condition. You need several measurements that describe both return and the path taken to achieve it.
The metrics worth keeping
Drawdown measures the decline from an equity high to a later low. It tells you how much pain the strategy creates and how close your account came to a rule breach. On a funded account, current daily drawdown and maximum drawdown deserve attention before net profit.
Expectancy estimates the average result per trade:
Expectancy = (average win × win rate) − (average loss × loss rate)
Suppose a 50-trade sample produces $15,000 in profit but experiences a 9% maximum drawdown. If the average result works out to $340 per trade, expectancy gives you a more useful process measure than the headline profit. It asks whether the average attempt pays after both winners and losers, while drawdown tells you what the account had to endure to achieve it.
Sharpe ratio places return beside variability. A Sharpe ratio of 1.2 describes a cleaner risk-adjusted result than 0.4, even if the lower-ratio strategy shows a larger raw gain. You can review the calculation method in this Sharpe ratio calculation guide. Don't use Sharpe alone, because it can hide rule violations, skewed trade distributions, or an unsuitable time sample.
MFE and MAE describe what happened while a trade was open. Maximum favorable excursion shows the best unrealized gain. Maximum adverse excursion shows the worst unrealized loss. A winner that reaches 200 pips of favorable movement and gives back 150 pips tells you something important about exit management. The setup may need a trailing stop, partial profit plan, or a rule for protecting gains.
Trade distribution shows whether average results come from normal outcomes or rare outliers. Take 20 trades and remove the one winner above 4R. If the remaining trades are flat or negative, the median setup may not have a durable edge. If they remain profitable, the outlier added value but didn't create the entire system.
| Metric | Formula | What It Reveals | Common Trap It Catches |
|---|---|---|---|
| Drawdown | Peak equity minus trough equity | Account stress and recovery needs | Trading too large after a losing streak |
| Expectancy | Average win × win rate minus average loss × loss rate | Average value of each attempt | High win rate with oversized losses |
| Sharpe ratio | Risk-adjusted return relative to variability | Return quality and consistency | Chasing raw profit with unstable results |
| MFE and MAE | Best favorable and adverse movement during a trade | Entry quality and exit efficiency | Giving back gains or using stops that are too tight |
| Trade distribution | Results grouped by setup, session, and outcome size | Whether results depend on outliers | Mistaking one exceptional trade for an edge |
Track these metrics by instrument, setup, session, direction, and execution style. A strategy can have positive overall expectancy while losing money during a specific session or on a specific instrument. That distinction matters even more when a funded account has a fixed daily loss limit. A good average result doesn't excuse a trade that puts the account at risk.
Spreadsheets, TraderVue, Edgewonk, Myfxbook, and Python
You don't need an elaborate platform on day one. You need a record that captures every trade accurately and makes rule distance obvious. A Google Sheet can be better than an expensive journal if you update it after every position.
| Tool | Monthly cost | Broker auto-sync | Drawdown/MFE analytics | MFC compliance fit |
|---|---|---|---|---|
| Google Sheets | No software cost required | Manual unless connected through another service | Custom formulas and charts | Strong control, but alerts require your own setup |
| TraderVue | Verify current plan and pricing | Strong fit for supported futures workflows | Futures-focused analytics and review tools | Useful when imported data is accurate and limits are entered manually |
| Edgewonk | Verify current plan and pricing | Depends on supported import workflow | Deep behavioral tagging and journaling | Strong for identifying rule drift, with compliance fields configured by you |
| Myfxbook | Verify current plan and pricing | Forex-oriented automated imports | Account analysis and trade history views | Helpful for forex reconciliation, but verify funded-account compatibility |
| Python notebook | No software cost required beyond your environment | Requires API, export, or broker connection | Fully custom equity curves, drawdown, and grouping | Highest flexibility, but you must build and maintain every rule |
Google Sheets suits traders who want total control. Create fields for account equity, realized P&L, unrealized P&L, daily loss, maximum drawdown, risk per trade, setup, session, and rule status. Formulas can calculate most core metrics, while conditional formatting can turn the daily buffer red before you reach the limit.
TraderVue is a practical choice for traders who need futures-oriented analytics and a more finished review workflow. Edgewonk is particularly useful when the main weakness is behavioral, such as entering outside the plan or moving stops. Myfxbook fits forex traders who value automated trade imports and account reconciliation.
Python becomes worthwhile when you need custom logic. You can build an equity curve that includes open trades, classify results by strategy, or model how a trailing drawdown changes after a new equity high. That flexibility comes with maintenance. A broken import or incorrect timezone can produce a precise-looking but unreliable report.
Start with the simplest setup that answers your questions. Graduate only when a metric can't be computed reliably by hand.
Selection filter: Does the tool capture trades automatically, and does it flag a funded-account breach in real time? If the answer is no to both, keep looking.
Staying Compliant With MyFundedCapital Rules
A rulebook becomes useful only after you convert it into checks you perform before, during, and after a session. MyFundedCapital's challenge rules should be treated as operating constraints, not information you read once and then remember loosely.
For a $100,000 account, a 5% daily loss limit equals $5,000, while a 10% maximum drawdown represents $10,000 below the relevant starting or trailing equity reference. Your dashboard must show both realized and unrealized losses. A position that hasn't closed can still move the account toward a breach.
Use three daily checkpoints
Before the session, check starting equity, open positions, floating P&L, and remaining daily buffer. Set a hard personal stop at 3% intraday loss, well before the 5% firm limit. This isn't a guarantee against slippage or market movement, but it creates a decision point before the account reaches the official boundary.
During the session, record every entry, partial fill, scale-in, and exit. Watch total open risk rather than looking at each trade in isolation. If several correlated positions are open, their combined exposure can be much larger than the risk shown on an individual ticket.
After the session, close each journal entry, attach screenshots, confirm the daily result, update trailing drawdown, and flag any suspected rule issue. Don't wait for a weekly review to discover that an import omitted a partial exit or fee.
The same routine must account for consistency rules, minimum trading days, and payout timing. Payout cycles may run roughly 7 to 14 days, so a profitable balance doesn't automatically mean a payout is ready. Verify the exact account conditions before making withdrawal decisions.
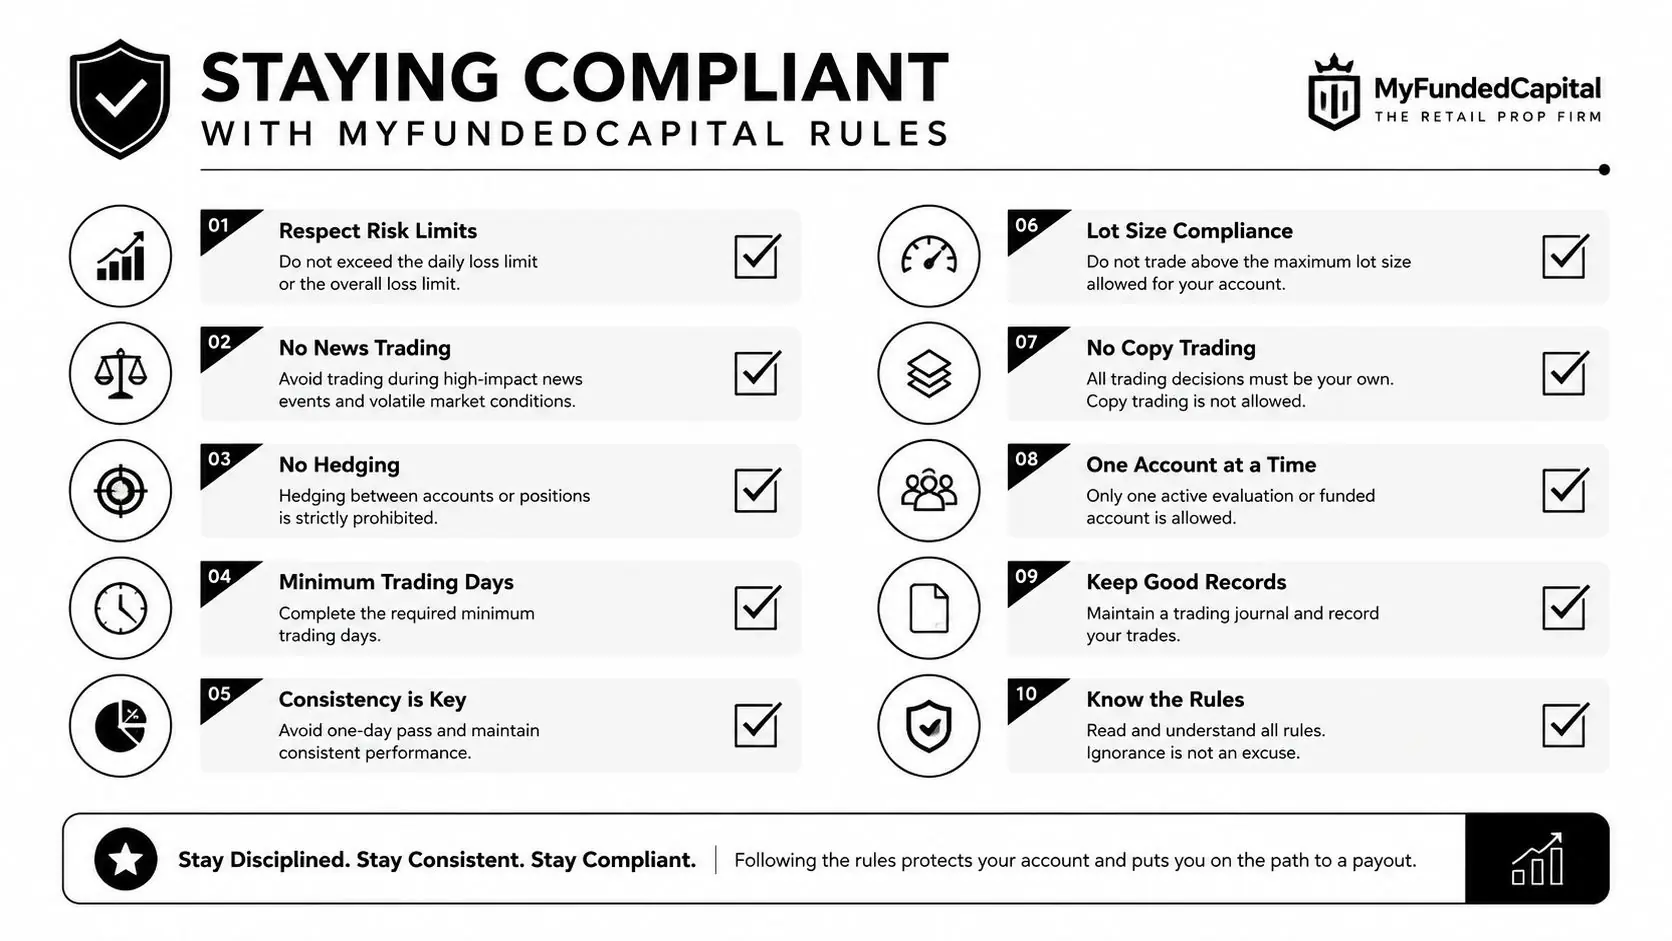
Your one-page compliance checklist
- Daily loss: Current realized plus unrealized loss versus the 5% limit.
- Personal stop: Session shutdown point at 3% intraday loss.
- Maximum drawdown: Current equity versus the 10% threshold.
- Open exposure: Combined risk across correlated trades.
- Trade days: Minimum trading-day progress.
- Consistency: Size, frequency, and result distribution against account conditions.
- Payout timing: Eligibility date and required buffer.
- Data quality: Broker import reconciled with platform history.
- News and weekend status: Confirm whether selected account options permit them.
- Rule status: Green, caution, or stop trading.
Building Your Weekly Review and Reporting Dashboard
A Sunday review should answer what changed, not merely display what happened. Keep the dashboard fixed so you don't move the goalposts after a difficult week. A useful layout has five panels: weekly net P&L, daily and trailing drawdown, win rate and average R-multiple, MFE/MAE, and trade distribution by session and setup.
| Panel | Metric shown | MFC rule it protects | Review frequency |
|---|---|---|---|
| Weekly result | Net P&L and average R | Profit and consistency awareness | Weekly |
| Risk status | Daily and trailing drawdown | 5% daily and 10% maximum limits | Daily and weekly |
| Execution quality | Win rate and average R | Position discipline | Weekly |
| Trade management | MFE and MAE | Stop and exit control | Weekly |
| Distribution | Results by setup and session | Strategy and behavior consistency | Weekly |
Ask the same questions every week:
- Am I closer to or further from a payout?
- Did any session approach the 5% daily loss line?
- Which setup produced the strongest expectancy per attempt?
- Did one trade or one session dominate the result?
- Did I alter size, stop placement, or trade frequency after a loss?
A well-designed trading journal should make those answers easy to retrieve. For dashboard design principles, the analytics dashboard guide 2026 is a useful reference because it emphasizes arranging information around decisions rather than decorating a screen with unrelated charts.
Use automation as an assistant
AI summaries can identify repeated phrases in your notes, cluster similar setups, and point out sessions with unusual drawdown. Predictive alerts can warn about a steep equity-curve decline or unusually fast drawdown. Those features are useful only when they expose the underlying trades.
Don't trust a model that gives you a conclusion without the source records. Check the raw fills, fees, timestamps, and account balance before changing a strategy. An automated summary can be wrong because the import is wrong.
A simple one-screen layout works well:
- Top row Equity, daily loss used, maximum drawdown, and payout status.
- Middle row Weekly P&L, average R, expectancy, and win rate.
- Bottom row MFE/MAE scatter, setup distribution, session distribution, and flagged rule events.
Getting Started and Next Steps With MFC
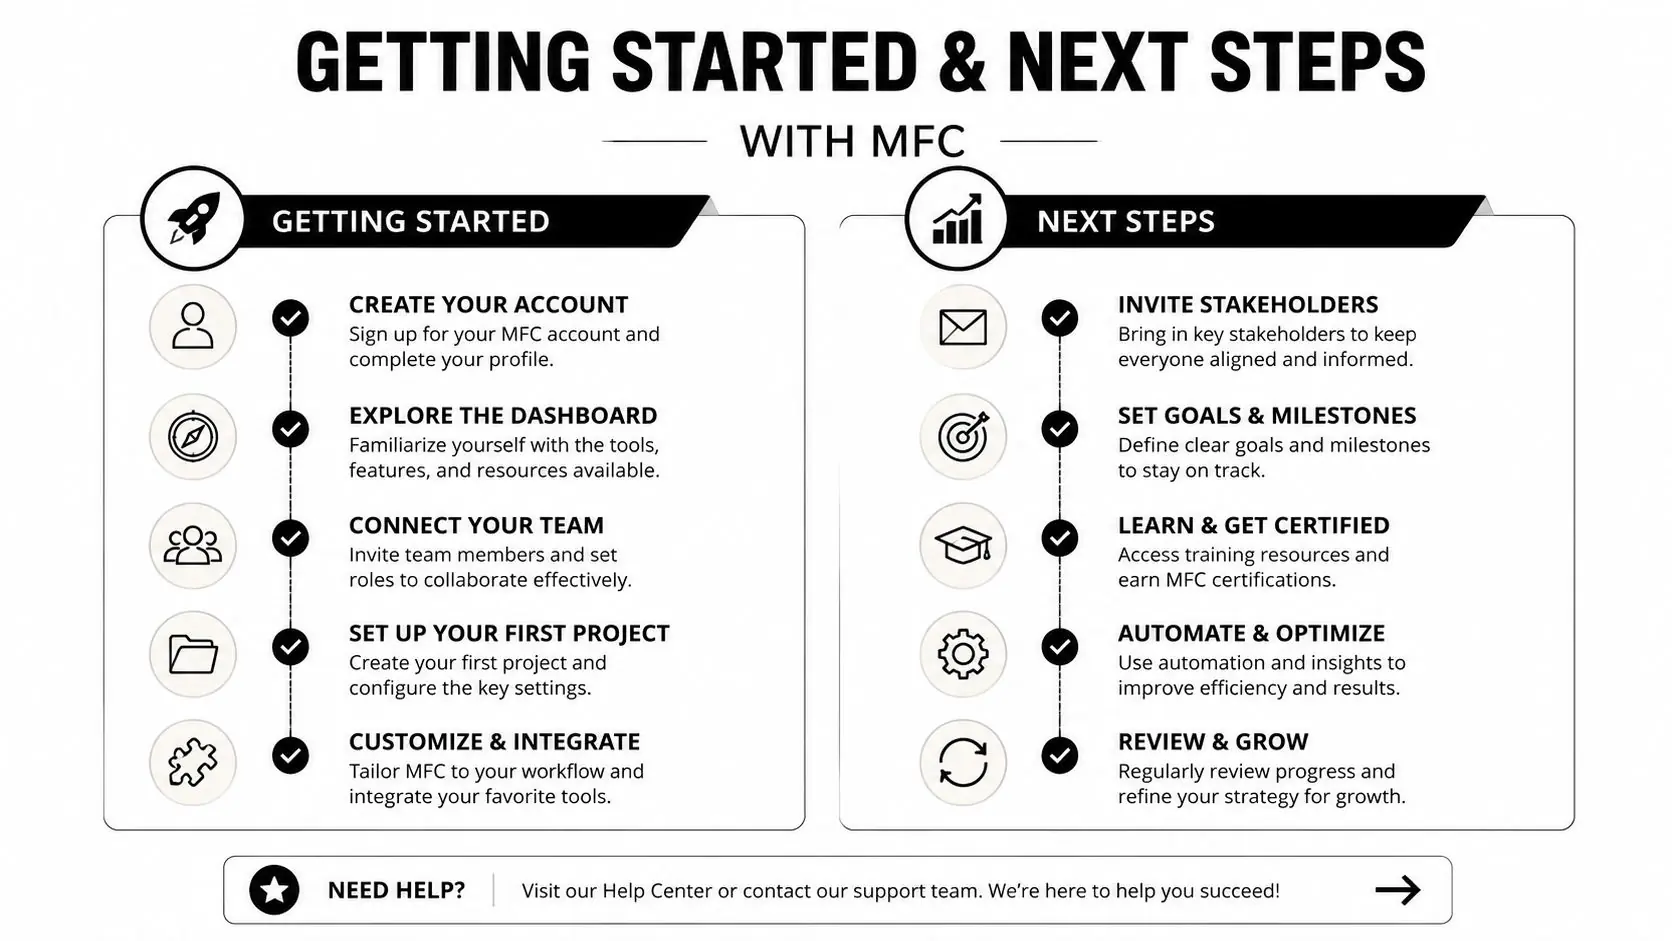
Build the system in stages. During the first 7 days, choose one journal and record every trade, including screenshots and rule status. During the next 30 days, connect broker imports, reconcile missing fills, and run a fixed weekly review. Over 90 days, compare setup expectancy, drawdown behavior, and trade distribution across a meaningful sample instead of reacting to one result.
A five-step setup checklist
Choose a primary journal. Use Sheets if you need control, Edgewonk if behavior is the main issue, Myfxbook for suitable forex imports, TraderVue for futures workflows, or Python when custom analysis justifies the extra work.
Connect your broker data. Confirm that entries, exits, partial fills, commissions, and timestamps arrive correctly. Never assume an automated import is accurate without reconciliation.
Create compliance fields. Add daily loss buffer, maximum drawdown distance, open exposure, minimum trading days, consistency status, and payout timing. Store the firm's exact rule interpretation beside each field.
Schedule the Sunday review. Keep the five dashboard panels fixed. Write one sentence about the strongest process decision and one about the most dangerous mistake.
Paper-test the workflow. Run the dashboard against one challenge-style account before relying on it during live decision-making. Test losing streaks, open positions, partial exits, and a new equity high that changes trailing drawdown.
The market is moving toward automated summaries and predictive alerts, but trust still depends on verified broker data, exportability, and an audit trail. That matters when one missing fee or misclassified trade changes your view of whether a strategy should scale.
Frequently asked questions
How much buffer should I leave below the daily loss limit?
Use a personal stop below the firm's official limit. A 3% intraday stop provides a decision buffer before the 5% daily loss limit, but it doesn't remove market risk or guarantee protection during fast movement. Include unrealized losses and correlated positions in the calculation.
Do weekend holding and news trading require separate checks?
Yes. Log whether your account permits weekend holding or news trading, then verify the setting before opening the position. Don't rely on a generic journal label. Confirm the selected account's conditions and record the event in your trade notes.
How should I track payout timing and consistency?
Record the account plan, eligible payout date, required trading conditions, and current profit distribution. Payout availability can follow 7-day or 14-day cycles, depending on the applicable arrangement. Confirm the current terms rather than assuming every account follows the same schedule.
Which metrics should support review?
Keep daily and maximum drawdown, expectancy, average R, win rate, MFE, MAE, trade distribution, open exposure, and rule-event logs. Support teams may need platform records and account details to investigate an issue, so preserve the raw trade history instead of sending only a screenshot of a summary chart.
Trading involves risk of loss, and no performance tracking tool can turn an unprofitable strategy into a profitable one. The tool's value is narrower and more practical. It helps you see risk, test your assumptions, and stop avoidable behavior before it threatens a funded-style account.
MyFundedCapital offers Instant Funding and 1-Step or 2-Step Challenge programs with account sizes from $5K to $100K, plus scaling paths up to $500K, across manual, algorithmic, and copy trading workflows. Visit MyFundedCapital to compare account conditions, review the applicable rules, and apply this tracking system from your first recorded trade.