You're probably looking at a decent run of trades, a green equity curve, and a dashboard that says things are working. The problem is that funded evaluations don't care much about a few good days if the path to those gains is unstable. Sharpe ratio calculation helps you separate actual trading quality from noisy P&L.
For active traders, that matters because a strategy can look profitable and still be one drawdown spike away from violating challenge rules. Used properly, Sharpe gives you a clean way to judge whether returns came from repeatable execution or from taking more volatility than you realized. Trading involves risk of loss, and this article is educational only, not financial advice.
What the Sharpe Ratio Really Tells You
A profitable month doesn't automatically mean you traded well. Sometimes the market handed you a clean trend, spreads behaved, and a few oversized winners covered sloppy risk control. Sometimes you were one bad session away from wiping out the whole run.
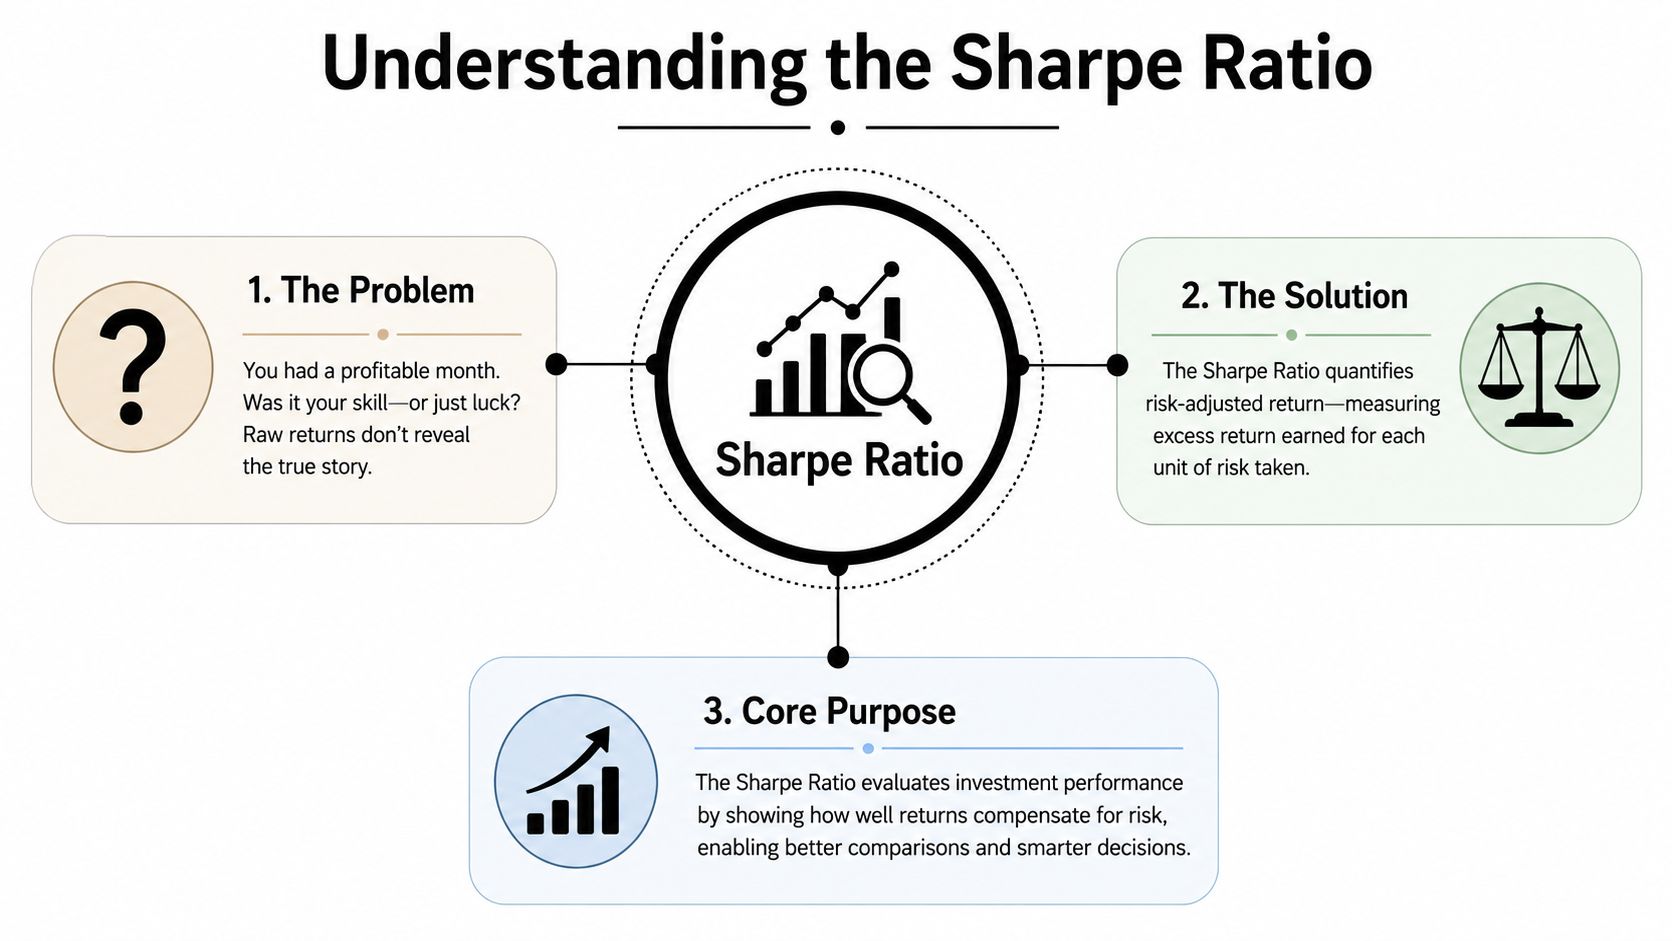
That's why the Sharpe ratio matters. It asks a harder question than “Did you make money?” It asks, “How much return did you earn for the amount of volatility you took?”
Why raw profit is a weak scorecard
Two traders can finish the week with the same profit.
- Trader A gets there with small, repeatable daily gains and controlled pullbacks.
- Trader B gets there with a flat week plus one oversized win after several ugly swings.
The P&L says they're equal. A proper Sharpe ratio calculation usually says they're not.
That's the practical value of Sharpe. It standardizes performance so you can compare:
- One strategy vs another
- One month vs another
- Your manual trading vs your EA
- Your current process vs your old process
If you want a simple glossary-style refresher before digging into application, Finzer's explanation of what is Sharpe Ratio is a useful starting point.
What Sharpe is really measuring
In plain English, Sharpe is a risk-adjusted return score. Higher is better, but only if the calculation is clean and the return stream is honest.
It's also closely related to statistical significance. William F. Sharpe notes that the historic Sharpe ratio is mathematically close to a t-statistic, which is another way of saying it helps measure whether the average differential return looks meaningful rather than random noise, especially when calculated from differential returns rather than raw returns, as shown in his original discussion at Stanford.
Practical rule: If your strategy review starts and ends with net profit, you're missing the part that usually determines whether a trader survives prop-style risk limits.
How active traders should use it
For an active trader, Sharpe isn't a trophy metric. It's a diagnostic tool.
Use it to answer questions like:
- Is this setup stable?
- Did reducing size improve consistency or just slow growth?
- Is my scalping system still efficient after costs and slippage?
- Does my copy strategy produce smooth returns, or just occasional spikes?
The textbook view treats Sharpe as a portfolio statistic. A practical trader's view is simpler. It tells you whether your edge is arriving in a form you can hold onto.
That distinction becomes critical once challenge rules, daily loss caps, and forced discipline enter the picture.
The Core Sharpe Ratio Calculation and Formula
A trader finishes a strong week, sees solid profit, and assumes the system is ready for a prop challenge. Then one rough session wipes out two days of gains and puts the account near the daily loss limit. That is why the Sharpe ratio matters. It checks whether your returns are arriving with enough consistency to survive real risk rules.
Sharpe Ratio = (Portfolio Return − Risk-Free Rate) / Standard Deviation
The formula is straightforward. The hard part is using inputs that match how you trade in practice.
The version active traders should calculate
For strategy review, use the ex post Sharpe ratio. That means you calculate it from historical returns you already earned, usually from daily performance data. In practice, take the average of your daily returns, subtract the daily risk-free rate, and divide by the standard deviation of those daily returns.
That gives you a usable measure of return per unit of volatility. For a prop trader, that matters more than a pretty equity curve screenshot.
A challenge account can fail even with positive expectancy if the return path is too erratic.
Break the formula into the parts that matter
Portfolio return
Use your actual strategy return series. For most traders, that means daily percentage returns based on closed performance, not raw account balance changes and not dollar P&L by itself.
That distinction matters. A $500 gain means one thing on a $10,000 account and another on a $100,000 account. Percentage returns keep the series comparable across time and position size changes.
If your records are messy, clean them before you calculate anything. This guide on how to calculate profit and loss is a good starting point for standardizing the return side.
Risk-free rate
The risk-free rate is the return from a low-risk alternative, usually represented by short-term government yields. On daily trading data, its effect is often small, but small does not mean irrelevant.
Use the rate that matches your sampling period. Daily returns require a daily risk-free rate. Mixing annual yields with daily returns is one of the fastest ways to produce a Sharpe number that looks precise and means very little.
Standard deviation
Standard deviation measures how uneven your return stream is around its average. If two traders make the same average return, the one with the smoother path gets the higher Sharpe.
That matters in prop trading because volatile return streams tend to collide with drawdown caps, trailing limits, and psychological mistakes. A strategy can have edge and still be unusable if the path to that edge is too rough.
If you want a stronger handle on return-series behavior before calculating performance metrics, this practical guide to time series analysis covers the basics well.
A high Sharpe does not mean maximum profit. It means the strategy is producing profit with a level of variability that is easier to hold, size, and repeat.
A clean calculation workflow
Use a process that stays consistent from one review period to the next:
- Export your daily closed returns from your broker, platform, or journal.
- Convert them into percentage returns.
- Subtract the daily risk-free rate if you are using a non-zero figure.
- Calculate the average daily excess return.
- Calculate the standard deviation of the daily return series.
- Divide average excess return by that standard deviation.
That is the calculation.
The common mistakes are operational, not mathematical. Traders mix floating and realized P&L, omit flat days, change position sizing halfway through the sample, or use payout-adjusted numbers that do not reflect actual account volatility. In a prop setting, those errors can make a strategy look stable on paper even though it is one bad day away from violating the rules.
Annualizing Your Sharpe Ratio Correctly
Many traders often wreck an otherwise decent analysis. They calculate a daily Sharpe, then annualize it the wrong way and build confidence around a number that doesn't mean what they think it means.

The right method and the common mistake
A critical technical pitfall is the improper annualization of daily returns. The correct method requires multiplying the periodic Sharpe ratio by the square root of the number of periods, such as √252 for daily trading data, and omitting this square root adjustment can inflate the perceived success of a strategy by up to 40% in high-frequency environments.
The correct daily framework is:
- Calculate daily mean return
- Calculate daily standard deviation
- Use a dailyized risk-free rate
- Compute the daily Sharpe
- Multiply by √252
The proper form is:
Sharpe = (Rp_daily – Rf_daily) / σ_daily × √252
If you use 365 for equity market annualization, or skip the square root adjustment, you distort the result. In a rule-based evaluation environment, that distortion can make a weak system look challenge-ready when it isn't.
Why this matters more under prop-style risk rules
Under hard daily loss caps, traders don't have much room for optimistic math. If your Sharpe is overstated, you may think the strategy is safe enough to scale. Then one rough session hits, and the drawdown profile you underestimated becomes the true issue.
The verified data is blunt on this point. In high-frequency trading environments, bad annualization can skew success-rate interpretations by up to 40%. It also notes that even a 0.1 deviation in the annualization factor can shift a strategy from “pass” to “fail” status in live simulations.
That's not a rounding error. That's a practical failure.
A better way to think about annualization
Treat annualization as a translation step, not a decoration. You're converting a period-based statistic into a yearly one so different systems can be compared on equal footing.
A short checklist helps:
- Use daily returns with √252: That's the standard trading-day adjustment for daily data.
- Dailyize the risk-free rate: If you start with an annual rate like 3%, the verified data states it should become 0.03/252 for consistency.
- Filter your data properly: If your strategy doesn't trade weekends, don't let weekend gaps muddy the series.
- Keep the period definitions fixed: Don't compare a weekly Sharpe from one system with a daily Sharpe from another unless both are annualized correctly.
If you work with return streams regularly, a practical guide to time series analysis is useful for thinking through missing data, periodicity, and structural breaks before you trust any metric.
For traders who like to align their monthly review process with actual trading calendars, it also helps to know how many trading days are in a month before you start comparing one month's Sharpe to another.
Sharpe Calculation in Excel and Python
A clean Sharpe calculation should take a few minutes, not half a day. If it takes longer, the problem is usually the return series, not the math.
For prop traders, that distinction matters. A neat spreadsheet can still hide the mistake that blows a challenge account, such as mixing realized P&L with open equity swings, skipping flat days, or calculating returns from trade outcomes instead of account-level daily performance. Sharpe is only as useful as the series you feed into it.
Excel setup that works
Excel is enough for a serious review if the sheet is built correctly. Keep the workflow simple and auditable so you can spot bad inputs fast.
A practical layout looks like this:
| Column | What goes there |
|---|---|
| A | Date |
| B | Account daily return |
| C | Excess return after subtracting daily risk-free rate |
| D | Notes on news filters, reduced size, platform issues, or rule changes |
Then use:
- Mean excess return:
=AVERAGE(C2:C61) - Standard deviation:
=STDEV(C2:C61) - Periodic Sharpe:
=AVERAGE(C2:C61)/STDEV(C2:C61)
For daily data, annualize with:
- Annualized Sharpe:
=(AVERAGE(C2:C61)/STDEV(C2:C61))*SQRT(252)
One practical adjustment for prop evaluations: calculate from daily account returns, not individual trade returns. Trade-by-trade Sharpe can look cleaner than the account performed, especially if you scale in, hold correlated positions, or let one bad session dominate the week. Prop firms judge the account path.
Python version for a cleaner workflow
Python is the better choice when you review multiple systems, rerun the same checks each week, or want to test small rule changes without rewriting formulas.
import pandas as pd
import numpy as np

df = pd.read_csv("daily_returns.csv")

# expected column: daily_return as decimal, e.g. 0.01 for 1%
rf_daily = 0.0

excess_returns = df["daily_return"] - rf_daily
mean_excess = excess_returns.mean()
std_excess = excess_returns.std(ddof=1)

sharpe_daily = mean_excess / std_excess
sharpe_annual = sharpe_daily * np.sqrt(252)

print("Daily Sharpe:", sharpe_daily)
print("Annualized Sharpe:", sharpe_annual)
That script is fine for a first pass. Keep the input file clean. Do not mix deposits, payouts, resets, or balance corrections into the return column, and do not drop zero-return days just because you did not trade. In a prop context, inactivity is part of the equity curve too.
I also add a quick sanity check before trusting any output. If the standard deviation is tiny because the sample is short or the strategy barely traded, the Sharpe can look impressive for the wrong reason. That kind of false confidence gets traders over-sized right before a drawdown cap matters.
Tooling that helps without getting in the way
Use tools that make review easier, not tools that hide your assumptions.
A good minimum stack is:
- Excel or Google Sheets for manual inspection
- Pandas and NumPy for repeatable calculations
- Platform or journal exports for raw daily P&L data
- A notes field for changes in sizing, session filters, or market regime
If you want to speed up repetitive spreadsheet work, these spreadsheet AI automation tools can help with cleanup and formatting. They are useful for organization. They do not validate whether your Sharpe reflects tradable performance under prop firm rules.
Boring process wins here. Use one return definition, one review cadence, and one calculation method across every strategy. That consistency makes the metric useful enough to compare setups, cut weak ones, and avoid the polished but misleading stats that fail under live drawdown pressure.
Interpreting Your Sharpe Ratio Like a Prop Trader
A Sharpe ratio only becomes useful when you attach judgment to it. Traders love collecting performance numbers. Fewer traders know how to read those numbers in the context that matters.
For a prop trader, the key context is simple. Can this strategy stay inside risk rules long enough to finish the evaluation and keep trading afterward?
The benchmark ranges
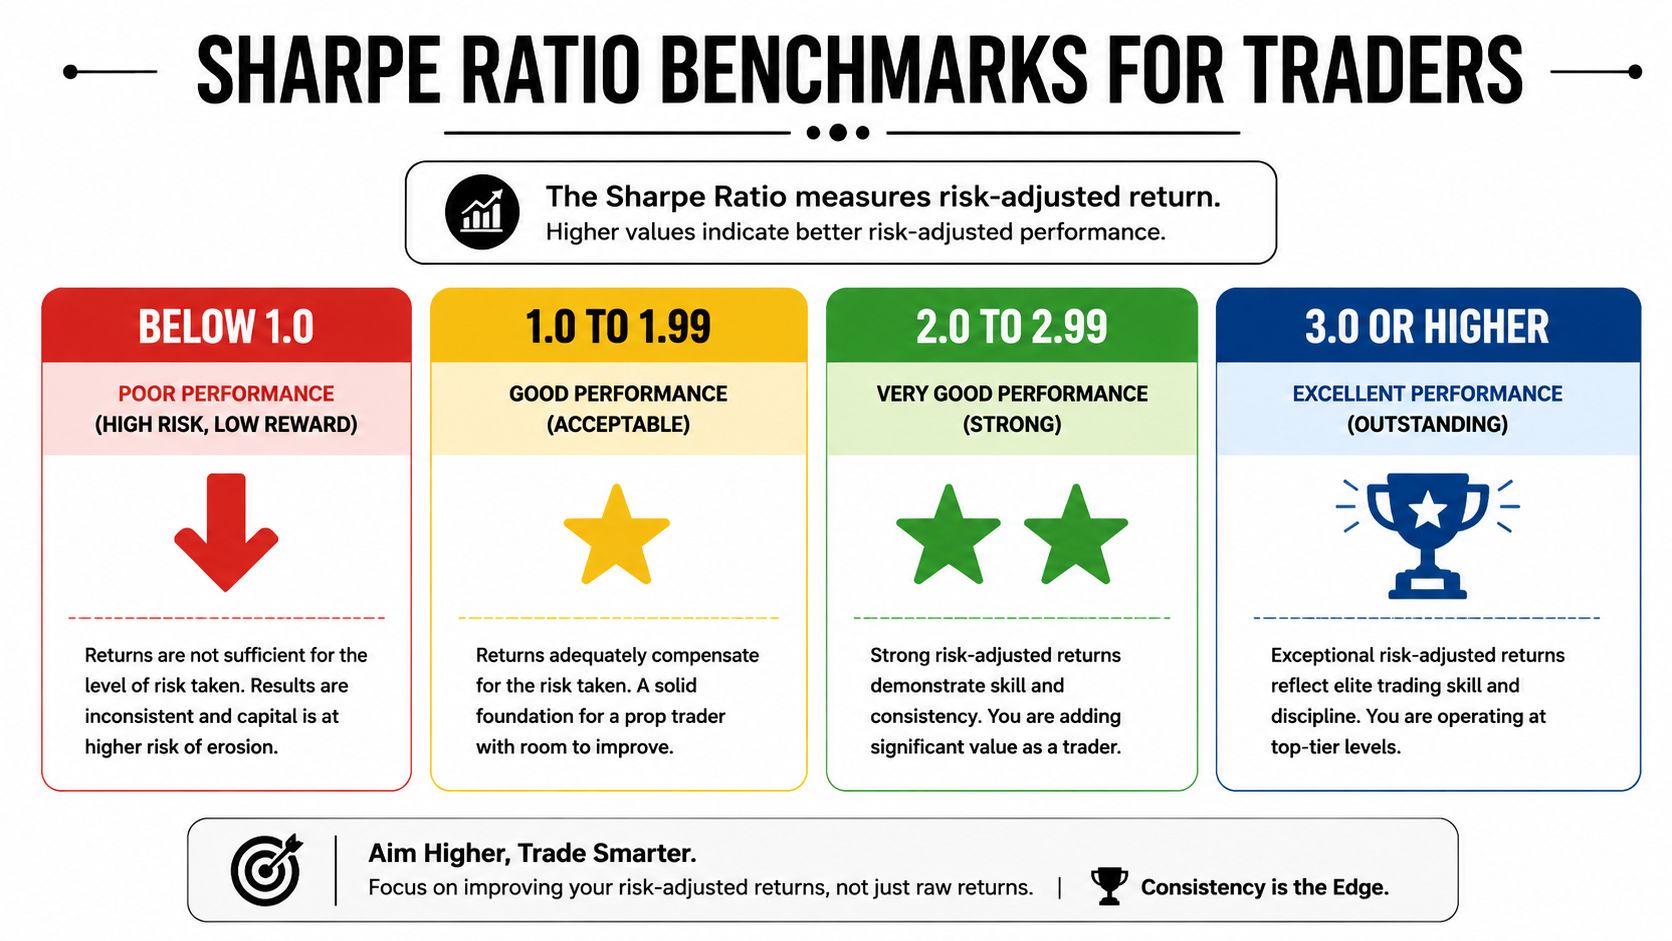
The interpretation of a positive Sharpe ratio uses specific thresholds: 1.00 to 1.99 is considered good, 2.0 to 2.99 is very good, and 3.0 or higher is outstanding, according to Charles Schwab's overview of how to calculate Sharpe ratio.
Here's the practical translation:
| Sharpe ratio | Plain-English read |
|---|---|
| Below 1.0 | Weak efficiency. Too much volatility for the return produced. |
| 1.0 to 1.99 | Good. Often workable if the drawdown behavior is controlled. |
| 2.0 to 2.99 | Very good. Strong risk-adjusted performance. |
| 3.0 or higher | Outstanding on paper, but worth stress-testing for overfitting or unusual market conditions. |
That last point matters. A very high Sharpe doesn't always mean the system is reliable. Sometimes it means the sample is short, the market was unusually favorable, or the strategy is suppressing visible risk while carrying tail risk.
What prop traders should care about more than the label
In active trading, I'd rather see a stable, believable Sharpe than a flashy one. A smooth 1-point-something with disciplined risk is often more useful than a headline number that came from a few outlier days.
That's because evaluation rules punish instability faster than they reward brilliance.
A challenge account usually tests:
- Consistency of returns
- Control of downside
- Ability to avoid daily loss breaches
- Capacity to keep trading after a bad day
A Sharpe ratio in the “good” or “very good” range can support that. But only if the return stream is earned in a way that fits the firm's rules. If the strategy relies on sporadic size expansion, event spikes, or recovery trades after losses, the Sharpe may flatter behavior that won't survive the environment.
A strategy doesn't pass because it looks smart in a spreadsheet. It passes because the trader can repeat it without crossing a hard line.
Read Sharpe alongside your trade behavior
Use the number as a filter, then check the behavior behind it.
Ask these questions:
- Are your gains clustered in a few days?
- Did one oversized trade rescue the month?
- Do you lose control after a red session?
- Is the strategy still stable after costs, pauses, and execution friction?
If the answer to those questions is ugly, the Sharpe ratio won't save you. It may even hide the problem if you read it lazily.
For challenge trading, the best use of Sharpe is not bragging rights. It's verifying that your returns are arriving in a pattern you can survive.
Limitations Pitfalls and Better Alternatives for Traders
A trader can post a respectable Sharpe ratio and still fail a prop challenge in a week.
That happens when the number looks clean but the equity curve is not. Sharpe smooths your results into a single score. Prop firms judge the path you took to get there. If that path includes sharp equity dips, recovery sizing after losses, or returns concentrated in a few outsized sessions, Sharpe will miss the part that gets accounts breached.
Where Sharpe breaks down
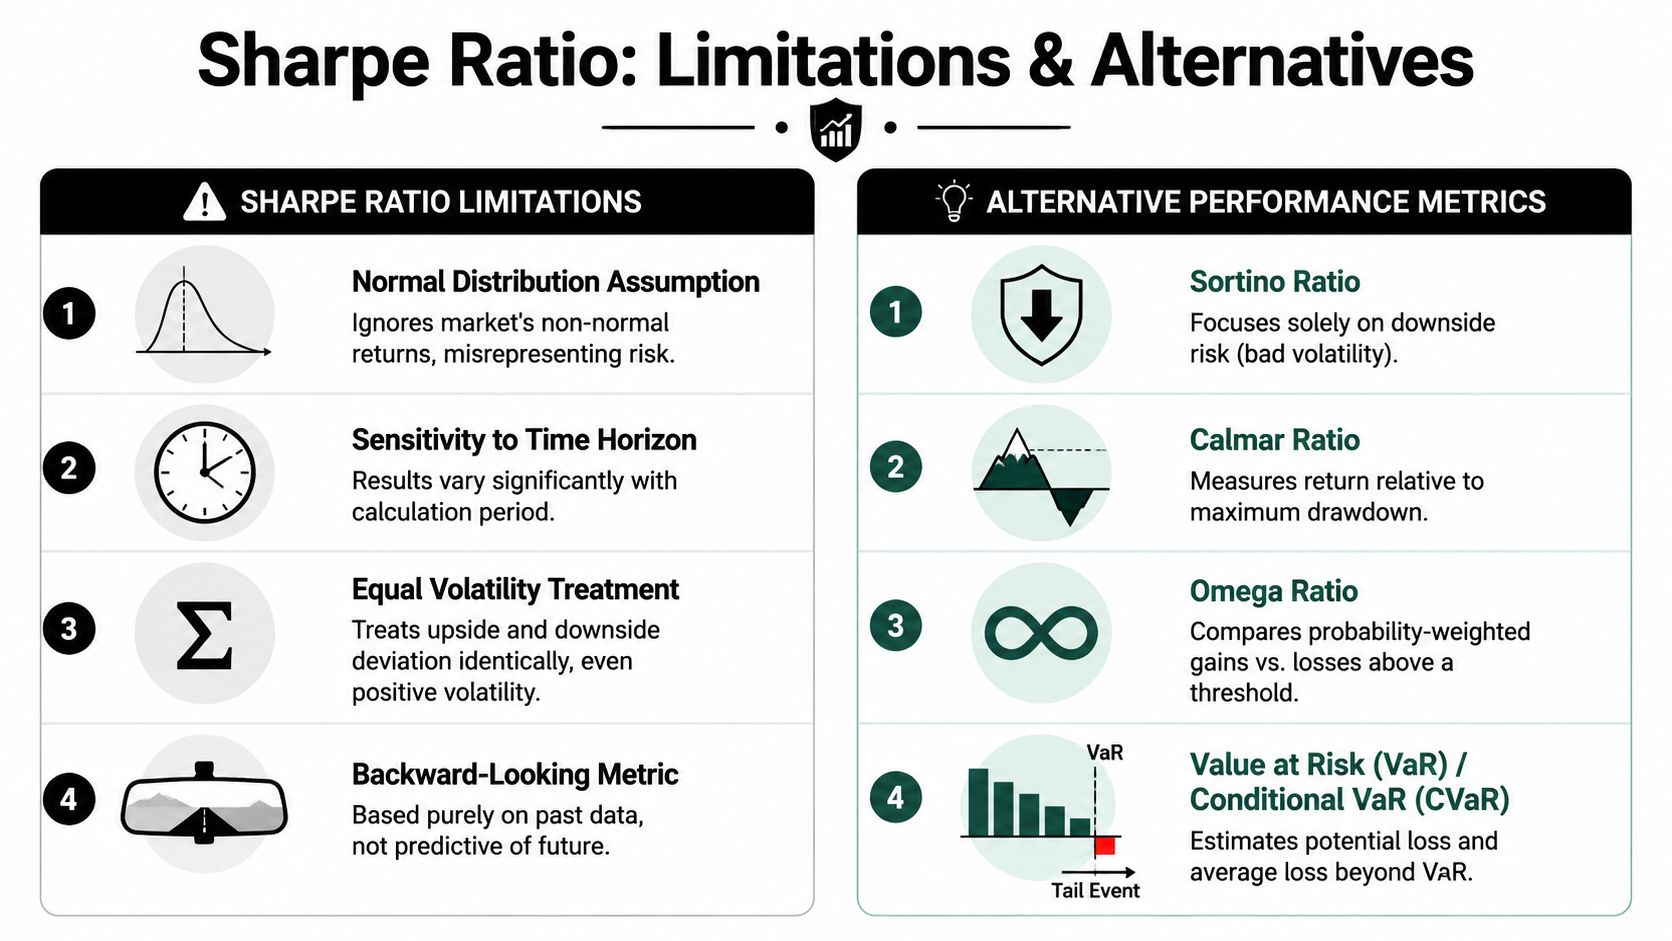
Sharpe assumes volatility is a workable stand-in for risk. For active traders, that shortcut often fails.
A strategy with uneven returns can still print a strong Sharpe while carrying ugly downside traits. Negative skew, fat tails, event risk, grid logic, martingale sizing, and delayed stop execution all create damage that standard deviation does not describe well. In plain English, the ratio can reward smooth-looking periods and understate how bad the bad days can get.
That matters more in prop trading than in long-only investing. A portfolio manager may survive a rough month and recover later. A challenge account often has hard daily and overall loss limits. One tail event can end the evaluation before the average return profile has any chance to matter.
Why prop firm rules distort the picture
Textbook Sharpe was built for comparing return streams, not for accounts with artificial stop points.
Prop rules change trader behavior in ways the ratio does not capture cleanly:
- Daily loss caps force you out before the strategy can revert
- Static or trailing drawdown limits punish path risk, not just total volatility
- News restrictions and no-trade windows interrupt otherwise consistent systems
- Holding restrictions can remove the exact trades that stabilize a strategy over time
A trader who understands this stops asking, “Is my Sharpe good?” and starts asking, “Can this return pattern survive the rule set?”
If drawdown is the line you cannot cross, study how maximum drawdown affects trading survival alongside Sharpe. That metric maps much more directly to how prop firms pass or fail traders.
Better alternatives for active traders
Sortino ratio
Sortino uses downside deviation instead of total volatility. That makes it more useful for traders whose upside swings are not the problem.
If your system has strong winners and controlled losses, Sharpe can penalize the good volatility along with the bad. Sortino separates those two. For intraday and swing traders working under loss caps, that usually matches the actual job better.
Use Sortino when:
- Your winners are larger than your losers
- Your return distribution is asymmetric
- You care about downside control more than smoothness in both directions
Calmar ratio
Calmar compares return to maximum drawdown. For prop traders, that is often closer to the actual test.
A strategy that earns less but keeps drawdown tight will usually be easier to repeat inside challenge rules than a higher-return system with deeper equity pullbacks. Calmar makes that trade-off visible fast.
Use Calmar when:
- Your main objective is staying inside hard drawdown limits
- You want to compare return against worst peak-to-trough pain
- Your strategy goes through occasional equity air pockets
A practical review stack
Use Sharpe as one input, not the verdict.
For active traders, the better process is to review four numbers together:
- Sharpe ratio, return efficiency relative to total volatility
- Sortino ratio, return efficiency relative to downside volatility
- Calmar ratio, return relative to maximum drawdown
- Maximum drawdown, the actual damage your strategy must survive
That stack gives a trader a clearer read on whether a system is statistically attractive, operationally stable, and realistic under prop firm rules. A spreadsheet can call a strategy efficient. Only a drawdown-aware review tells you whether you can trade it without getting removed from the account.
Frequently Asked Questions and Your Next Step
What's a good Sharpe ratio for passing a prop challenge
A trader finishes a challenge with a clean-looking Sharpe, then fails anyway because one oversized day clips the drawdown rule. That happens more often than new traders expect.
A good Sharpe for prop trading is one that comes from repeatable execution, controlled sizing, and equity swings you can survive under the firm's rules. Standard grading bands can give you a rough reference point, but they do not tell you whether the path of returns was challenge-safe. A lower Sharpe with tight daily risk control is often more useful than a higher Sharpe built on aggressive sizing or a few outsized winners.
If the number looks strong, ask one harder question. Could you trade the same way again without touching the daily or trailing loss limit?
Does Sharpe ratio account for drawdown rules
Sharpe does a poor job of capturing hard rule-based constraints such as daily loss caps, trailing drawdowns, or consistency requirements. Two strategies can post similar Sharpe ratios while carrying very different odds of violating a prop firm's rules.
That is why I treat Sharpe as a secondary read in evaluations. The primary question is whether the strategy stays inside the account rules while still producing enough return to pass. Read Sharpe next to Sortino, Calmar, and maximum drawdown, then look at the actual equity curve day by day.
Is Sharpe ratio useful for crypto or forex trading
Yes, with caution.
Crypto and forex returns often come with sharp reversals, clustered volatility, and occasional tail events that standard deviation does not describe well. A strategy can post a respectable Sharpe while still carrying ugly downside behavior during news, weekend gaps, or liquidity holes.
Use Sharpe as an efficiency check, not a safety stamp. For these markets, review downside deviation, maximum drawdown, and trade-by-trade risk concentration before trusting the number.
Should I use daily or monthly data
For active traders, daily data is usually the better choice because prop firms monitor risk daily and your mistakes show up there first. Monthly data can smooth out the exact instability that gets traders disqualified.
Keep the inputs consistent. If you calculate Sharpe from daily returns, use a matching daily risk-free rate and annualize from that same return series.
Trading involves substantial risk of loss. Performance metrics help you review process quality, but they do not protect you from execution mistakes, regime shifts, or poor discipline. This content is educational only and not financial advice.
If you want to apply this in an actual evaluation, explore the funding options at MyFundedCapital. Review the account types, compare the challenge rules, and pick a setup that matches how you trade, whether that means manual execution, EAs, or a faster funding route.