Most fundamental analysis advice was written for equity investors who can wait for valuation to converge. That framework breaks down for FX and CFD prop traders, where policy expectations, macro surprises, positioning, and execution often move price before a textbook valuation model catches up. This guide shows how to turn the fundamental analysis approach into a practical trading process, then combine it with technical timing, quantitative confirmation, and strict risk control.
What a Fundamental Analysis Approach Really Means for FX and CFD Traders
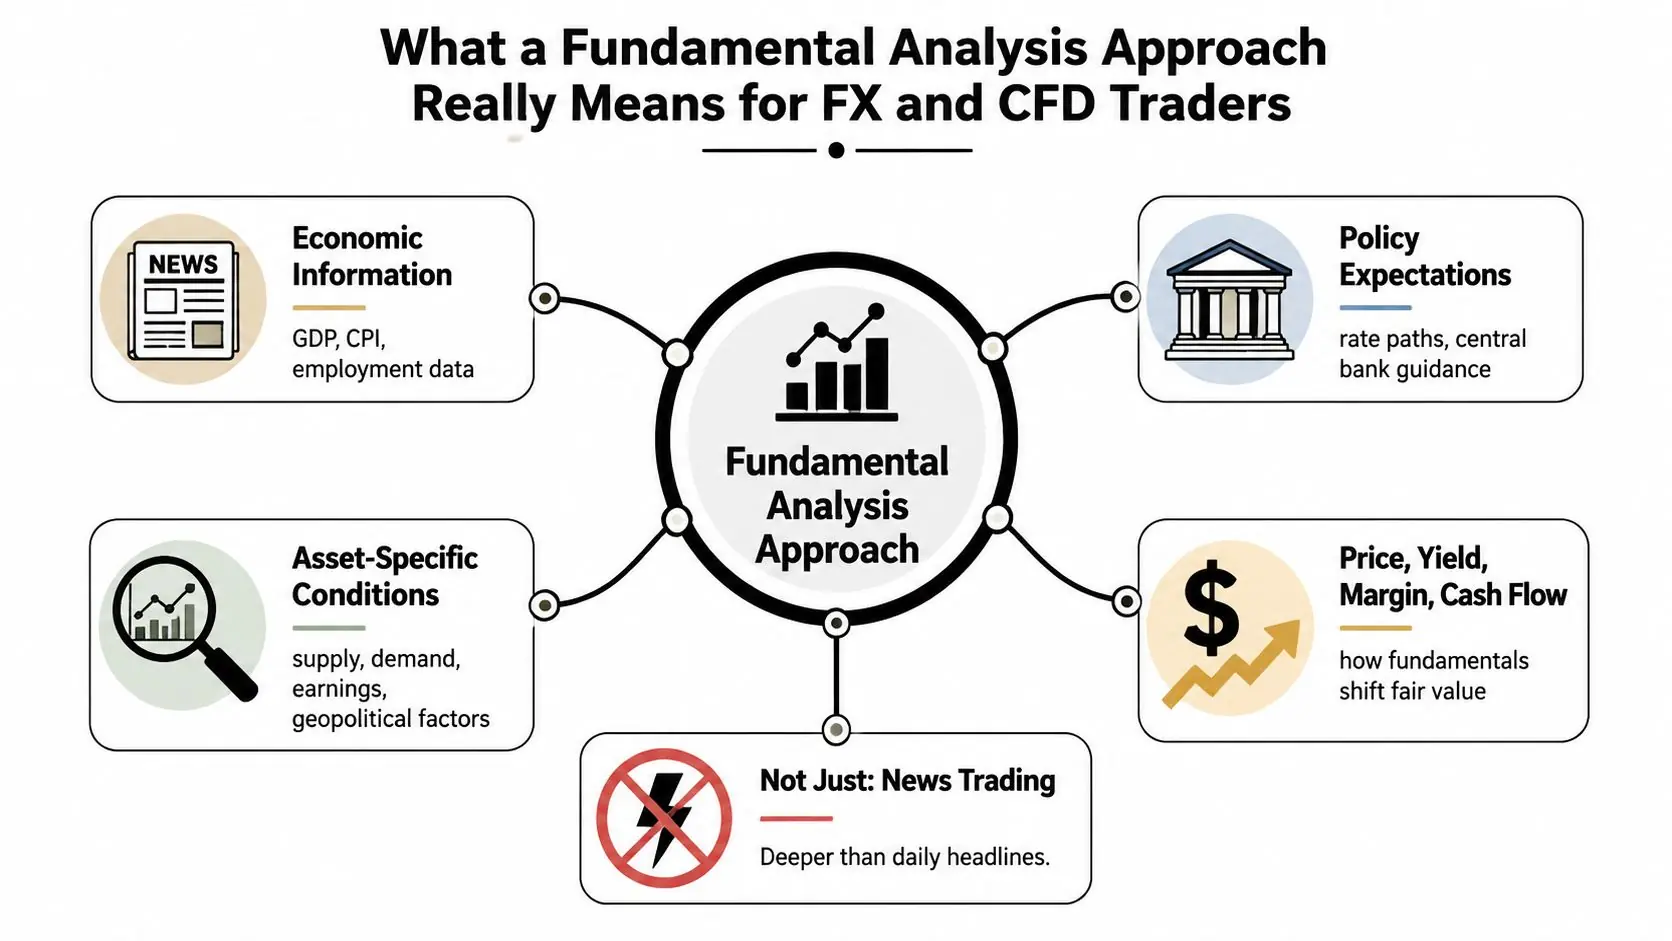
A fundamental analysis approach estimates how economic information, policy expectations, and asset-specific conditions should change relative prices, yields, margins, or cash flows. It isn't a hunt for an “overvalued” currency or a cheap CFD. The useful question is more specific: what has the market already priced, what variable can change, and how will that change travel through the instrument?
A workable process starts with four questions:
- Market price What growth, inflation, policy path, or earnings outcome is already embedded?
- Transmission mechanism Will the information affect yields, currency demand, margins, inventories, or risk appetite?
- Time horizon Should the effect last minutes, sessions, weeks, or quarters?
- Catalyst What event can force traders to revise their assumptions?
For FX, compare relative rate expectations, inflation persistence, growth surprises, labor conditions, and external balances. For CFDs, add earnings revisions, inventory cycles, input costs, sector demand, and supply constraints. Major economic indicators such as GDP, inflation, and employment are standard inputs because they can influence market direction and asset pricing at the macro level, as outlined in this overview of how economic data moves markets.
Why the textbook version fails in live trading
A currency can look expensive on purchasing-power grounds and still rise because its central bank is expected to keep policy tighter. An index CFD can look expensive on a price-to-earnings basis while continuing higher because earnings revisions are improving and investors are willing to pay for durable growth. Static valuation describes a condition. Repricing comes from change.
A 2026 scenario makes the distinction practical. Suppose inflation reaccelerates, a central bank signals that rate cuts may be delayed, and bond yields rise. The currency may strengthen before the next official growth report because traders are repricing the policy path. If your prop account has daily loss limits, waiting for the full valuation thesis to play out can be as dangerous as taking a trade without a thesis.
Practical rule: Fundamentals establish the directional regime. Liquidity, positioning, technical structure, and execution determine whether you can express that view without damaging your risk record.
The Three Layers of a Top-Down Fundamental Analysis Approach
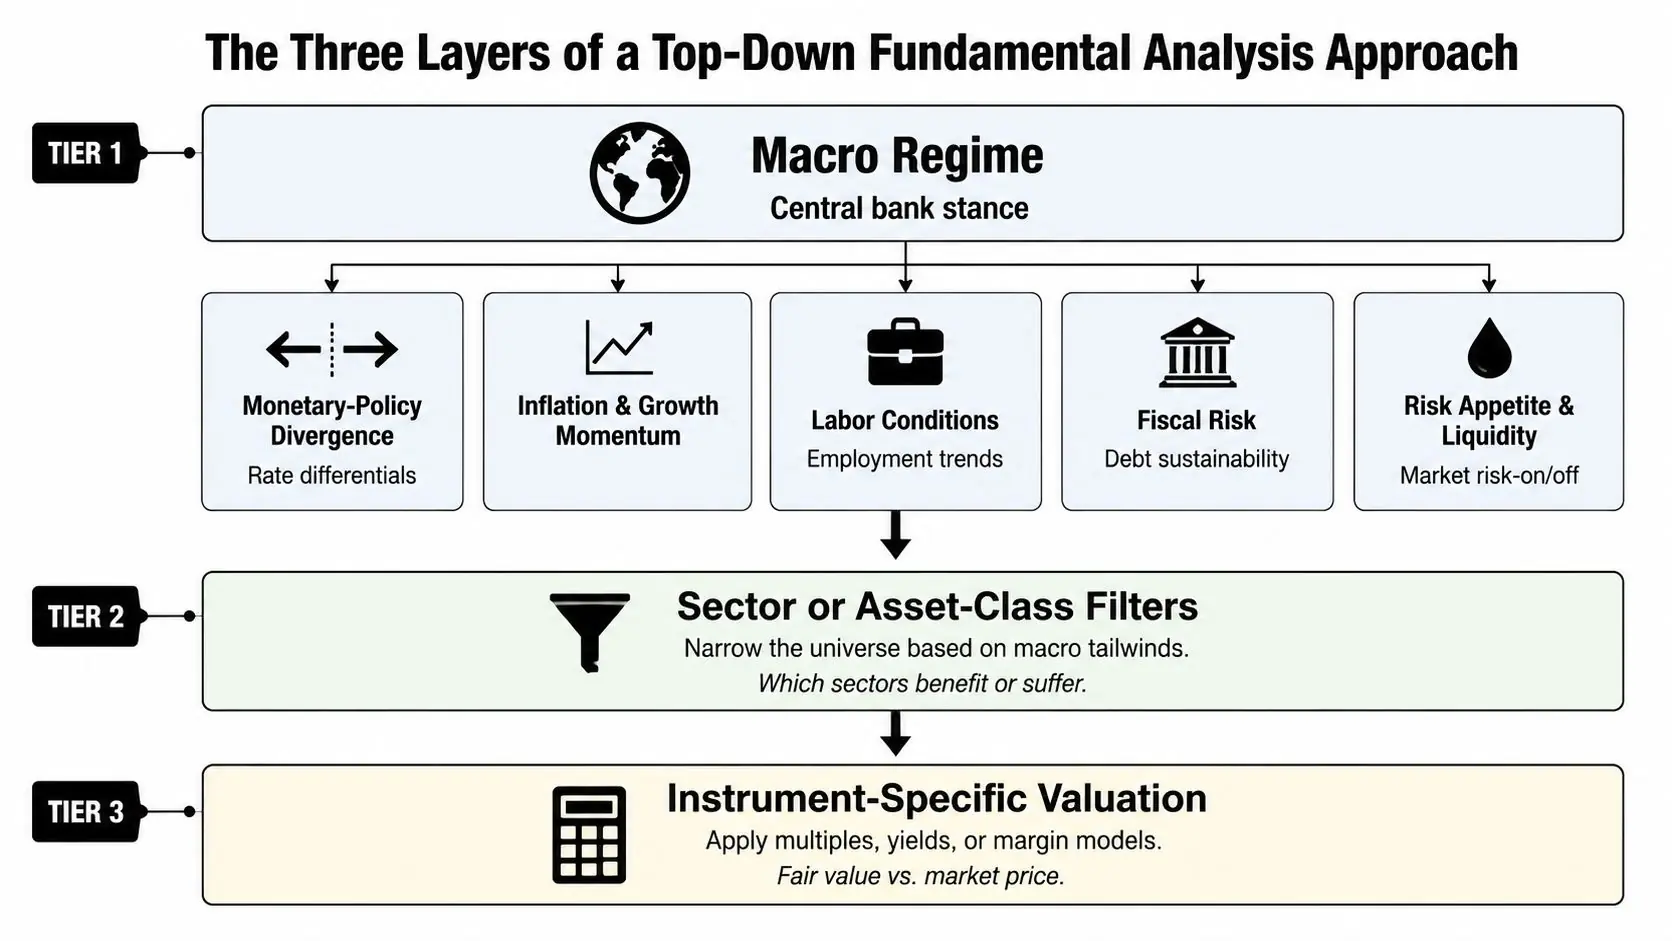
A top-down process moves from the broad environment to the tradable expression. The sequence matters because a strong company or attractive currency can struggle when the macro regime works against it.
Tier one, map the macro regime
Start with monetary-policy divergence, inflation and growth momentum, labor conditions, fiscal risk, risk appetite, and liquidity. In FX, the key output is a relative policy view. You aren't asking whether one economy is “good.” You're asking whether expected policy, real yields, and growth momentum favor one currency over another.
For an index CFD, the same layer affects discount rates, earnings breadth, and volatility. A change in rates can alter how traders value future cash flows, while weaker growth expectations can pressure revenue assumptions. The macro layer should produce a short statement such as: policy expectations favor currency A over currency B, but the view fails if inflation and labor data reverse.
Tier two, filter the relevant instrument or sector
Next, identify the mechanism specific to the asset. A currency pair requires attention to yield curves, external balances, trade exposure, and central-bank communication. An oil CFD requires supply, demand, inventories, spare capacity, refinery demand, and the shape of the futures curve. An index CFD requires sector concentration, earnings breadth, and sensitivity to rates.
Historical context helps here. Traders studying financial institutions can use this resource on historical analysis methods for banks to understand how past balance-sheet and credit conditions inform current interpretation. For rate-sensitive instruments, track the relevant interest-rate benchmarks rather than relying on a generic macro narrative.
Tier three, test single-asset quality
The final layer asks whether the chosen instrument can deliver the expected response. For a bank CFD, examine loan growth, net interest margins, credit quality, capital strength, and earnings revisions. For a commodity, examine supply constraints, inventories, and demand durability. For a currency, assess whether external funding needs or fiscal concerns could offset a rate advantage.
Rank every input by three characteristics:
- Surprise potential How different could the release be from consensus?
- Persistence Will the effect last beyond the initial reaction?
- Sensitivity How strongly has the instrument responded to similar information?
Your final trade thesis should specify direction, expected magnitude, horizon, catalyst, invalidation condition, and the price move already implied. Without those fields, you have a narrative, not a tradable plan.
Core Data Sources and Modeling Techniques That Actually Move Price
For short-horizon trading, not all fundamental inputs deserve equal weight. Backward-looking valuation ratios can frame a regime, but central-bank guidance, rate expectations, inflation surprises, labor data, purchasing managers' indexes, positioning, and liquidity usually offer a closer connection to immediate repricing.
A useful hierarchy looks like this:
- Policy expectations: Central-bank guidance and rate-market pricing shape currency differentials and discount rates.
- Surprise data: Compare actual results with consensus and the prior reading. The surprise often matters more than the headline level.
- Revision flow: For CFD traders, changes to earnings expectations can be more actionable than a static multiple. Research has found predictive information in fundamental signals for future returns, earnings changes, and analyst forecast revisions. The cited research reports monthly three-factor-model-adjusted excess returns of 1.34% for earnings-revision portfolios and 0.92% for recommendation-revision portfolios in the examined markets, evidence that prices can underreact to fundamental information (research paper).
- Asset-specific operating data: Inventory surprises, commodity curve spreads, freight conditions, and sector indicators can confirm or challenge the macro view.
- Valuation models: P/E, P/B, PEG, dividend yield, ROE, D/E, free cash flow, and EV/EBITDA help compare price with earnings, assets, growth, borrowing power, and cash generation (financial metrics guide). DCF, purchasing-power parity, and fair-value models are best treated as scenario maps, not precise targets.
For equities and equity CFDs, EPS provides the bridge between profitability and valuation. It is calculated as net income minus preferred dividends, divided by shares outstanding, and it connects income-statement performance to measures such as P/E (EPS explanation). A P/E of 20 means investors are paying $20 for every $1 of trailing earnings, but that ratio says little about whether those earnings will rise, flatten, or deteriorate.
| Input | Primary Use | Short-Horizon Value | Key Limitation |
|---|---|---|---|
| Central-bank guidance | Reprice policy expectations | High around communication | Language can be deliberately ambiguous |
| Rate futures and yield curves | Compare expected policy paths | High for FX and rate-sensitive CFDs | Pricing can reverse with new data |
| Inflation and labor releases | Test policy assumptions | High at scheduled events | The market trades the surprise, not just the number |
| PMI and credit data | Assess growth momentum | Moderate to high | Surveys can lead or lag actual activity |
| Earnings revisions | Track changing profit expectations | High for equity CFDs | Consensus can adjust after the price move |
| Inventory and curve data | Map commodity supply and demand | High for energy and metals | Local disruptions can dominate |
| P/E, P/B, and DCF | Frame relative or intrinsic value | Low for immediate entries | Assumption-sensitive and slow to converge |
Keep the model simple. Timestamp every release, record actual versus forecast and prior, estimate how long the information should matter, then translate the result into bullish, bearish, and invalidation scenarios. A versioned spreadsheet is often more useful than an elaborate model nobody updates. For broader context on exploring analysis methods for equity research, compare qualitative judgment with quantitative evidence instead of treating them as competing disciplines.
Event preparation also needs execution rules. A practical guide to trading economic news should sit beside your data log, not replace it. Track spread expansion, slippage, and post-release liquidity because a correct forecast can still produce a poor fill.
Matching the Approach to Your Timeframe and Strategy Style
The same data point has different value at different horizons. A five-year inflation expectation may help frame a monthly currency view but offer little guidance for a 30-minute setup. Conversely, tick-level order flow can improve an intraday entry while adding noise to a macro thesis.
| Timeframe | Primary Inputs | Secondary Inputs | Ignore |
|---|---|---|---|
| Intraday | Scheduled releases, immediate policy reaction, liquidity, price response | Positioning and order flow | Slow valuation targets |
| Weekly | Rate differentials, inflation trend, labor momentum, central-bank guidance | Technical structure and positioning | Tick-level fluctuations |
| Monthly | Terms of trade, external balances, fiscal direction, growth regime | Cross-asset confirmation | Single-session noise |
| Quarterly CFD trade | Earnings revisions, margins, inventories, sector demand | Valuation and balance-sheet quality | Intraday headline variation |
An intraday trader might plan an NFP reaction, but the fundamental input is mainly the consensus gap, the initial yield response, and whether price accepts or rejects the move. A weekly FX trader can hold a rate-differential thesis through several sessions. A monthly trader may focus on terms of trade and fiscal credibility. A quarterly CFD trader has more room to analyze earnings revisions, cash generation, borrowing, and sector demand.
How the approaches divide the work
Technical analysis answers where and when. Support, resistance, breakouts, volatility bands, and momentum can define an entry, stop, and exit structure. Quantitative analysis answers how consistently and under what conditions. Carry, term structure, revision momentum, volatility filters, and correlation models can test whether a discretionary idea survives a broader sample.
Fundamental analysis answers why this instrument and why now. It supplies the regime and catalyst, but it doesn't guarantee a clean entry. Traders who force a long-term thesis into a short holding period often overstay losing trades. Traders who ignore macro context can mistake a technical bounce for a durable change in direction.
Prop challenges create a further constraint. Daily loss limits and maximum drawdown rules make slow, thesis-driven positions difficult if the trade has no defined catalyst or invalidation point. In practice, higher-timeframe clarity usually beats forcing microeconomic data into every intraday decision.
Integrating Fundamentals With Technicals and Quant Models
The cleanest integration is a pipeline, not a debate over which school is superior.
- Fundamental direction Establish the bias from economic data, policy expectations, and asset-specific conditions.
- Technical entry timing Wait for price to confirm the direction through a breakout, pullback, reclaim, or failed move.
- Quantitative confirmation Use carry, term structure, revision momentum, volatility, or correlation filters to challenge the idea.
Consider a long USD/JPY setup. The fundamental thesis is that the Fed-BoJ rate gap is widening, making the dollar more attractive relative to the yen. The technical condition is a weekly breakout above established resistance, which prevents the trader from buying just because the macro story sounds persuasive. A quantitative filter then checks whether expected carry compensates for the prevailing volatility and whether the pair's correlation profile creates excessive portfolio exposure.
The trade still needs a failure test. If the rate gap narrows, the breakout fails, or volatility expands beyond the strategy's tolerance, the position should be reduced or closed. A model doesn't rescue a bad thesis, and a strong thesis doesn't justify ignoring the stop.
Execution rule: Use fundamentals to select the side, technicals to select the location, and quantitative tools to control repetition, exposure, and model discipline.
The common failures are predictable:
- Technicians without a macro view chase breakouts directly into policy risk.
- Fundamentalists without levels enter during poor liquidity and absorb unnecessary adverse movement.
- Quants without economic logic overfit noise and mistake historical correlation for a durable mechanism.
Automation can help monitor calendars, compare rate curves, and flag abnormal moves. Resources on AI in forex are useful for understanding where machine assistance fits, but the trader still needs to define the risk budget and the conditions that invalidate the signal.
A Real-World Walkthrough of the Approach in a 2026 Trade
A hotter-than-expected first-quarter eurozone CPI release arriving alongside softer US data can create a clean relative-rate setup for EUR/USD. Traders may price a more hawkish ECB while reducing expectations for US policy tightness, giving the euro a fundamental tailwind.
The headline is only the starting point. Check positioning and implied policy expectations first. If hawkish ECB pricing is already stretched, the CPI surprise may produce a short-lived spike. If expectations remain subdued, the same release can trigger a larger repricing.
Building the setup
The macro thesis gains credibility when other indicators point in the same direction. Review eurozone wage data and PMI readings for evidence that inflation pressure is persistent. Then compare US growth and labor indicators for signs that domestic resilience is fading. A broad signal is more useful than a single CPI component driving the entire trade.
Assume EUR/USD breaks below 1.0800 after the release and then reclaims the level. That reclaim does not justify an immediate long entry. Wait for price to hold above the level and break the post-release range, so the technical structure defines the risk. Failure to hold the reclaim suggests the market is rejecting the hawkish interpretation.
European bank CFDs may offer a secondary expression of the same view because higher expected rates can support interest income assumptions. The exposure has different risks, however. Credit concerns, regulation, and equity risk appetite can overwhelm the rate channel. A bank CFD also increases concentration when the currency and equity positions respond to the same macro event.
Managing the position
Position size should account for the volatility regime, liquidity around the release, and the distance to invalidation. Define the exit before entry. Examples include a dovish ECB speech, a reversal in the expected policy path, or new data that weakens the wage and PMI confirmation.
A profitable trade does not prove that every decision was correct. Review the result by source:
- Fundamental direction Did the relative policy thesis explain the broad move?
- Technical timing Did the breakout or reclaim improve the entry?
- Risk management Did the exit follow the invalidation plan?
- Luck Did an unrelated geopolitical or liquidity shock help the position?
The scenario also shows why the forecast method must match the trading horizon. A model built for slow macro relationships should not dictate a short-lived event trade. Traders should choose the right forecasting model before assigning model output to execution.
Common Misconceptions and a Practical 30-Day Implementation Plan
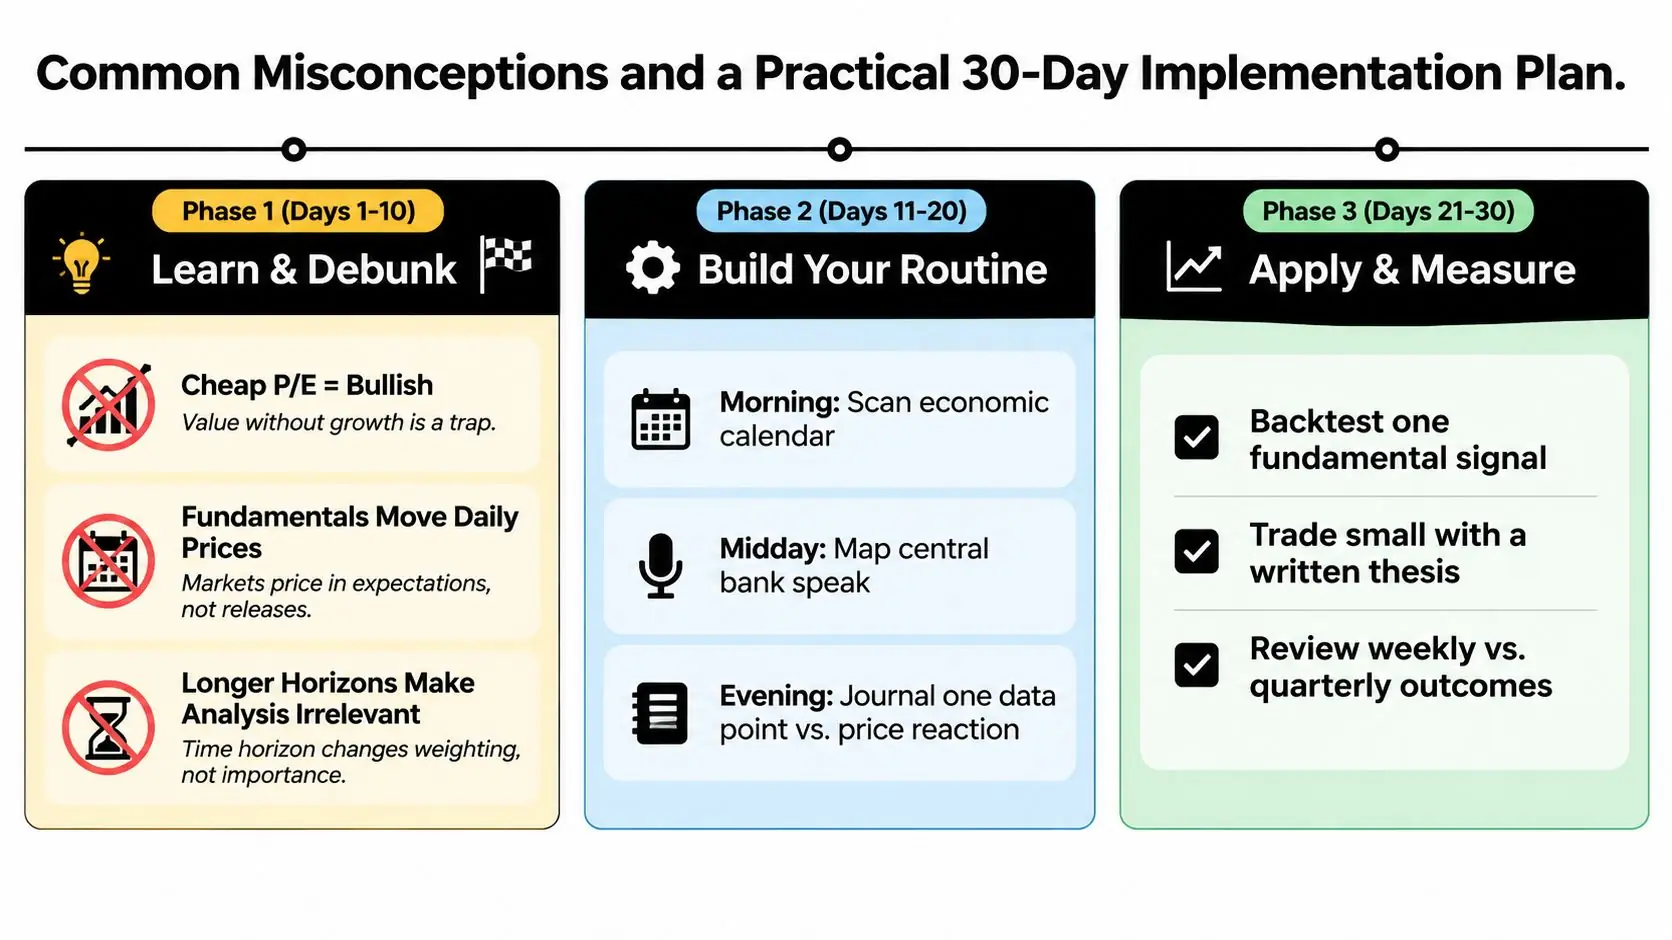
The most expensive misunderstanding is that “cheap” means bullish. A low P/E or P/B ratio can reflect deteriorating earnings, weak cash generation, debt, or an industry facing structural pressure. Fundamental analysis relies on financial statements, especially the balance sheet, income statement, and cash flow statement, because price comparisons without financial context are incomplete (statement-analysis overview).
A second mistake is assuming fundamentals move every daily price change. Markets trade expectations, positioning, liquidity, and reactions. A release can be favorable in absolute terms and still bearish if traders expected something better. A third mistake is believing a longer horizon makes analysis easy. Longer horizons reduce some noise, but they increase exposure to assumption errors, policy shifts, competition, and changing cash flows.
The 2025 market discussion adds a useful challenge to value-only thinking. Morgan Stanley commentary noted that first and second-quarter earnings beat Wall Street estimates by nearly 10%, while its December commentary emphasized strong earnings revisions and price momentum as dominant equity factors, as summarized in this top-down fundamental analysis discussion. The practical lesson is clear: direction of change can matter more than a static valuation discount. A cheap asset with falling revisions can remain cheap.
Days one through ten, build the information base
Create a macro dashboard covering rate expectations, CPI, PMI, labor conditions, and scheduled central-bank events for the eight most-traded currency pairs in your process. Don't collect data for its own sake. For every release, record consensus, prior, actual, immediate yield response, currency response, and whether the move held.
Write down the three myths you're testing:
- Cheap P/E equals bullish Ask whether earnings revisions and cash generation are improving.
- Fundamentals move daily prices Separate the catalyst from the market's technical reaction.
- Longer horizons make analysis irrelevant Change the weighting of inputs without abandoning the macro regime.
Days eleven through twenty, write instrument notes
Prepare a one-page note for each FX pair and CFD asset you trade. Include the dominant macro driver, the relevant sector or supply-demand mechanism, the next catalyst, the market-implied outcome, and the condition that would invalidate the thesis.
Use a consistent morning, midday, and evening routine:
- Morning Scan the economic calendar and mark event-window liquidity risks.
- Midday Map central-bank communication against the current rate curve.
- Evening Journal one data point and the market's price reaction.
Days twenty-one through thirty, test execution
Paper-trade every setup against a documented catalyst. Record whether the trade worked because of direction, timing, risk control, or luck. Then evaluate whether your intended holding period fits your account rules before applying for outside capital.
Position sizing remains the final filter. Correlated FX positions can turn several trades into one concentrated bet. Event releases can widen spreads and increase slippage. A correct macro view doesn't protect a trader who sizes beyond the account's daily loss tolerance.
Trading involves risk of loss, and this material is educational rather than financial advice. If your process is ready for a controlled evaluation, review MyFundedCapital's simulated funding programs, including Instant Funding and 1-Step or 2-Step Challenges, with account options from $5K to $100K and scaling paths up to $500K. The firm supports manual, algorithmic (by agreement with support), and copy trading across 350+ instruments, with stated risk parameters including a 5% daily loss limit and up to 10% maximum drawdown, subject to its current terms.
Frequently asked questions
Is fundamental analysis useful for intraday FX trading?
Yes, but mainly as a regime, catalyst, and risk filter. It can identify when policy news, inflation data, or labor releases may create volatility. Technical structure and execution usually matter more for the exact entry and exit.
Which fundamental inputs matter most for FX?
Relative policy expectations, inflation persistence, growth momentum, labor conditions, yield differentials, risk appetite, and external balances are core inputs. The priority changes with the currency pair and the trading horizon.
Are low P/E and P/B ratios enough to buy a CFD?
No. A low multiple can reflect falling earnings, weak cash flow, high debt levels, or deteriorating industry conditions. Pair valuation with revision direction, balance-sheet resilience, and a catalyst.
Should traders use fundamental, technical, and quantitative analysis together?
They can, provided each tool has a defined job. Fundamentals set direction, technicals improve timing, and quantitative models test consistency and manage exposure. Combining tools without clear roles only creates conflicting signals.
MyFundedCapital gives traders access to simulated funding through Instant Funding and 1-Step or 2-Step Challenges, with manual, algorithmic (by agreement with support), and copy-trading support across forex, crypto, and commodities. Review the available account types, risk parameters, platforms, and payout terms, then visit MyFundedCapital if you're ready to test your fundamental analysis approach under defined prop-trading rules.