Most traders ask, will gold price increase, then stop at the headline. That's the mistake. A yes-or-no view is almost useless when gold is already trading near historically high levels and forecasts for the next move are split so widely.
What matters is probability, not prediction. If you trade gold, you need to know which drivers are still pushing the trend, which ones are fading, where the chart gives you a clean trigger, and how much of the bullish story may already be in the price.
Beyond the Question Will Gold Price Increase
A simple bullish answer sounds attractive because gold has earned that reputation over decades. After the U.S. gold standard ended in 1971, gold went through major bull markets in the 1970s and again in the 2010s. More recently, it reached a new record high of 5,608.35 in January 2026, showing that gold can still make fresh highs during periods of inflation and geopolitical stress, as outlined in Investopedia's gold price history review.
That history matters, but it can also trap traders. A market can be structurally strong and still deliver poor entries, false breakouts, and sharp corrections.
The wrong question traders ask
“Will gold price increase?” assumes direction is the main issue. For a trader, it usually isn't.
The better questions are:
- What is already priced in: If a lot of optimism is embedded, upside may require a new catalyst.
- Which driver matters most now: Gold can respond to yields, inflation, crisis headlines, currency moves, and official-sector demand, but they don't always align.
- What confirms the move: A strong narrative doesn't replace a valid setup.
- What breaks the thesis: Every bullish view needs a clear invalidation point.
Desk rule: Don't trade the story alone. Trade the point where the story, the macro backdrop, and the chart line up.
Gold's long-term behavior tells you it can rise hard in unstable regimes. It doesn't tell you whether today's price offers attractive risk-reward. That distinction is where most retail commentary falls short, and where traders can gain an edge.
The Macroeconomic Engine Driving Gold Prices
Gold usually looks simplest at the point when it is easiest to misread. A bullish macro story can be true and still produce weak trades if the market has already priced in easier policy, lower real yields, and persistent official demand.
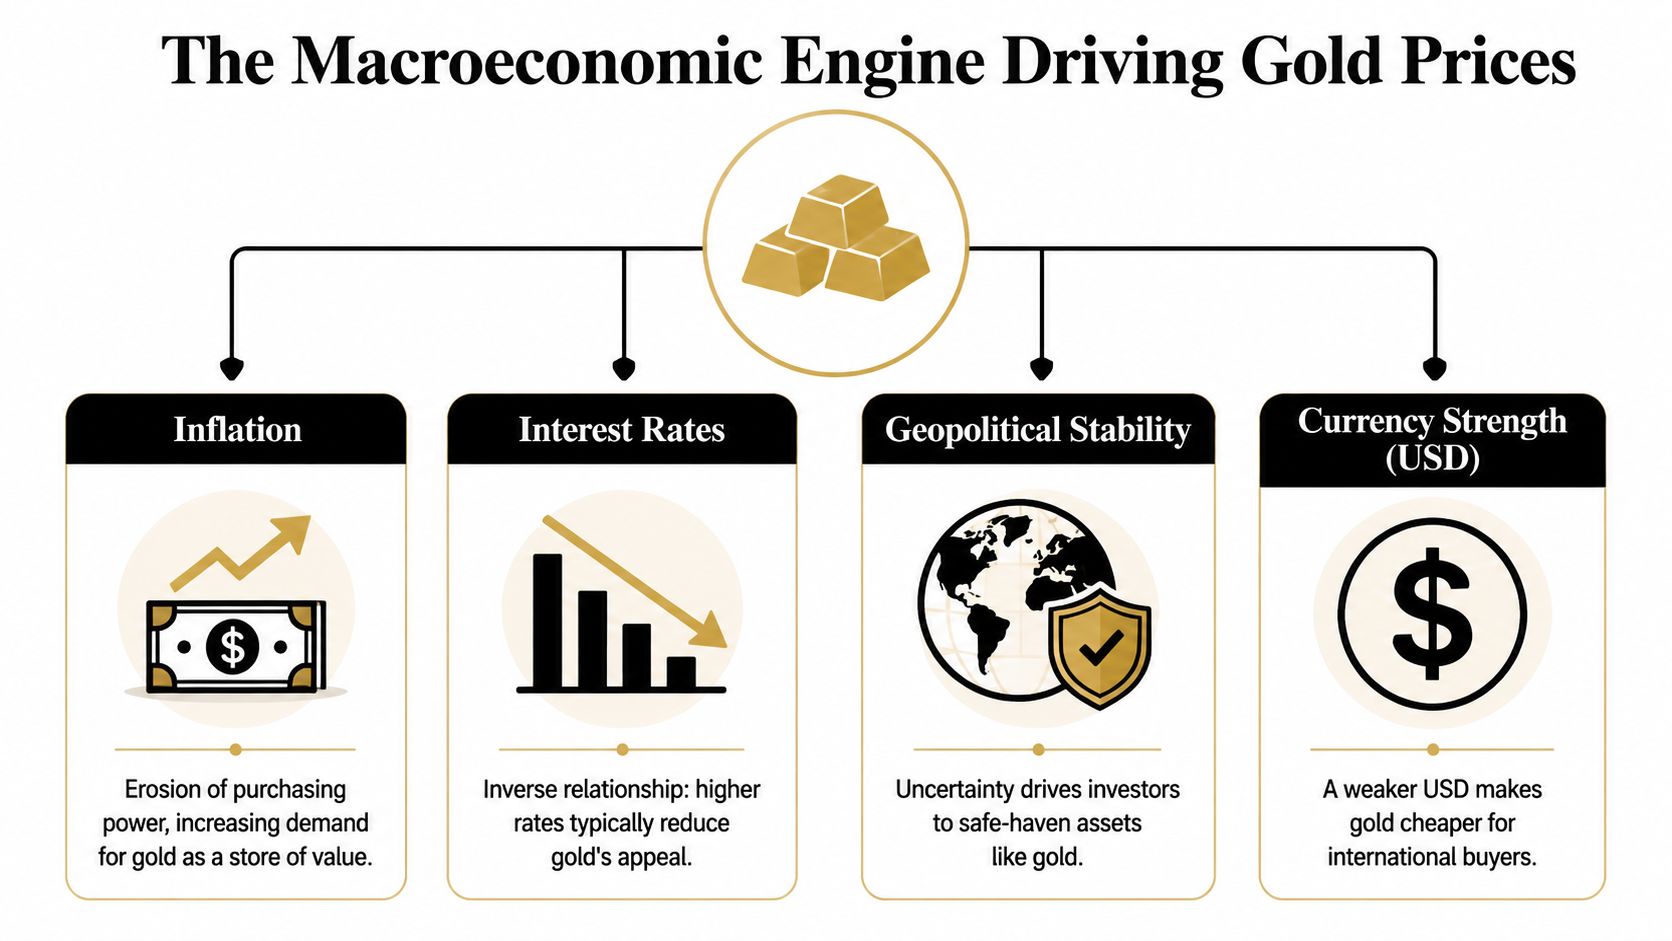
Real yields still set the baseline
Start with the variable that tends to matter most over time: real yields. Gold has no cash flow, so its relative appeal improves when inflation-adjusted bond returns fall and weakens when they rise. That relationship is not perfect day to day, but it remains one of the cleaner macro anchors for positioning.
Many discretionary analysts are still running with aggressive upside targets for 2026 and beyond. Those forecasts only make sense if real yields stay contained or move lower. If inflation cools faster than nominal yields fall, that support weakens quickly, even if the long-term gold narrative remains intact.
For a trader, the practical question is narrower. Are rate-cut expectations pulling real yields down fast enough to justify fresh upside from current levels, or is the market already carrying that optimism?
Inflation only helps through the policy channel
Inflation by itself is an incomplete signal. Gold tends to respond less to the headline CPI print than to what inflation does to policy expectations, cash returns, and confidence in fiat purchasing power.
A workable chain looks like this:
- Inflation remains sticky enough to keep macro uncertainty high.
- Growth slows enough that markets start pricing easier policy.
- Real yields compress.
- Gold attracts incremental demand.
If the sequence breaks at step two, the bullish case gets less clean. High inflation with firm nominal yields can leave gold fighting a stronger opportunity-cost headwind than retail commentary usually admits.
That is one reason the gap between bullish bank research and many algorithmic projections matters. Discretionary analysts may be underwriting a supportive policy shift. Quant models often react more mechanically to yield, dollar, and momentum inputs. When those two camps diverge, traders should assume the path is less stable than the narrative suggests.
The dollar shapes the transmission
Gold trades globally but is priced primarily through the dollar. A softer dollar usually broadens demand and eases the path higher. A stronger dollar can slow the move, even in a constructive macro setup.
Correlation is not constant. In periods of acute stress, gold and the dollar can rise together because both are being used defensively. That is why traders should treat dollar strength as a context variable, not an automatic sell signal.
For a broader way to classify those shifts, use a risk-on and risk-off market framework when deciding whether gold is trading off inflation, growth stress, or a more general flight to safety.
Central-bank demand supports the floor, but the pace matters
Official-sector buying has been one of the stronger structural supports for gold in recent years, but traders make a mistake when they treat it as a one-way flow. Central banks can slow purchases, pause, or become less active at precisely the moment speculative positioning is most extended.
The cleaner source here is the World Gold Council's central bank and investment updates. Those reports are more useful than recycled summaries because they separate persistent official demand from shorter-term changes in ETF flows, OTC activity, and bar-and-coin demand.
The trading implication is straightforward. If real yields are falling, the dollar is softening, and central-bank demand stays firm, gold usually has a stronger macro base. If only one of those inputs is supportive, price can still rise, but the move becomes more dependent on positioning and headlines.
Keep an eye on geopolitics as well, especially when cross-asset correlations start to break down. Gold often reprices faster when macro stress is not yet fully reflected in rates or FX. For that reason, traders should monitor current analysis of global events alongside the standard macro dashboard.
Gold tends to trend best when falling real yields, a softer dollar, and steady official demand line up. When bullish forecasts assume all three, but market-based inputs only confirm one, the better approach is scenario planning, not certainty.
Gold as a Crisis Hedge and Safe Haven Asset
Gold's safe-haven label gets overused, but the function is real. Traders just need to separate headline spikes from durable repricing.

What recent crisis behavior tells us
Gold's response to macro shocks has been clear in recent years. According to APMEX's history of gold prices, gold first moved above $2,074/oz in 2020 during the COVID-19 crisis. The same source notes that gold kept climbing as inflation fears grew, the SVB collapse in 2023 unsettled markets, and traders priced in future Federal Reserve rate cuts. By June 19, 2026, the spot price stood at 4,151.74 USD/oz.
That sequence matters because it shows gold didn't rally on one isolated event. It absorbed repeated waves of uncertainty across public health, banking stress, inflation, and policy expectations.
Not every crisis move is the same
Treat crisis-driven gold moves in two categories.
| Type of move | What it usually means for traders |
|---|---|
| Short-lived shock bid | Fast upside, often headline-driven, but vulnerable to reversal if fear fades quickly |
| Regime repricing | Slower but more durable move when stress changes rate expectations, credit confidence, or inflation expectations |
A lot of traders get trapped by buying the first candle after the news. That's often the lowest-quality entry. The better trade comes when the market decides the event changes the macro path, not just the news cycle.
What to monitor in real time
When global stress rises, don't just watch gold itself. Track whether the event is affecting broader market expectations.
Use this checklist:
- Banking or credit stress: These events can quickly revive demand for hard assets.
- Policy repricing: If traders start expecting easier policy, gold often gets a second layer of support.
- Persistent geopolitical tension: If the issue keeps widening, haven demand can last longer.
- Dollar reaction: A stronger dollar can mute part of gold's upside.
If you want a wider geopolitical context before the market open, a rolling feed of current analysis of global events can help frame whether a story is fading or becoming a deeper market theme.
Gold works best as a crisis trade when the event spills into rates, credit, or confidence. A scary headline alone isn't always enough.
Reading the Charts A Technical Analysis of Gold
The macro story tells you why gold might move. The chart tells you whether buyers are taking control.
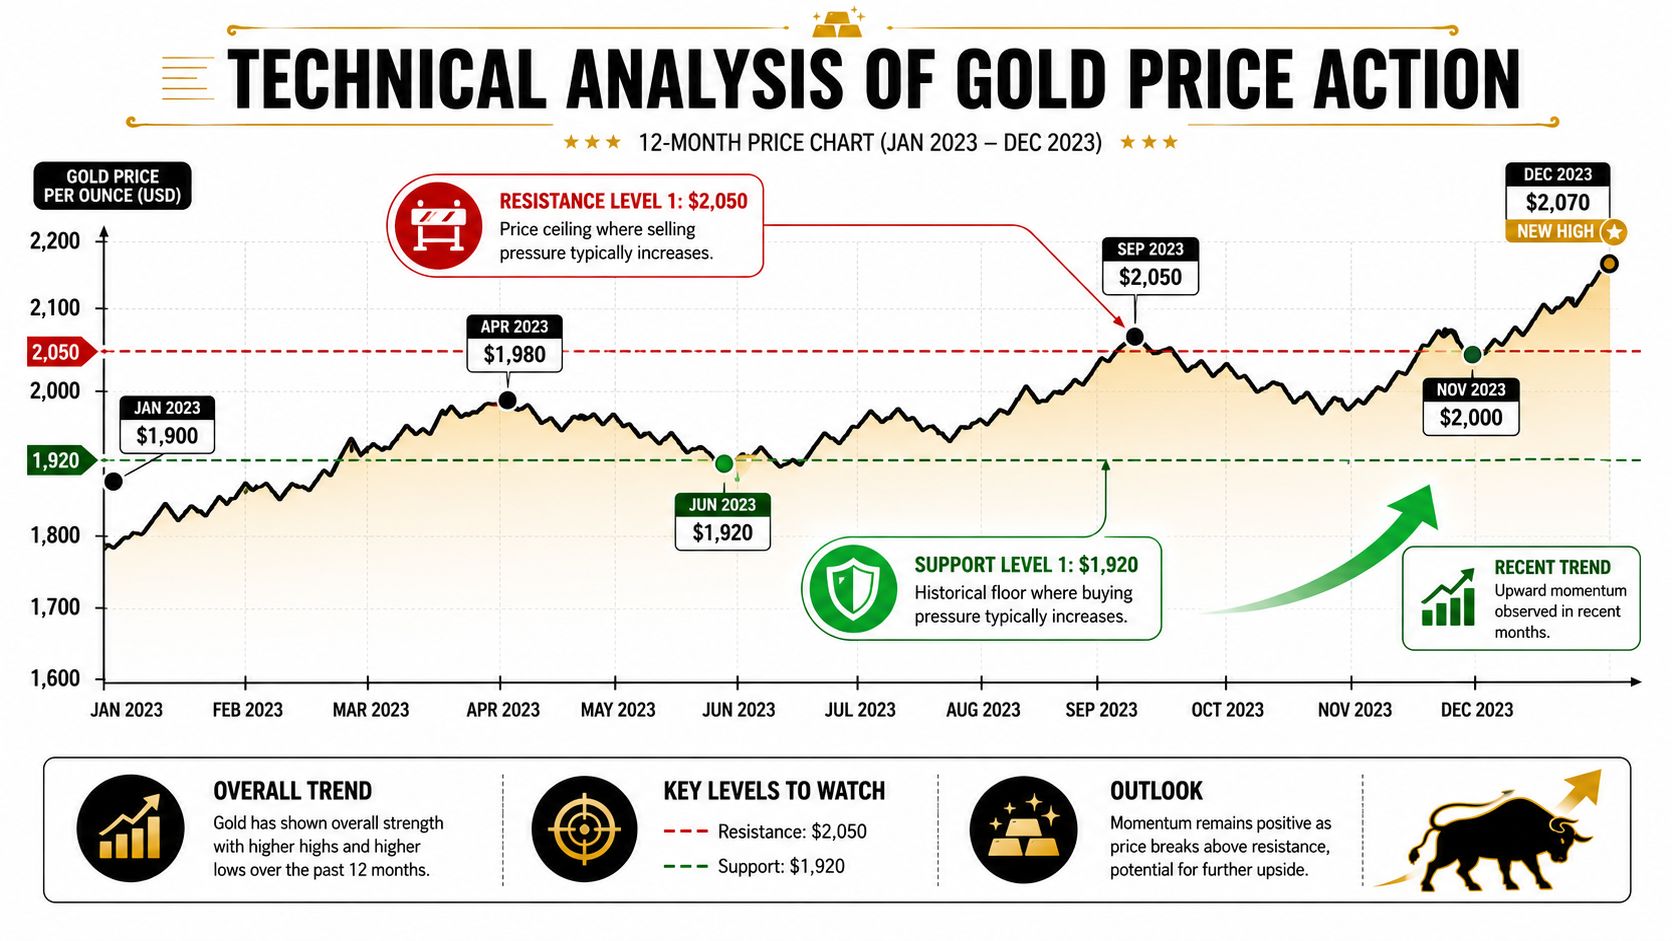
Gold is trading inside a broad range
Near-term, gold doesn't look like a market where traders should chase every uptick. One independent forecast placed June 2026 inside a broad $4,186 to $4,933 trading band, with resistance clustered around $4,254.97, $4,313.67, $4,376.04, and $4,441.34, and support near $4,114.01, $4,059.90, and $4,005.79, according to LiteFinance's gold forecast and technical map.
That structure tells you something important. Gold may still be in an uptrend on a bigger horizon, but in the near term it's behaving like a market that needs proof before the next leg higher.
The chart levels that matter most
You don't need to memorize every level. Group them.
First resistance zone
The first area to watch sits around the lower resistance cluster. If price can't hold above that zone, buyers may still be reacting emotionally rather than building a sustained move.
Upper resistance zone
The higher resistance cluster is where the market has to prove itself. A sustained move through that area would suggest gold is leaving range behavior and moving into a stronger trend regime.
Support ladder
Support isn't one line. It's a staircase. If the top support gives way, traders should look at whether buyers defend the next layer or whether the market starts accepting lower prices.
Execution note: The cleanest long setup usually isn't the first spike into resistance. It's the retest that holds after the breakout.
How to combine price levels with momentum tools
The verified data gives us the key levels. Your platform can help you judge the quality of the move.
A practical workflow:
- Start with structure: Mark the resistance cluster and support ladder on the chart.
- Check moving averages: If short-term averages are rising and price holds above them, momentum is healthier.
- Use RSI as a filter: If RSI is stretched into overbought conditions right under resistance, don't assume breakout. Wait for acceptance.
- Use MACD for confirmation: A momentum crossover can help you avoid entering too early. If you need a refresher on interpreting that indicator, this guide on how to read MACD is useful.
A trader's map for the next move
Here's a simple scenario table.
| Price behavior | What it suggests | Trading bias |
|---|---|---|
| Rejects resistance repeatedly | Range remains intact | Favor mean-reversion setups |
| Breaks resistance but fails to hold | False breakout risk | Stay selective, reduce size |
| Breaks and retests successfully | Trend confirmation | Look for momentum continuation |
| Loses layered support | Correction risk rises | Bias shifts defensive or short-term bearish |
The point isn't to predict which one happens. The point is to know what you'll do before price gets there.
Bull vs Bear Scenarios for 2026 and Beyond
The difficult call for 2026 is not whether gold can print higher highs. It is whether the bullish case that dominates headlines still offers favorable asymmetry once positioning, sentiment, and forecast dispersion are taken seriously.
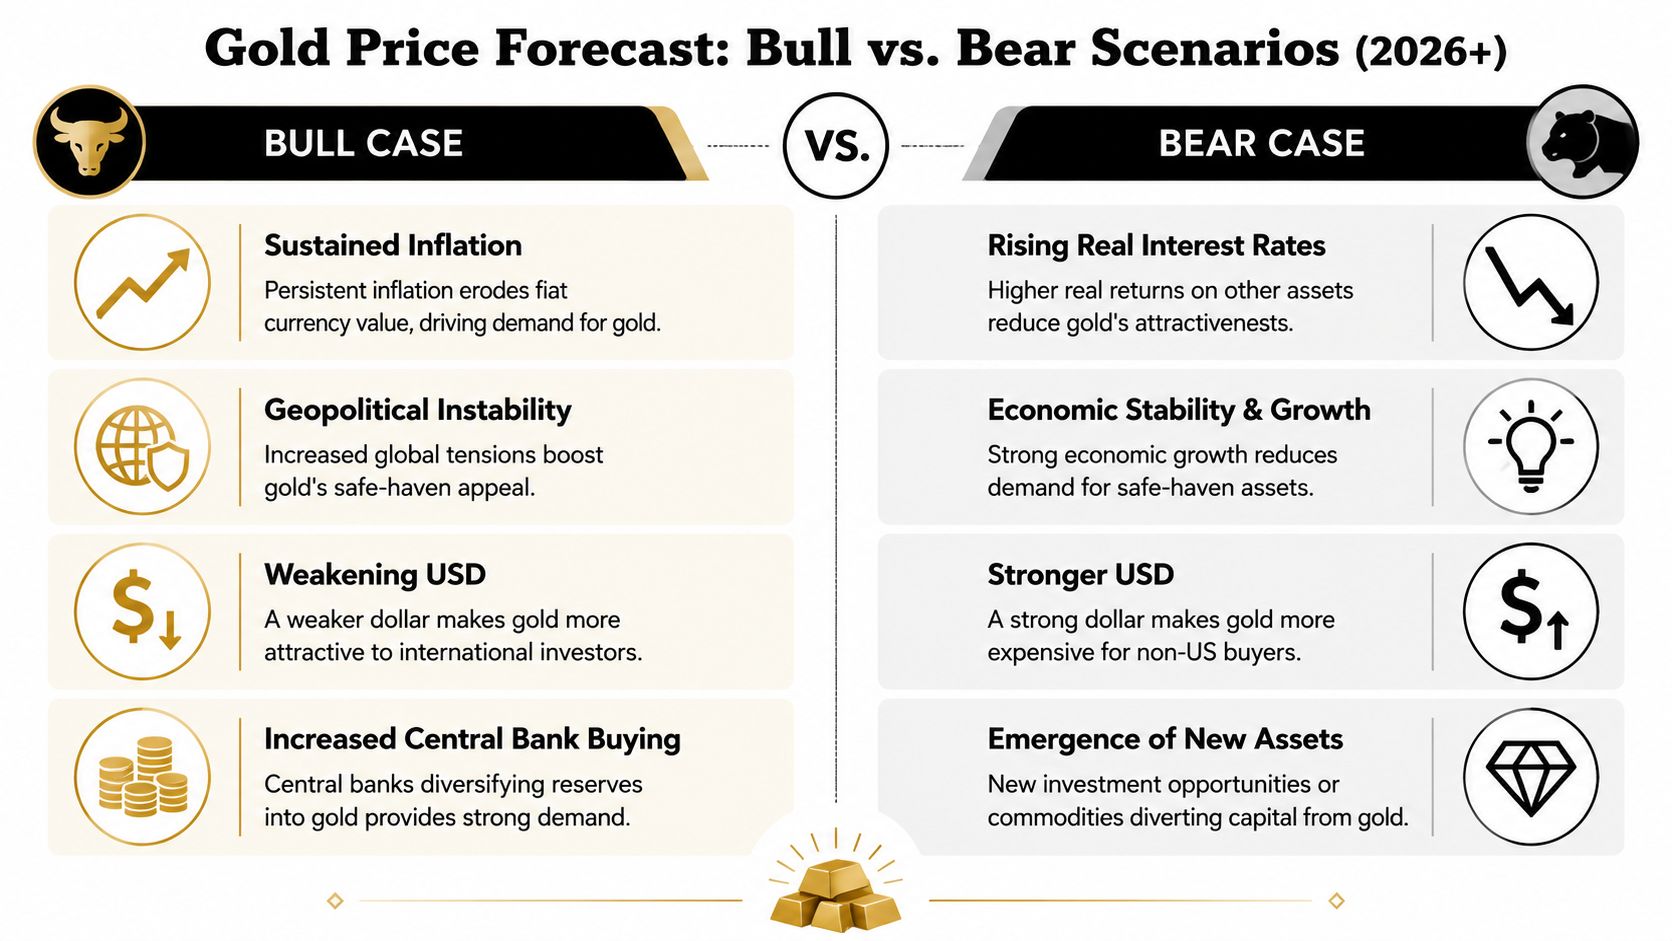
The bull case
The constructive case rests on a familiar mix of falling real yields, persistent policy uncertainty, geopolitical stress, and ongoing central-bank buying. If those inputs remain in place together, gold can hold a structurally higher range instead of giving back gains in a standard post-rally correction.
Forecasts from discretionary analysts still lean hard in that direction. J.P. Morgan projected around $6,000/oz by Q4 2026 and $6,300/oz by end-2027, a view that assumes macro conditions remain supportive long enough for another rerating phase.
That matters for traders because strong analyst targets can keep dip buyers active even after stretched advances. But aggressive upside forecasts can also attract late longs who are trading the headline instead of the path.
The bear case
The bearish scenario is less dramatic, but it is easier to trigger than many bulls admit. Gold does not need a collapse in the long-term thesis. It only needs several supports to weaken at once, such as firmer real yields, a stronger dollar, calmer geopolitical conditions, or slower official-sector demand.
Algorithmic and model-based projections show that downside risk is still very much part of the distribution. Some models have projected gold materially lower by end-2026 than the most bullish bank targets imply, which is the core tension in this market.
The key point is the size of the gap. Discretionary analysts are extrapolating a supportive macro regime. Quant models are more willing to price mean reversion. That divergence raises opportunity, but it also raises the cost of entering too early or holding too stubbornly.
Side-by-side scenario view
| Scenario | What needs to happen | What traders should watch |
|---|---|---|
| Bull case | Softer real yields, ongoing macro uncertainty, supportive policy repricing, resilient physical and official demand | Clean acceptance above prior highs, shallow pullbacks, strong follow-through after bullish catalysts |
| Bear case | Firmer dollar, reduced geopolitical premium, delayed rate cuts, weaker marginal demand, position washout | Failed breakouts, heavier selling into rallies, supports breaking on strong volume, weak response to bullish news |
Where the real disagreement sits
The market is not debating whether gold has long-term support. The key debate is how much of that support is already reflected in price.
That is why the split between bullish analyst targets and algorithmic projections deserves more attention than a simple yes or no forecast. If discretionary research is right, buying strength after confirmation can still make sense. If the models are closer to right, then chasing extended moves becomes a poor trade even if the secular story remains intact.
For CFD traders, this is also a product-selection question. Positioning around a wide forecast range looks different depending on rollover costs, holding period, and tactical flexibility, which is why the distinction in this guide to gold CFDs versus futures trading matters.
For readers comparing external views, this gold market outlook for 2026 is worth reading alongside your own scenario work.
The tradeable conclusion is simple. Treat 2026 and beyond as a probability spread, not a single destination. In a market where forecasts are this far apart, execution quality matters more than conviction.
Actionable Strategies for Trading Gold CFDs
A view without a playbook is noise. Gold CFD traders need setups that translate the macro and chart picture into repeatable decisions.
Setup one, breakout continuation
This is the cleanest bullish setup.
Trigger: Wait for price to move through the upper resistance cluster and then hold above it. Don't buy the first touch unless your system is specifically built for aggressive breakout entries.
Stop logic: Place the stop beyond the failed-breakout area, where the market would be proving your entry wrong, not merely fluctuating.
Target logic: Scale out into strength rather than demanding one perfect exit. In a volatile instrument like gold, partial profit-taking reduces psychological pressure.
This setup works best when a macro catalyst supports the move, such as a rates repricing or renewed crisis demand.
Setup two, range rejection trade
If gold keeps rejecting resistance and support continues to hold, range tactics may be better than trend tactics.
Use this checklist:
- At resistance: Look for rejection and weak follow-through before considering a fade.
- At support: Look for a defense by buyers before looking long.
- At the range middle: Usually do nothing. The middle is where reward-to-risk often gets worse.
In these instances, many traders overtrade. They see motion and assume opportunity. In reality, range centers are often low-quality zones.
Setup three, momentum retest after a pullback
Sometimes the best gold trade comes after the obvious move, not during it.
Entry idea: Let price break, pull back, and retest a former resistance area as support.
Why it works: The retest shows whether buyers still have conviction after the initial enthusiasm fades.
Risk control: If the retest fails, get out quickly. A failed retest often leads to a deeper unwind.
If you're choosing between gold CFDs and other instruments, it helps to understand the structural differences in CFDs versus futures trading, especially around flexibility, execution style, and how you manage positions.
A note on product selection risk
Not every metal-linked vehicle behaves like spot gold. Financial instruments designed for magnified or inverse market exposure can introduce path dependency and decay risk that changes outcomes over time. If you ever compare your CFD setup with exchange-traded alternatives, this piece on decay in inverse silver ETFs is a useful reminder that instrument structure matters as much as market direction.
A simple trading discipline checklist
- Define the level before the move happens
- Know which macro driver supports the trade
- Use size that survives volatility
- Place the stop where the thesis fails
- Record whether you traded breakout, rejection, or retest
- Review execution, not just P&L
Trading gold involves risk of loss. The goal isn't to be right about every move. The goal is to build a process that keeps you solvent when the market disagrees.
FAQ and Your Next Step in Trading
Is gold still bullish if it's already near historically high prices
It can be. A market can remain bullish while also being expensive in the near term. That's why traders should separate long-term direction from short-term entry quality.
What matters more for gold, inflation or interest rates
In practice, traders often get a cleaner signal from real yields and policy expectations than from inflation alone. Inflation helps most when it compresses real returns or increases demand for protection.
Should I trade gold on headlines alone
Usually not. Headlines can trigger sharp moves, but the better setups appear when price confirms the story through a breakout, a successful retest, or a clear defense of support.
What's the biggest mistake when asking will gold price increase
Treating the question as binary. The better approach is to ask which scenario is active, what level confirms it, and what invalidates it.
Trading involves substantial risk of loss and isn't suitable for every trader. This article is for educational purposes only and isn't financial advice.
If you want to apply this kind of scenario-based gold trading in a structured environment, explore MyFundedCapital. You can compare funding programs, review account types, and choose a path that fits your style, whether that's Instant Funding or a challenge model. It's a practical way to test discipline, execution, and risk management without treating trading like a guessing game.