Confused by the lines and bars of the MACD indicator on your chart? This guide breaks down how to read the MACD by explaining its three key parts: the MACD line, the signal line, and the histogram. You will learn how to interpret these components to analyze market momentum and spot potential trading signals.
Decoding the MACD Components
The Moving Average Convergence Divergence (MACD) might look intimidating, but its principle is simple. It tracks the relationship between two moving averages of an asset's price to give you a snapshot of trend momentum. Getting comfortable with its three main parts is the first step to using it effectively.
The MACD Line and The Signal Line
The core of the indicator consists of two lines that move above and below a central zero line. These lines are the engine of the MACD.
- The MACD Line: This is the "fast" line, calculated by subtracting the 26-period Exponential Moving Average (EMA) from the 12-period EMA. It reacts quickly to recent price changes.
- The Signal Line: This is a 9-period EMA of the MACD line itself. It acts as a slower, smoothed-out version of the MACD line, helping to filter out market noise and generate clearer signals.
The standard (12, 26, 9) settings on most trading platforms provide a solid balance between responsiveness and reliability, helping to avoid false signals from minor price ticks.
The Histogram and The Zero Line
The bars of the histogram and the central zero line provide an at-a-glance view of momentum strength.
The histogram is a visual representation of the distance between the MACD line and the signal line.
- When the MACD line is above the signal line, the histogram is positive (above zero).
- When the MACD line is below the signal line, the histogram is negative (below zero).
- The height of the bars indicates the strength of momentum. Growing bars suggest strengthening momentum, while shrinking bars suggest it's weakening.
The zero line acts as an equilibrium point.
- When the MACD line is above zero, it indicates bullish momentum is in control.
- When it’s below zero, it suggests bearish momentum is dominant.
For a deeper dive into chart interpretation, check out our guide on technical analysis trading tips.
MACD Components at a Glance
| Component | What It Represents | What It Signals to Traders |
|---|---|---|
| MACD Line | The difference between the 12-period and 26-period EMAs. | Shows the direction and strength of short-term momentum. |
| Signal Line | A 9-period EMA of the MACD line itself. | A slower, smoothed version used to generate crossover signals. |
| Histogram | The difference between the MACD line and the signal line. | Visually shows the strength of momentum (growing bars = strengthening). |
To see how the MACD fits within a broader analytical framework, this guide on Mastering Crypto Chart Analysis is a fantastic resource.
Using MACD Crossovers to Find Entry Signals
The MACD crossover is the most well-known signal, but trading every time the lines cross is a recipe for losses. A crossover simply hints at a shift in momentum; its reliability depends entirely on market context. Let's break down how to use these signals to identify potential entry points.
Identifying Bullish Crossovers
A bullish crossover occurs when the MACD line crosses above the signal line, suggesting short-term momentum is turning positive. The most reliable bullish crossovers share these characteristics:
- Occurs in an Uptrend: A crossover is more reliable when it aligns with the dominant trend (higher highs and higher lows).
- Happens Above the Zero Line: A crossover above the zero line suggests that existing bullish momentum is strengthening.
- Histogram Confirmation: The histogram flips from negative to positive, with growing bars indicating accelerating momentum.
Actionable Tip: Avoid taking bullish crossovers in a clear downtrend, as they are often temporary pullbacks. Use a longer-term moving average, like the 200 EMA, to help identify the overall trend direction.
Spotting Bearish Crossovers
A bearish crossover occurs when the MACD line crosses below the signal line, signaling that downside momentum may be building. The strongest bearish crossovers typically have these traits:
- Aligns with a Downtrend: The signal carries more weight when the price is already making lower lows and lower highs.
- Forms Below the Zero Line: A crossover below the zero line can confirm that a bearish market is continuing its trend.
- Histogram Flips Negative: The histogram turns from positive to negative, with growing red bars confirming building bearish pressure.
Imagine you're an FX trader looking at EUR/USD on your DXtrade chart. The MACD line (12-period EMA minus 26-period EMA) crosses above its 9-period EMA signal line. This is a classic buy signal. One study showed a MACD strategy on S&P 500 data delivering a 6.36% CAGR with a profit factor of 2.45. However, past performance is not indicative of future results. For a trader with a prop firm account, combining this signal with strict risk rules, like a 5% daily drawdown limit, is essential. You can learn more in a detailed OANDA guide on entries and exits.
A Practical Example with Risk Management
Let’s walk through a scenario on the S&P 500 1-hour chart, which is in a clear uptrend.
- Spot the Signal: You see the MACD line cross above the signal line. Both lines are above the zero line, confirming strong underlying momentum.
- Look for Confirmation: The histogram bars have flipped positive and are starting to grow, indicating building bullish momentum.
- Define Your Risk: Before entering a trade, identify the most recent swing low on the price chart. Place your stop-loss just below that level to contain your potential loss if the signal fails.
This process—signal, confirmation, and risk management—is vital for any trader. Never trade a crossover in isolation; always validate it with price action and have a solid risk plan.
Reading the Zero Line to Confirm Market Trends
While crossovers get attention, the MACD's zero line is a simple and reliable tool for filtering trades. Think of it as a dividing line: above is bullish territory, and below is bearish. This filter helps you stay on the right side of the market's momentum.
The zero line marks the point where the 12-period EMA and the 26-period EMA are equal. When the MACD line moves above zero, it signals that the shorter-term average has crossed above the longer-term one—a classic sign of positive momentum.
Using the Zero Line as a Trend Filter
The zero line helps you set a directional bias and avoid fighting the dominant trend, which is a common trading mistake.
- Bullish Bias: If the MACD line is above the zero line, focus on looking for buying opportunities.
- Bearish Bias: When the MACD line is below the zero line, focus on looking for selling opportunities.
This filter helps screen out many low-probability setups. By trading in alignment with the zero line's bias, you trade with the market's momentum, not against it.
Interpreting MACD Positions Relative to the Zero Line
| MACD Position | Implied Market Bias | How to Apply It to Your Trades |
|---|---|---|
| MACD is Above Zero | Bullish | Prioritize looking for buy setups. A bullish crossover here is a stronger signal. |
| MACD is Below Zero | Bearish | Prioritize looking for sell setups. A bearish crossover here carries more weight. |
| MACD Crosses Above Zero | Momentum Shift to Bullish | This can be a strong confirmation that a potential new uptrend is beginning. |
| MACD Crosses Below Zero | Momentum Shift to Bearish | This can confirm that sellers are taking control and a new downtrend may be starting. |
The Power of a Zero Line Crossover
A crossover of the zero line itself is a significant chart event. When the MACD line moves from negative to positive territory, it’s a powerful signal that momentum has shifted from bearish to bullish. This is often a more reliable sign of a new trend than a simple MACD/signal line crossover, which can generate false signals in choppy markets.
A zero line crossover may indicate a new, sustainable trend is underway. A standard bullish crossover that happens below the zero line could be a minor pullback in a downtrend. But a crossover that pushes the MACD above the zero line signals stronger conviction from buyers.
This is a critical concept when you learn how to read MACD for swing trades on an asset like gold (XAU/USD). Backtested strategies often show that adding a trend filter—like a 200-day moving average, which serves a similar purpose—improves results. One study on the S&P 500 showed a trend-following strategy clocking in at a 6.36% CAGR. You can get a better look at how these strategies work in this deep dive on MACD trading.
A Multi-Timeframe Approach
To sharpen your entries, combine zero-line analysis across multiple timeframes. This helps ensure short-term trades are aligned with the bigger picture.
- Find Your Direction (4-Hour Chart): Check a higher timeframe, like the 4-hour chart. If the MACD is above the zero line, your bias for the day is bullish.
- Hunt for Entries (15-Minute Chart): Drop down to a lower timeframe, like the 15-minute chart. Wait for a setup that aligns with your bullish bias, such as a bullish MACD crossover or a bounce off a key support level.
This structured approach promotes disciplined, rules-based trading. Remember that all trading involves substantial risk of loss, and this content is for educational purposes, not financial advice.
Using MACD Divergence to Catch Reversals
While crossovers confirm momentum, divergence can help you anticipate potential trend reversals. It acts as an early warning that a trend might be losing strength, helping you avoid buying at the top or selling at the bottom.
Divergence is a disagreement between price action and the MACD indicator. When the price hits a new high but the MACD doesn't, or vice-versa, it's a signal that the conviction behind the trend may be fading.
What Is Bullish Divergence?
Bullish divergence can appear near the end of a downtrend, suggesting that selling pressure is weakening even as the price makes a new low.
Here’s what to look for on the chart:
- Price Action: The asset makes a new lower low.
- MACD Indicator: At the same time, the MACD makes a higher low.
This disagreement is a clue that the downtrend might be about to reverse. However, a bullish divergence is not a standalone buy signal. It's a prompt to look for a confirmation from price action, such as a break of a downtrend line.
Identifying Bearish Divergence
Bearish divergence is a warning sign that often forms at the peak of an uptrend, signaling that buying momentum is fading.
The checklist for a bearish divergence is:
- Price Action: The asset makes a new higher high.
- MACD Indicator: At the same time, the MACD makes a lower high.
This tells you that even though the price is rising, the underlying momentum is weakening. For a risk-conscious trader, this is a signal to consider taking profits or tightening a stop-loss.
How to Actually Use This in Your Trading
Divergences are a powerful tool for anticipating reversals. For example, if an index makes a higher high while the MACD histogram prints a lower one, you have classic bearish divergence. This is a cue to look for a short setup, a strategy that fits within the flexible trading rules at MyFundedCapital.
Research has shown a modified MACD strategy improved trend-following accuracy by 55.55% over the standard version in backtesting. The same study noted how day traders used bullish divergence to identify the EUR/USD rebound in 2018. The price made a lower low, but the MACD formed a higher low—a textbook signal that preceded a significant rally. You can dig into the numbers yourself in the full research on indicator accuracy.
A Real-World Chart Example
Let's walk through a bearish divergence scenario on the Bitcoin (BTC) 4-hour chart.
- Spot the Divergence: BTC rises to $65,000, and the MACD hits a peak. Later, the price makes a new high at $67,000, but the MACD's corresponding peak is lower than the first one. This is a clear bearish divergence.
- Wait for Confirmation: Do not short immediately. Draw an ascending trendline connecting the recent price lows and wait for the price to break and close below that line.
- Define Your Trade: Once the trendline breaks, you have confirmation. You can enter a short position, placing your stop-loss just above the recent $67,000 high to manage your risk.
This disciplined process—combining the early warning from divergence with a confirmation from price action—helps turn an observation into a higher-probability trade setup.
Remember, all trading involves risk of loss. This educational content is not financial advice.
Building a Complete MACD Trading Strategy
A raw MACD signal is just one piece of the puzzle. To trade effectively, you must combine it with other analysis tools to build a robust, rules-based strategy. By layering MACD signals with price action and other filters, you can learn to identify higher-probability setups.
Creating Confluence for Stronger Signals
The key to using the MACD effectively is confluence—when multiple, independent analytical tools point to the same conclusion. A MACD crossover that occurs as price bounces off a major support level is a much stronger signal than a crossover in isolation.
Build a case for each trade with multiple pieces of evidence:
- Support and Resistance: Look for bullish crossovers that occur near key support levels or moving averages like the 200-period EMA.
- Price Action Patterns: A bearish divergence that forms a classic double top pattern is a more potent signal.
- Trend Confirmation: Always check a higher timeframe to establish a directional bias. Never take a crossover signal that fights the dominant trend.
This decision tree gives you a simple visual for thinking through a MACD divergence signal by combining it with price action.
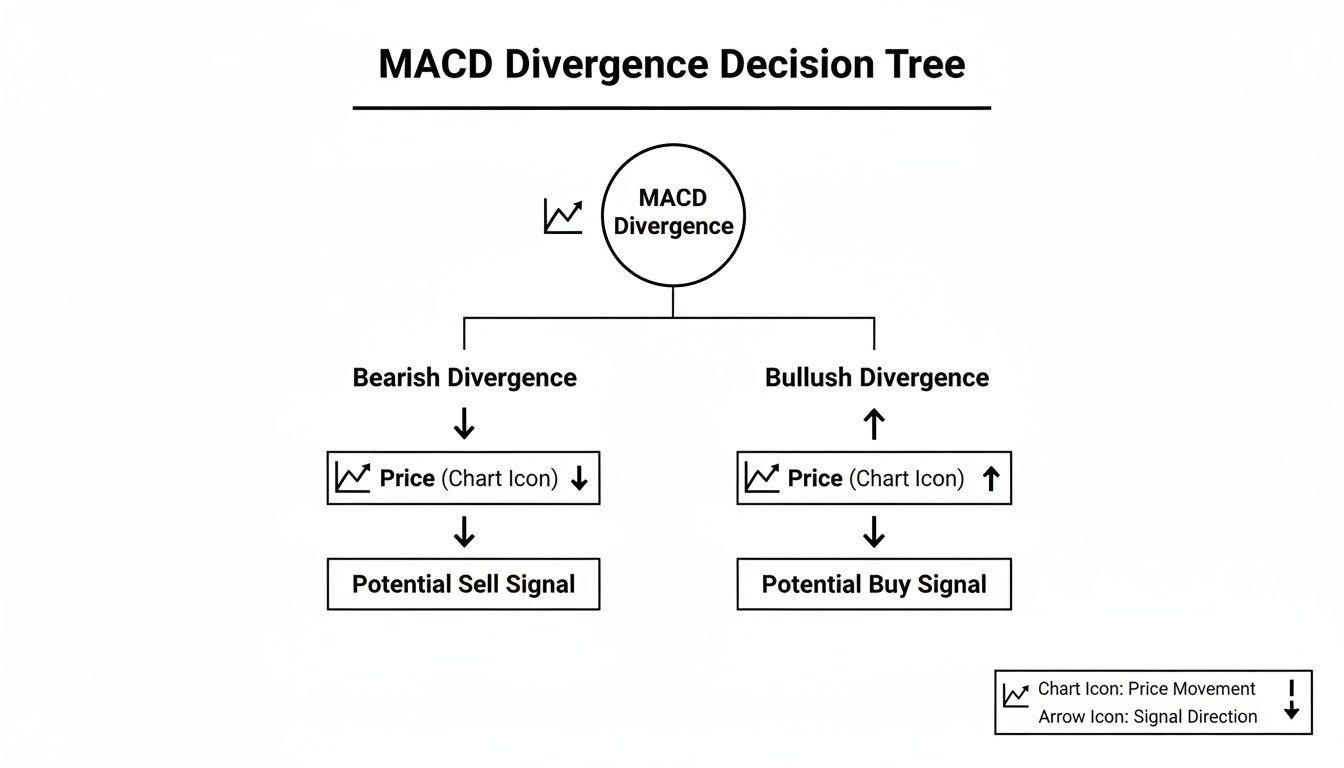
As you can see, the divergence is the first clue. The actual trigger for a trade entry should come from confirming the signal with price action.
A Practical Trading Plan Checklist
Use a checklist to ensure consistent execution. This simple tool forces you to verify every condition before risking capital.
Here is a sample five-point checklist:
- Market Condition: Is the market trending or ranging? MACD signals work best in trending markets.
- Higher Timeframe Bias: Check the 4-hour chart. Is the MACD above the zero line (bullish bias) or below it (bearish bias)? Only look for setups that align with this direction.
- Entry Signal: Do you have a clear MACD signal, like a trend-aligned crossover or a divergence at a key price level?
- Price Action Confirmation: Does price action confirm your signal? Wait for a confirming candlestick pattern or a break of a trendline. Never enter on an indicator signal alone.
- Risk Management: Where is your logical stop-loss? Place it beyond a recent swing high or low. What is your initial target? The next significant support or resistance level is a good starting point.
A complete trading plan defines where to get in, where to get out if you're wrong, and where to take profits if you're right. This framework is essential for serious trading.
For more guidance, our article on how to create a Forex strategy based on technical analysis can help you build a full plan. Understanding the tech behind your tools also provides an edge. For context, articles on fintech software development can explain how trading platforms are engineered.
FAQ: Common Questions About Reading the MACD
Here are answers to some of the most common questions traders have when learning how to read the MACD.
What are the best settings for the MACD?
The default setting of (12, 26, 9) is the standard because it offers a solid balance that works across most markets and timeframes. For beginners, it's best to stick with these settings. While some short-term traders may use faster settings like (5, 35, 5), this often leads to more false signals. Always backtest any changes to ensure they improve your specific strategy.
Is the MACD useful for scalping?
The MACD is less reliable on very low timeframes (like the 1-minute chart) due to market noise, which can cause frequent false signals. It becomes more effective on the 15-minute timeframe and higher. For scalping, it's better used as a confirmation tool to support signals from price action, rather than as a primary entry trigger. You can also explore other momentum tools, like the one discussed in our guide on what the VWAP indicator is.
Why do I get so many false signals from crossovers?
False signals are common if you are trading MACD crossovers in isolation. This usually happens for two reasons:
- Trading against the trend: A bullish crossover in a strong downtrend is likely to fail. Use the zero line as a trend filter to avoid this.
- Trading in a ranging market: The MACD is a trend-following indicator and will generate many false signals in sideways or choppy markets.
To filter out weak signals, look for confluence. Only consider crossovers that occur at key support/resistance levels or are confirmed by price action patterns.
Is the MACD a leading or lagging indicator?
The MACD is technically a lagging indicator because it is calculated using past price data from moving averages. However, MACD divergence can provide leading information. It acts as an early warning that momentum is weakening before the price itself has reversed, making divergence a powerful predictive tool for traders.
Ready to apply your MACD knowledge in the live markets? MyFundedCapital offers funding programs designed to help skilled traders succeed.