

 AR
AR
 NL
NL
 FR
FR
 DE
DE
 ES
ES
 IT
IT
 PL
PL
 SV
SV
 PT
PT

You're staring at a chart after a sharp selloff. Then one candle appears with a tiny body and a long upper wick, and your first thought is simple: is this the bottom, or just another fakeout?
That's where most traders get trapped. They see the candlestick inverted hammer pattern, buy too early, and learn the hard way that a shape alone doesn't reverse a market. This guide breaks it down in plain language so you can spot it, filter weak setups, and manage risk without guessing. Trading involves risk of loss, and this is educational only, not financial advice.
Introduction to the Inverted Hammer for New Traders
A common beginner mistake goes like this. Price has been falling for several candles, then one session spikes higher intraday, fades back, and closes near the low. The candle looks dramatic, so you assume buyers are stepping in and hit buy.
Sometimes that works. A lot of the time, it doesn't.
The reason is simple. The candlestick inverted hammer pattern is not a green light by itself. It's better treated as an alert that selling pressure might be weakening. “Might” is the key word.
Why this pattern confuses traders
The pattern sends mixed signals at first glance:
- Buyers showed up: Price pushed sharply upward during the session.
- Sellers still fought back: The close finished near the lower part of the range.
- The chart looks bullish and bearish at the same time: That's why people overread it.
If you're newer to trading, that conflict can feel frustrating. You want a clear answer from the chart, but this candle doesn't give one. It only tells you there was an attempt to reverse.
Practical rule: If you treat every inverted hammer as an entry signal, you'll end up buying into noise.
What matters more than the candle itself
Three filters matter more than the pattern's shape:
- Location: Did it form after a real decline, or just in the middle of a choppy range?
- Support: Did it print near an area where buyers have reacted before?
- Confirmation: Did the next candle prove that buyers actually kept control?
Those three questions separate useful setups from random candles.
A simple mindset shift
Don't ask, “Is this bullish?”
Ask, “Has the market done enough to prove this reversal idea deserves attention?”
That one shift changes how you read the pattern. Instead of predicting, you start verifying. That's a much better habit if you're trading forex, indices, crypto, or commodities.
What the Candlestick Inverted Hammer Pattern Really Is
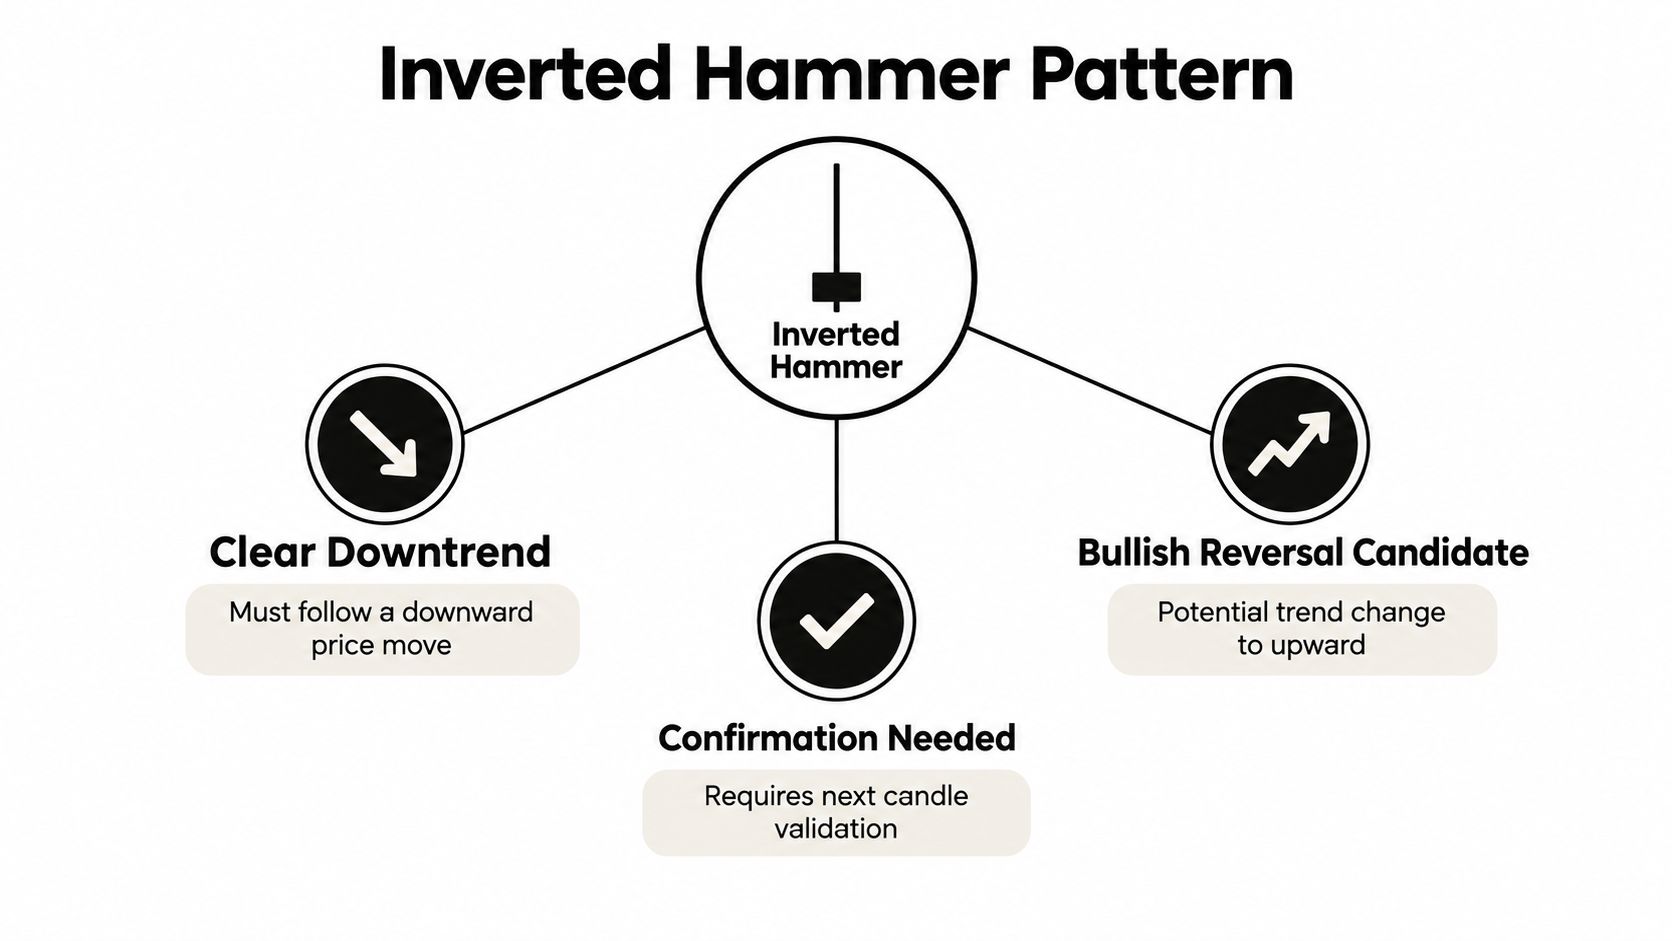
The candlestick inverted hammer pattern is a single-candle bullish reversal candidate that appears after a downtrend. It has a small real body near the session low, a long upper shadow, and little to no lower shadow according to CMC Markets' inverted hammer overview.
The easy way to understand the shape
Think of the session like a hill sprint.
Buyers ran price uphill fast during the candle. Then they lost momentum before the close, and sellers pushed price back down. Buyers didn't win the whole session, but they showed enough strength to interrupt the prior decline.
That's why the long upper wick matters. It shows upward pressure appeared during a bearish phase.
The pattern only matters after a decline
Many traders slip. The same candle shape can appear anywhere on a chart, but it's only called an inverted hammer when it forms after a clear downtrend.
If the market is moving sideways, the candle is less meaningful. If price is already rising, the same shape is read differently.
Here's the short version:
- After a downtrend: possible bullish reversal candidate
- Inside a range: often just noise
- After an uptrend: it may resemble a different warning signal entirely
Why traders around the world use the same rules
Modern technical analysis references widely describe the inverted hammer as a one-bar bullish reversal pattern rooted in Japanese rice-market charting. Its use in Western trading literature was standardized through Steve Nison's 1991 book Japanese Candlestick Charting Techniques, which helped define two core rules for English-language traders: it must appear after a decline, and it needs confirmation from the next session before being treated as a reversal signal, as outlined in LuxAlgo's inverted hammer concept guide.
That history matters because it explains why traders in different markets still look for the same structure.
- Equities traders watch it after selloffs.
- Forex traders watch it near support.
- Crypto traders watch it after fast liquidation moves.
- Commodity and index traders use it as a momentum-exhaustion clue.
If you want a broader foundation in candle structure, this guide on understanding candlestick patterns helps place the inverted hammer in the bigger picture.
The pattern is global because it describes trader behavior, not one specific market.
Anatomy and Key Rules That Define a Valid Signal
Recognition gets easier when you stop thinking in vague terms like “long wick” and start using a checklist. A valid inverted hammer has a few structural rules that keep you from labeling every odd-looking candle as a setup.
The three shape rules that matter most
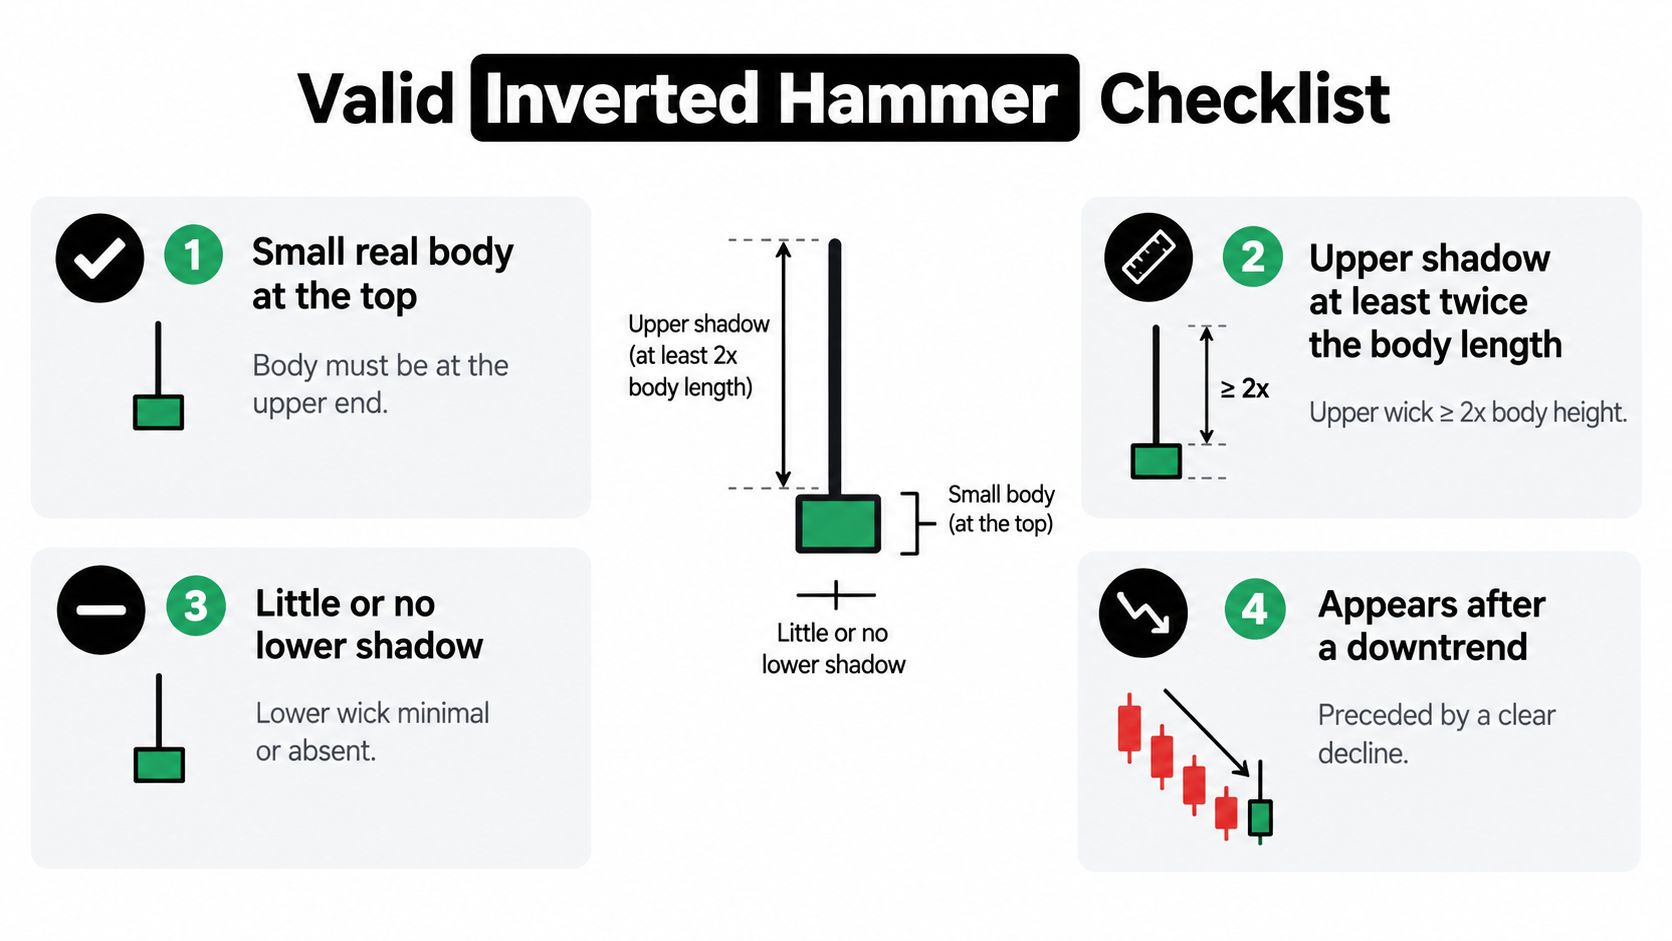
Across technical references, traders usually define the pattern this way:
- Small real body: The body should sit near the lower end of the candle's range.
- Long upper shadow: The upper wick is generally at least twice the body length, a rule highlighted by CandleScanner's inverted hammer research and definition.
- Minimal lower shadow: Little or no lower wick.
The body color is less important. Several trading references note that a green body is preferred but not required. Geometry matters more than color, as summarized in FundedFast's inverted hammer explanation.
What the candle is saying under the hood
The pattern reflects a session where buyers managed to push price much higher, but sellers dragged it back down before the close. That's why it's best seen as an exhaustion alert, not a buy signal.
A lot of new traders misread the wick. They assume a long upper wick always means rejection and therefore bearishness. Context changes that interpretation.
After a decline, a long upper wick can also mean buyers are finally pushing back.
Inverted hammer versus lookalikes
Chart reading gets practical. The inverted hammer often gets confused with other one-candle patterns that look similar but mean something different.
| Criterion | Valid Inverted Hammer | Not Valid |
|---|---|---|
| Prior trend | Appears after a clear downtrend | Forms in a random range or after an up move |
| Body position | Small body near the lower end of the range | Body sits in the middle or high without proper context |
| Upper shadow | At least about 2x the real body | Upper wick is too short to stand out |
| Lower shadow | Minimal or absent | Lower wick is large and changes the structure |
| Meaning | Bullish reversal candidate | Usually just indecision or a different pattern |
Don't confuse these three candles
- Inverted hammer: Same shape, but after a decline. Bullish reversal candidate.
- Shooting star: Similar shape, but after an uptrend. Bearish reversal candidate.
- Hammer: Bullish reversal shape too, but the long wick is below the body, not above it.
If you want to compare it with its close cousin, review this breakdown of the bullish hammer candle.
A valid inverted hammer is defined less by what it looks like in isolation and more by where it appears and how cleanly it meets the geometry.
How to Confirm the Pattern Before You Trade
The fastest way to ruin this setup is to buy the candle as soon as it closes. The shape can hint at a reversal, but it doesn't prove one. Confirmation is what turns the idea into a trade candidate.
What confirmation actually looks like
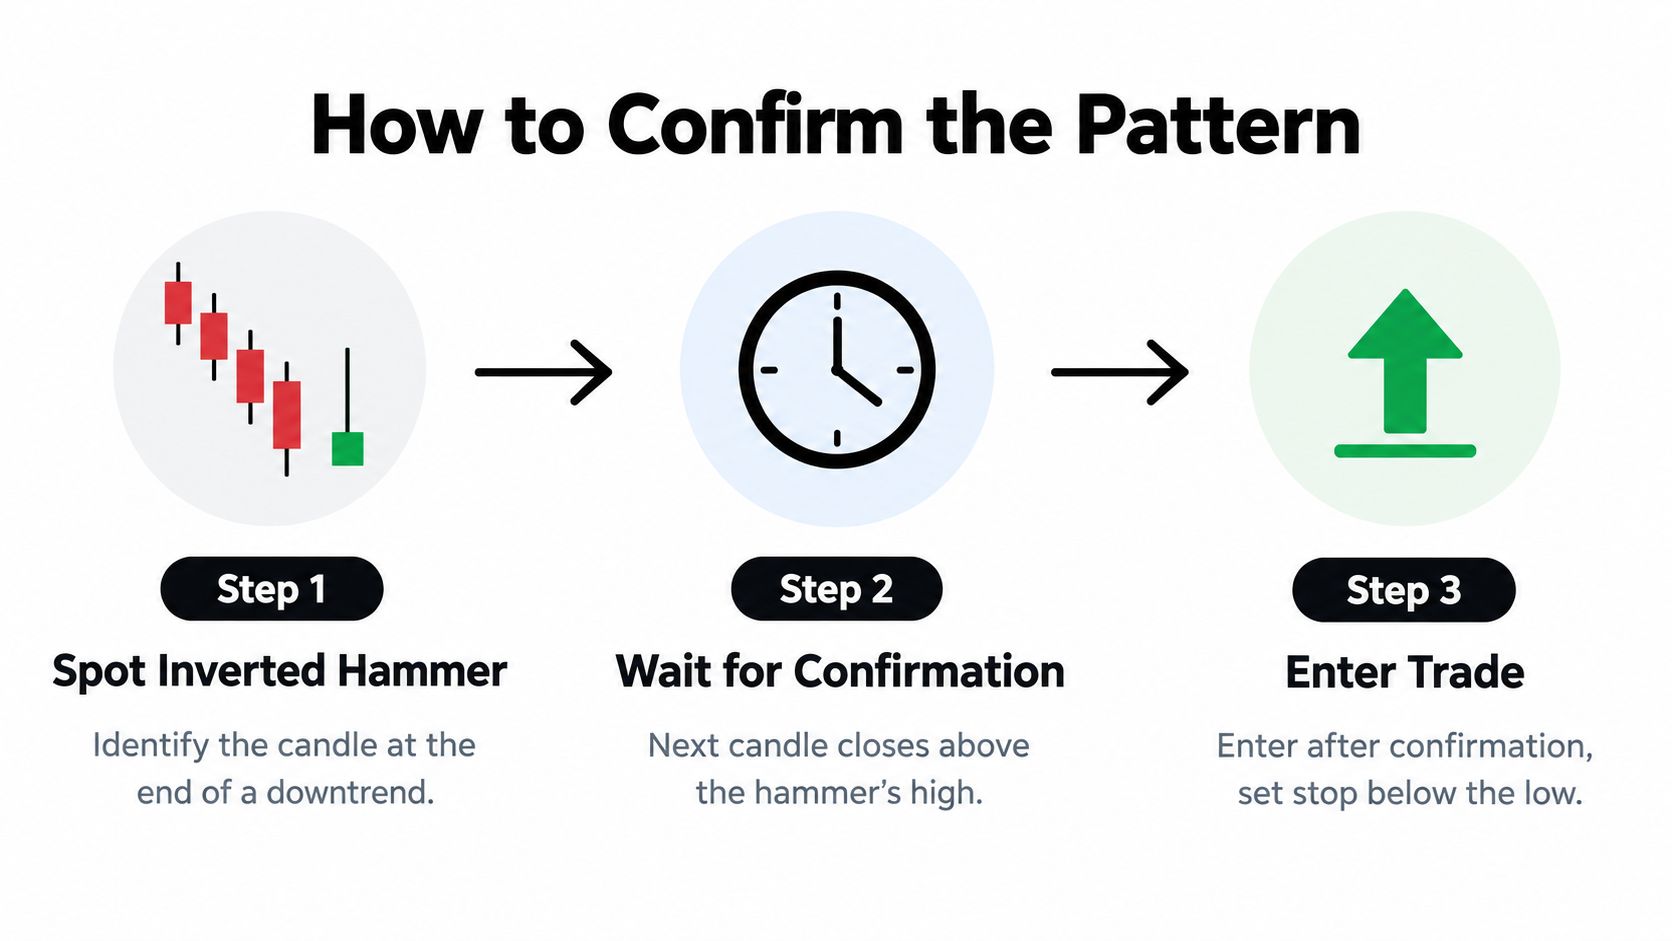
Traders commonly wait for one of these signals on the next bar:
- A bullish close above the pattern's high
- A gap higher
- A break above the inverted hammer's high
Some trading guides go even further and say the next candle's close should be higher than the inverted hammer's high, which is one of the confirmation rules described by CentralCharts' inverted hammer reference.
That matters because it answers one key question: did buyers keep control after the first attempt?
Why shape alone fails
An inverted hammer can form because of short covering, thin liquidity, random volatility, or a quick news reaction that doesn't hold. The candle doesn't tell you which one it was.
Confirmation helps you avoid the weakest prints:
- If price closes above the high: buyers followed through
- If price stalls below the high: the market may still be weak
- If the next bar reverses lower: the pattern failed quickly
That's a cleaner way to think than trying to predict from one candle.
Regime matters more than most guides admit
A frequently missed point is that pattern quality changes with market conditions. Academic work on candlestick patterns often finds weak or no predictive power once transaction costs, liquidity, and regime are considered. One 2026 study reported hammer confirmation rates dropping from 67.3% in stable periods to 44.4% in crisis periods, as discussed in this 2026 market-regime study.
That doesn't mean the pattern is useless. It means you should treat it as context-dependent.
Here's a simple filter:
- Take it seriously when it appears after a clean decline, near support, and gets confirmed.
- Ignore it when it appears mid-range, during headline chaos, or in thin conditions.
- Be more selective when volatility expands and candles become noisy.
If you also use participation clues, this primer on volume analysis trading can help you judge whether the move had real interest behind it.
Don't ask whether the candle is bullish. Ask whether the next candle proves buyers stayed in control.
Risk Management and Trading the Pattern Step by Step
The best use of the inverted hammer isn't prediction. It's risk definition. The candle gives you a clear trigger, a clear invalidation point, and a simple way to decide whether the trade is worth taking.

A basic trade workflow
Use this process every time. It keeps you from improvising.
Mark the trend
Price should already be declining. If you can't clearly point to lower highs, lower lows, or steady bearish movement, skip it.
Mark nearby support
Look left on the chart. Was this candle printed near a prior swing low, reaction zone, or psychological level? If not, the setup is weaker.
Check the candle structure
The body should be small, the upper wick should stand out, and the lower wick should be minimal.
Wait for confirmation
Don't enter just because the candle looks good. Let the next bar prove the reversal idea.
Plan your stop
Many traders use the low of the inverted hammer as the invalidation level. That matches the practical framework described by Equiti's inverted hammer trading note.
Set a realistic target
Good first targets include nearby resistance, the last lower high, or a preplanned risk-reward multiple.
A plain-language example
Say a market has been selling off into support. An inverted hammer forms there. The next candle breaks and closes above the inverted hammer's high.
A basic plan could look like this:
- Entry: on the confirmation break or close
- Stop: below the inverted hammer low
- Target: prior swing resistance or the next obvious reaction area
That doesn't guarantee a win. It gives you a defined trade.
Risk rules that keep one bad trade small
A pattern setup is only as good as your discipline. Keep these rules simple:
- Risk small: Use position sizing so one loss doesn't damage your week.
- Respect invalidation: If price breaks below the low, the setup is wrong for now.
- Avoid forcing trades: If confirmation is weak, pass.
- Know your environment: News spikes, wide spreads, and low-liquidity sessions can distort candle patterns.
If you trade in a prop-style environment, discipline matters even more. Clear guardrails like a 5% daily loss limit and up to 10% maximum drawdown can force better behavior because one impulsive trade can hurt your overall performance. Those limits don't make the pattern better, but they do make your decision process cleaner.
Your edge isn't the candle alone. Your edge is taking only the clean versions and cutting the failed ones quickly.
Real Trading Examples Across Timeframes and Markets
The pattern shows up across markets, but it doesn't behave the same way everywhere. Wick size, volatility, and confirmation distance can change a lot between forex, indices, and crypto.
Forex on the 1-hour chart
A currency pair has been sliding for most of the session. It reaches a level where buyers reacted earlier in the week, and a clean inverted hammer forms with a small body and long upper wick.
The next one-hour candle closes above the pattern's high. That's your confirmation.
A trader taking this setup might enter on the break, place a stop below the candle low, and aim for the nearest lower-high area from earlier in the decline. In forex, this kind of setup often works best when the move isn't happening right into a major scheduled event.
Index on the daily chart
An index sells off for several days and tags a prior support zone. A daily inverted hammer appears, but the next session opens flat and struggles for most of the day.
That hesitation matters. The shape looked promising, but the follow-through didn't show urgency from buyers. A patient trader waits. If the market later closes firmly above the high, the setup becomes tradable. If it rolls over first, no trade.
This is a good reminder that the pattern doesn't owe you an entry. Sometimes the smartest action is no action.
Crypto on the 4-hour chart
Crypto often produces dramatic wicks, so filtering matters even more. A coin drops hard into support on the 4-hour chart, then prints an inverted hammer. The next candle breaks above the high, so the trade triggers.
At first the move works. Then volatility snaps back and price reverses, hitting the stop below the low.
That's still a valid trade. The setup met the rules, the risk was defined, and the loss stayed controlled. This is the part many traders need to hear: a good setup can still lose.
What these examples teach
- Forex: Confirmation can be cleaner, but session timing matters.
- Indices: Daily signals can be stronger, but they often require patience.
- Crypto: The pattern appears often, but noise is higher and false breaks are common.
The same framework applies across all three. You're not trying to find a magical candle. You're trying to find a clear downtrend, a sensible location, and proof that buyers followed through.
Frequently Asked Questions and Your Next Steps with MyFundedCapital
Is an inverted hammer the same as a shooting star
No. The shape can look almost identical, but the trend context changes the meaning. An inverted hammer appears after a decline and suggests a possible bullish reversal. A shooting star appears after an advance and warns of possible bearish reversal.
Does the candle body need to be green
No. Color is secondary. A green body can be preferred by some traders, but the more important factors are the candle's location, the long upper wick, the small body, and the downtrend context.
Why does the pattern fail more often in messy markets
Because the shape alone can't tell you whether the move came from real buying pressure or short-term noise. In volatile conditions, candles can stretch and snap back quickly, which makes fake reversals more common. That's why confirmation and market regime matter so much.
Should I use the inverted hammer by itself
That's usually a weak approach. It works better as part of a simple decision process that includes trend, support, and confirmation. If you create trading education or market commentary for clients, studying how others build trust-focused messaging can help. This resource on content strategy for financial advisors is useful for seeing how complex financial topics get explained clearly without hype.
The big takeaway is simple. The candlestick inverted hammer pattern is best treated as an alert, not a buy button. Wait for the market to prove the idea, define your risk before you enter, and stay selective. Trading involves risk of loss, and this article is educational only, not financial advice.
If you want to apply that same risk-first mindset in a prop environment, MyFundedCapital offers Instant Funding plus 1-Step and 2-Step Challenges from $5K to $100K, with scaling paths up to $500K. You can compare account types, profit split options from 80/20 up to 100%, and payout schedules, then choose the setup that fits how you trade the markets.
