ES
ES
 DE
DE
 FR
FR
 AR
AR
 IT
IT
 NL
NL
 PL
PL
 SV
SV

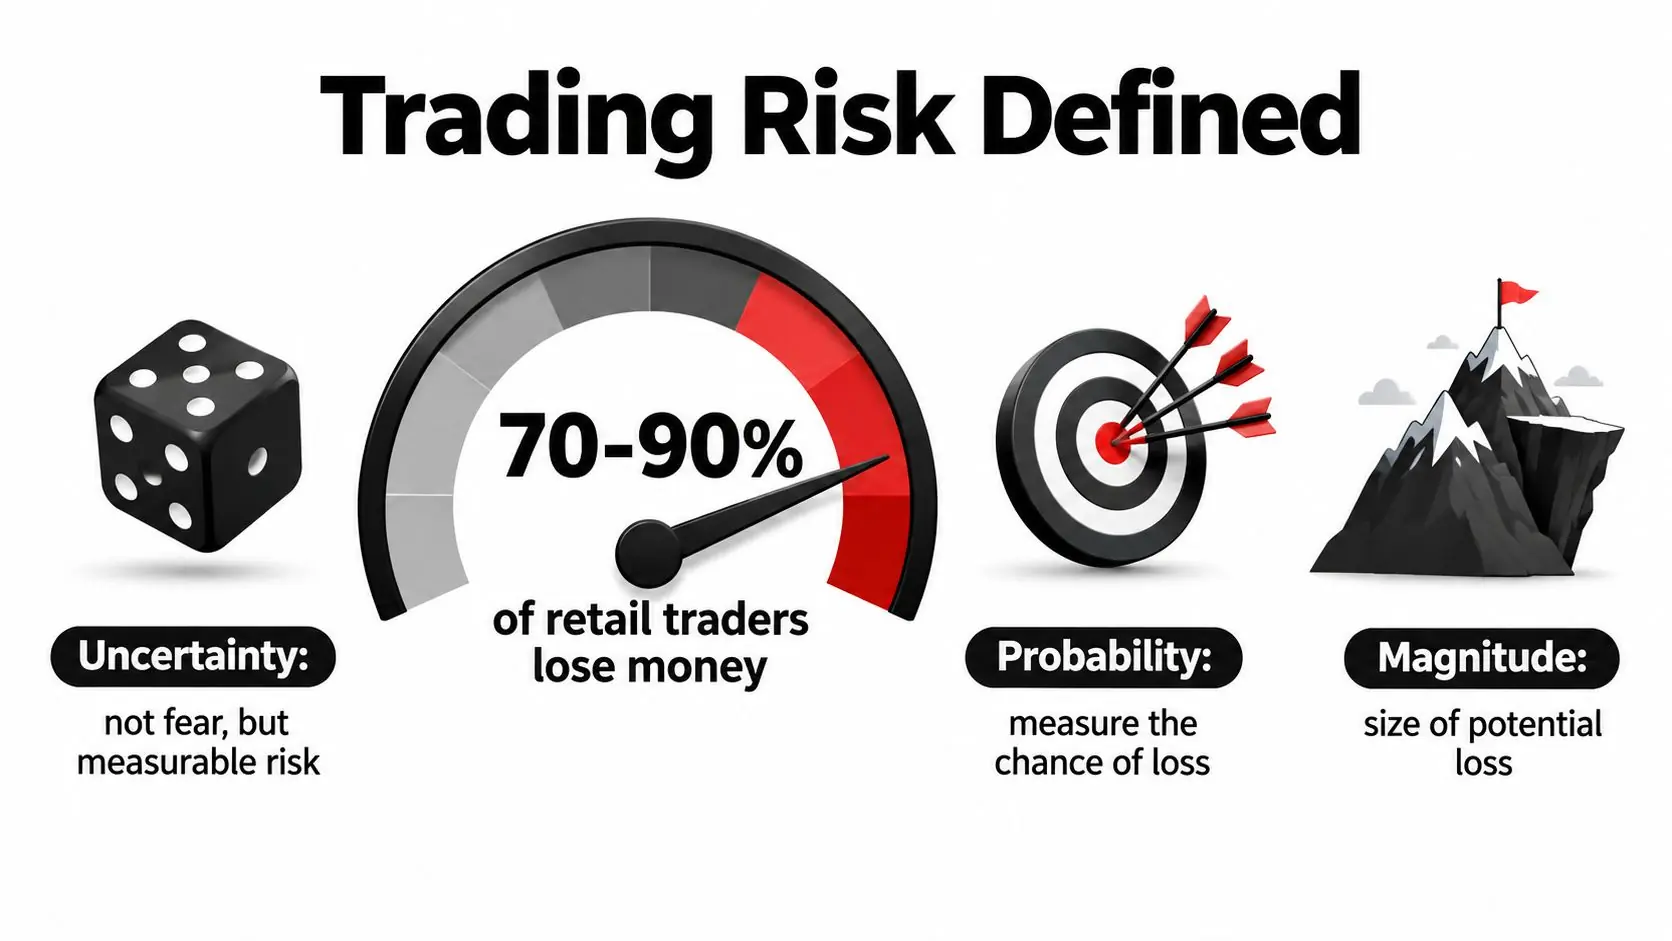
Trading risk is the probability and magnitude of financial loss from a market position, and it's shaped by margin, position sizing, volatility, and execution quality, not just by market direction. That matters because broker disclosures across major markets commonly show that 74% to 89% of retail CFD and forex accounts lose money, so trading risk isn't a side topic. It's the whole game (retail trader loss-rate data).
Most beginners think risk means, “I might be wrong on direction.” That's only one slice of the problem. A trader can call the trend correctly and still lose through bad sizing, poor fills, wide spreads, or a stop that makes no sense for current volatility. If you want a straight answer to what is trading risk, think of it as a system of pressures acting on your account every time you click buy or sell.
What Trading Risk Really Means for Active Traders
A hard truth sits underneath every active trading account. On most days, your biggest threat is not being wrong about direction. It is being wrong about how much damage one trade can do.
That distinction matters because trading risk is not one thing. It is a bundle of moving parts that push on your account at the same time. Price can move against you. The spread can widen. Your order can fill worse than expected. Your strategy can fail in live conditions even if it looked solid in testing. You can also break your own rules, lose connection, or misplace a stop with one bad click.
Risk is account damage, not market drama
A red candle looks dangerous because it is visible. Real risk is more specific. It is the amount your account can lose, the speed of that loss, and the chance that normal market noise knocks you out before your idea has room to work.
A beginner often asks, “Will this trade win?” A disciplined trader asks three better questions first:
- How much can I lose if I am wrong?
- What metric will tell me that risk is rising?
- What rule forces me to stop before one bad session becomes a blown account?
That is the shift from opinion to control.
A useful analogy is a small leak in a boat. The wave is the market move. The leak is everything else that makes the damage worse. If your position size is too large, your stop is too wide for the account, or your fills are sloppy, you do not sink because of one wave. You sink because the boat was fragile before the wave hit.
The real moving parts behind trading risk
For active traders, risk usually comes through five channels, and each one can be measured.
- Market risk how much you lose if price reaches your stop
- Liquidity risk how costly it is to enter or exit near your intended price
- Execution risk the gap between the price you planned and the price you get
- Model risk the gap between how your strategy was supposed to behave and how it behaves live
- Operational risk mistakes, outages, platform issues, or rule breaches that create losses without any edge case on the chart
This breakdown matters because each type of risk needs a different fix. A trader who blames “the market” for every loss usually misses the cause. If the setup was fine but slippage doubled the loss, that is an execution problem. If the strategy falls apart only during news spikes, that points to model risk or liquidity risk. If you hit a daily loss cap because you revenge traded after two losers, that is operational risk wearing a human face.
Why prop-firm rules make this easier to understand
Prop firms turn abstract risk into hard boundaries. Daily loss limits, maximum drawdown rules, and consistency targets are not random hoops. They are simple enforcement tools tied to measurable risk.
If a firm says you cannot lose more than 5% in a day or 10% overall, it is forcing you to respect account damage as the main scorecard. That rule does not care whether your entry looked clever. It cares whether your process kept losses small enough to survive.
The same logic applies to your own account. Risk becomes manageable when you can name the type, attach a metric to it, and cap it with a rule.
Practical rule: Before you enter, write down your stop price, dollar risk, and the account rule that would make you stop trading for the day.
Good traders survive by measuring what can hurt them
Institutions learned long ago that price exposure has to be measured, limited, and reviewed. The Basel framework's Market Risk Amendment formalized that mindset for financial firms by treating moves in rates, foreign exchange, equities, and commodities as measurable threats to capital (Basel market risk milestone).
Retail traders need the same habit on a smaller scale. Stop treating risk like a mood. Treat it like a number with a limit attached.
The Main Types of Trading Risk You Will Face
Most traders only name one kind of risk: price moved against me. Real trading is messier than that. Losses come from several different channels, and if you mislabel the problem, you'll apply the wrong fix.
Five Types of Trading Risk at a Glance
| Risk Type | Main Driver | Everyday Analogy | Key Metric |
|---|---|---|---|
| Market risk | Price moving against your position | Sailing into a current you can't see | Planned loss at stop |
| Liquidity risk | Not enough buyers or sellers near your price | Trying to sell a concert ticket after the show started | Spread and fill quality |
| Execution risk | Slippage, requotes, order mistakes | Someone mishearing your order | Difference between expected and actual fill |
| Model risk | Strategy logic failing in live conditions | A GPS using an outdated map | Live performance vs tested assumptions |
| Operational risk | Human or technical failure | The plumbing failing in a house | Rule violations, outages, access failures |
Market risk is the obvious one
This is the basic risk that price moves the wrong way after you enter. Long EUR/USD and it drops. Short an index and it rallies. Every trader understands this one first because it's visible on the chart.
What newer traders often miss is that market risk isn't just direction. It's direction multiplied by your size and your stop distance.
Liquidity risk shows up when the exit gets ugly
You want out, but not enough participants are available near your price. That usually means a wider spread, partial fills, or a fill far worse than expected.
This matters around news, session opens, and thin market conditions. On paper your stop looked reasonable. In practice, poor liquidity can make the exit much worse.
Liquidity risk punishes traders who assume every position can be closed cleanly at the marked price.
Execution risk is the gap between plan and fill
You clicked at one price and got another. Or you entered the wrong size. Or the platform lagged at the worst moment. That's execution risk.
A beginner often blames “bad luck” here. A better response is to track whether your live fills consistently differ from your planned entries and exits. If they do, your process needs work.
Model risk is quieter and more dangerous than people think
A strategy can look solid in backtesting and then fail in live markets. Conditions change. Correlations shift. Volatility behaves differently. The model wasn't built for what the market is doing now.
That's especially true for traders using indicators, automation, or pattern rules without understanding the assumptions underneath them.
Operational risk is the human and technical plumbing
This covers platform outages, internet issues, password theft, emotional overrides, and process failures. A trader can have a decent strategy and still lose because they broke their own rules or couldn't access the platform at the wrong time.
If you trade online, account security belongs here too. If you want a practical example of how teams think about identity and abuse controls, this guide on how to detect fraud without adding friction is useful because it shows how risk control often starts before the transaction itself.
How Traders Measure Risk With VaR and Drawdown
Definitions are helpful, but traders need numbers. Two of the most useful risk metrics are Value at Risk (VaR) and drawdown. They answer different questions, and if you confuse them, you'll misread your account health.
What VaR tries to estimate
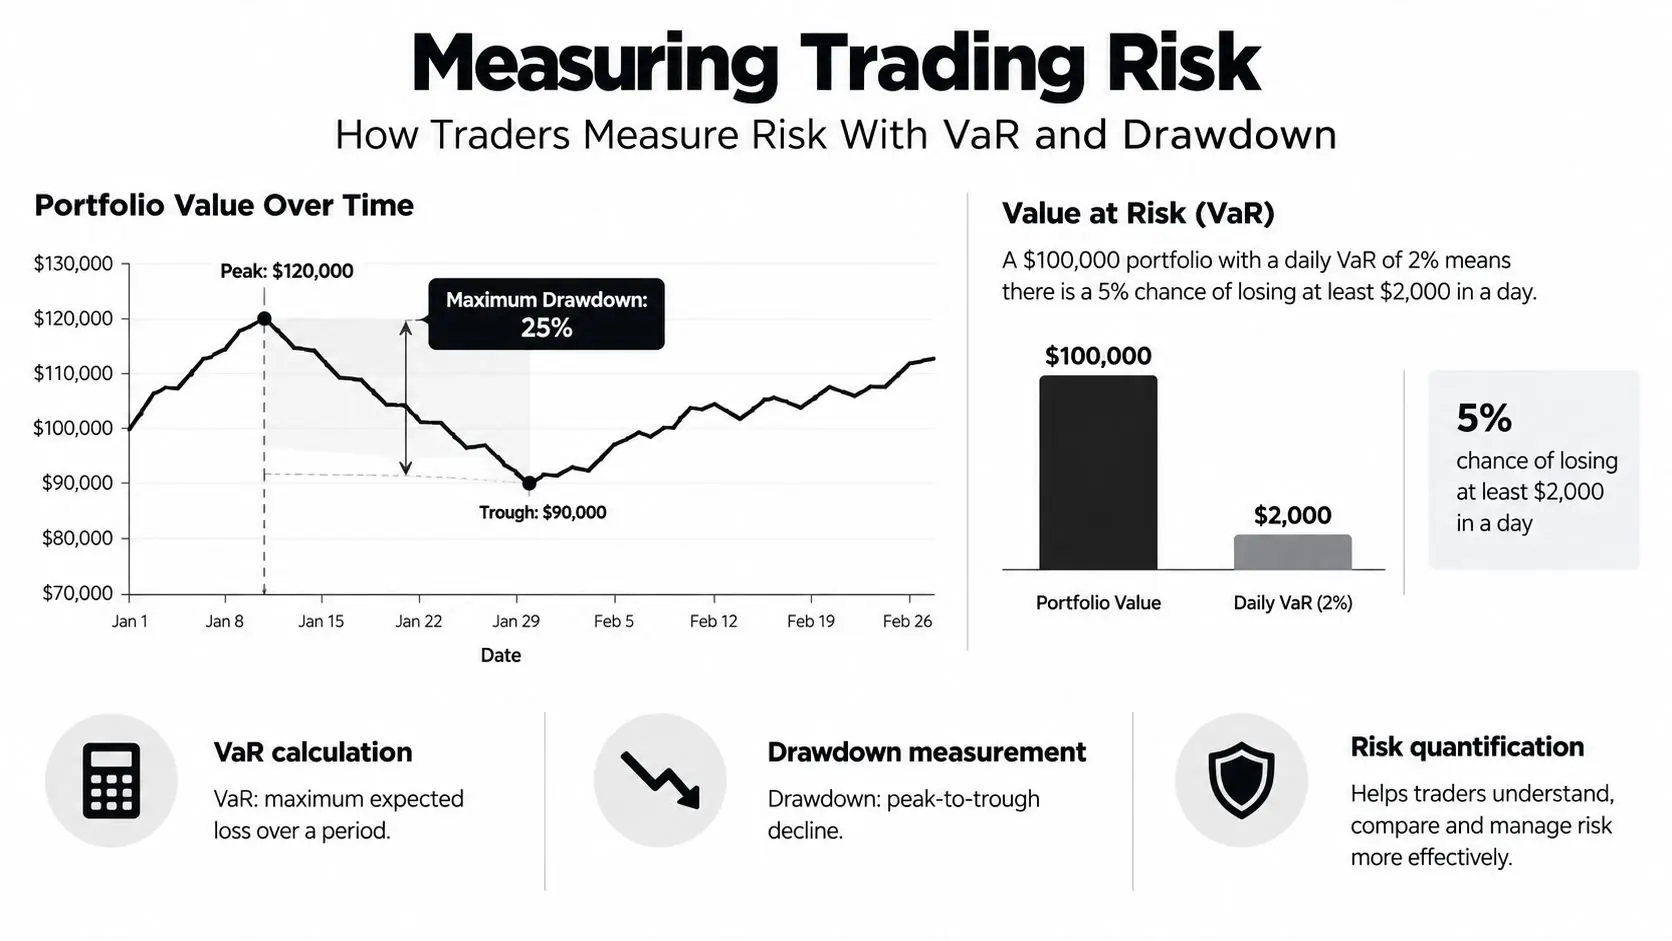
VaR asks: under normal conditions, what's a loss amount you probably won't exceed over a set period?
Use a simple example. A $100,000 portfolio with a daily VaR of 2% means there is roughly a 5% chance of losing more than $2,000 in a day. That doesn't predict the exact loss. It gives you a boundary for routine risk planning.
VaR is useful because it forces you to think in account-level dollars, not just chart patterns.
What drawdown tells you that VaR doesn't
Drawdown measures the drop from a portfolio peak to a later trough. It captures cumulative damage over time.
If a portfolio rises from $100,000 to $130,000 and then falls to $91,000, the peak-to-trough drawdown is 30%. That number often feels worse than VaR because the trader isn't just absorbing a loss. They're watching previous gains disappear too.
| Metric | What it measures | Best use |
|---|---|---|
| VaR | Expected single-period loss under normal conditions | Daily risk framing |
| Drawdown | Peak-to-trough account decline over time | Strategy survival and pain tolerance |
Keep this distinction clear: VaR estimates a probable loss window for a period. Drawdown records the actual account damage after a sequence of losses.
For newer traders, drawdown is usually the more honest metric. It reflects what your equity curve really did, not what a model said might happen.
If you want a clean walkthrough of drawdown math and why traders track it so closely, Yield Seeker's maximum drawdown guide gives a solid companion explanation.
A Real Example of Position Sizing Gone Right and Wrong
A trader's opinion on the market can be identical in two accounts and produce completely different outcomes. Position sizing is why.
Take a $50,000 account. You find a EUR/USD setup and place a 50-pip stop. If you follow a 1% risk rule, your maximum loss is $500. That's the number you fix first. Then you size the trade so a stop-out equals that amount.
1% vs 10% Position Sizing on the Same $50,000 Trade
| Metric | 1% Risk Setup | 10% Risk Setup |
|---|---|---|
| Account size | $50,000 | $50,000 |
| Risk per trade | $500 | $5,000 |
| Stop distance | 50 pips | 50 pips |
| Position size logic | Sized so stop-out equals planned loss | Oversized so one stop-out hits hard |
| Result of one losing trade | Manageable business expense | Serious account damage |
On a common FX pair like EUR/USD, that $500 risk with a 50-pip stop works out to roughly 1.0 standard lot. The exact sizing depends on the instrument and pip value, which is why using a proper position size calculator beats mental math when speed matters.
What goes wrong at 10%
Now run the same idea with 10% risk. Same chart. Same stop. Same thesis. Your maximum loss becomes $5,000.
That's the trap. The market view didn't get worse. The risk structure did.
A trader who risks too much usually tells himself he's being “aggressive” or “convicted.” What he's really doing is making normal variance feel catastrophic.
- At 1% risk You can take a loss, review the trade, and keep functioning.
- At 10% risk One routine stop can wreck your week and scramble your decision-making.
- Recovery gets harder fast A 20% account loss needs a 25% gain to recover. A 50% loss needs 100% just to get back to even.
Good traders don't avoid losses. They make sure a normal loss stays normal.
Practical Risk Management Rules You Can Apply Today
A trading plan is only useful if it still works on your worst day. Fatigue, frustration, and overconfidence all distort judgment. Rules protect you from yourself when your brain starts bargaining.
The practical goal is simple: turn vague caution into numbers you can enforce. Risk is not one blob. It comes from different failure points. Market risk shows up in how far price can move against you. Liquidity risk appears when exits get thin and slippage widens. Execution risk shows up when your fill is worse than your plan. Model risk appears when a setup stops behaving the way your backtesting suggested. Operational risk is the boring one traders ignore until a platform freeze, bad internet connection, or wrong order ticket costs real money.
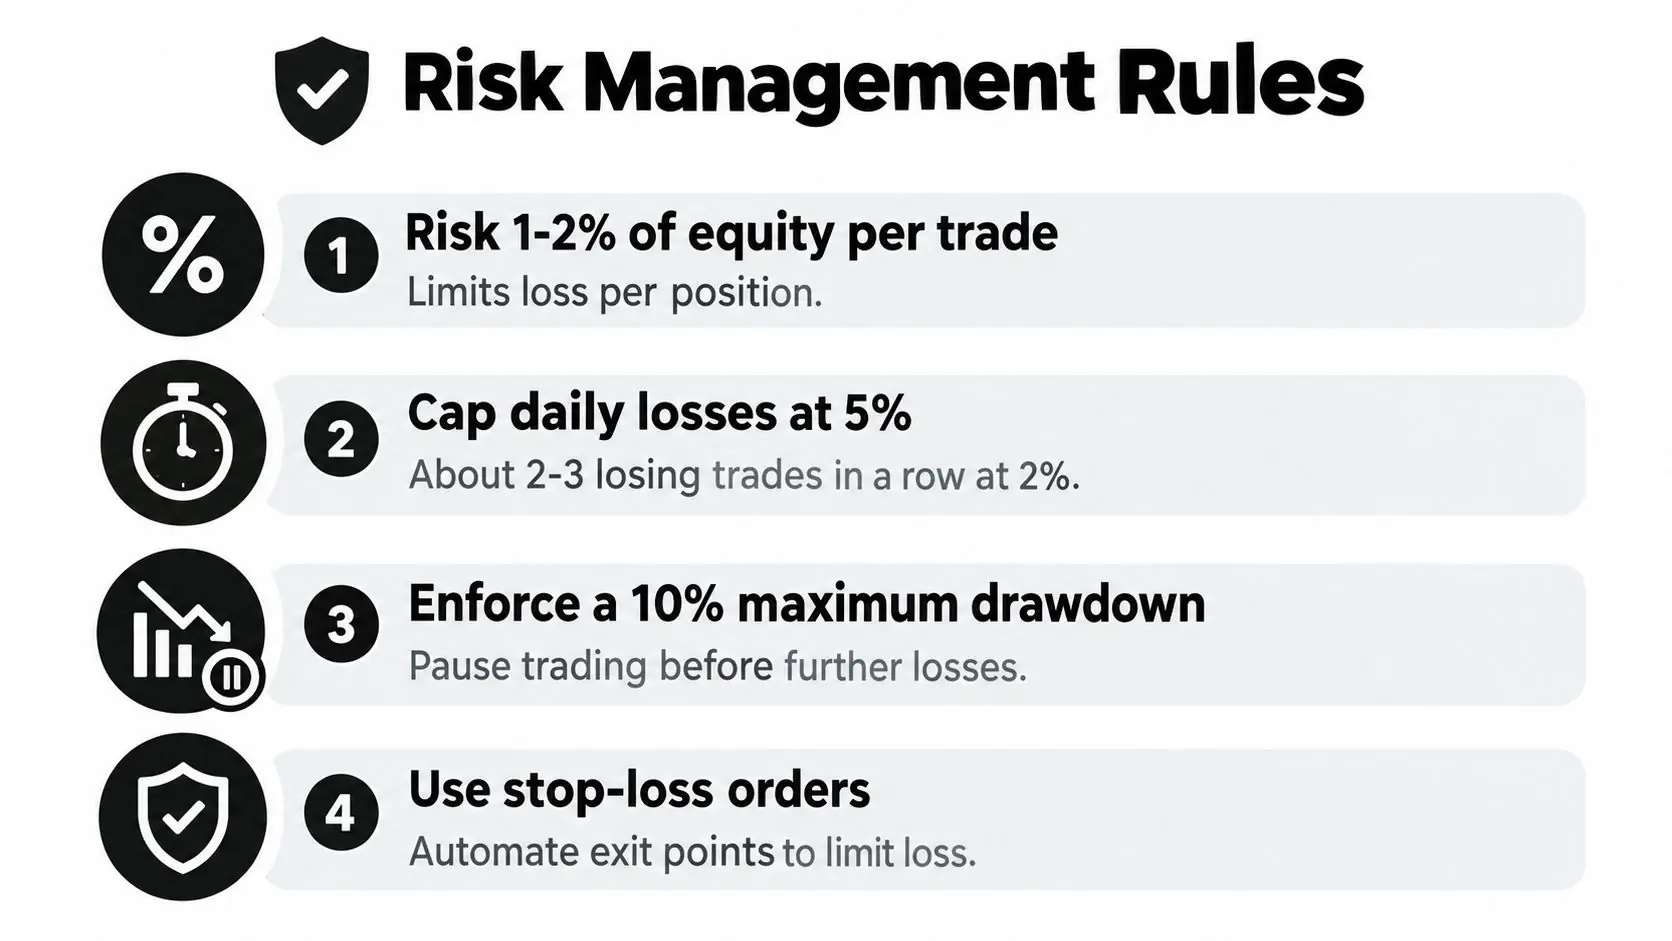
A good rulebook gives each of those risks a measurable boundary. Market risk gets capped by your maximum loss per trade. Liquidity and execution risk get handled by smaller size around news and thin sessions. Model risk gets handled by pausing after a string of losses and reviewing whether your edge still exists. Operational risk gets handled with plain habits: correct order size, stop entered immediately, and no trading when your platform or connection is unstable.
The rules worth writing down
- Cap risk per trade Keep planned loss around 0.5% to 2% of account equity. Smaller is usually better when conditions are unstable.
- Set a daily loss limit Many disciplined traders stop for the day after losing a small fixed share of equity. That rule matters because daily damage often comes from the second bad decision, not the first.
- Cut size during drawdowns If your account is down meaningfully from its high, reduce risk until performance stabilizes.
- Place the stop immediately A stop entered after the trade is entered is late risk control.
- Check total exposure Three positions built on the same dollar theme can act like one oversized trade.
Prop firms make these rules painfully concrete. A trailing drawdown, a static drawdown, and a daily loss cap are just hard versions of the same idea: your risk budget has a ceiling. If your daily limit is 3% and you already lost 2%, your next trade cannot be sized like your first trade of the morning. The account may allow the order. Your risk rules should not.
Adjust for volatility instead of arguing with it
Volatility changes the size your account can safely carry. A 20-pip stop in a quiet session may be reasonable. The same 20-pip stop before a major rate decision can be little more than noise. In FX and CFD trading with margin, that difference matters because fast moves can push losses past the exit you expected.
A simple habit helps. Start with the dollar amount you are willing to lose, then build the position around the stop distance and current volatility. ATR can help here because it gives you a rough sense of the instrument's recent breathing room. Wider conditions usually call for smaller size. Tighter conditions can support larger size, but only if liquidity is normal and spreads are not blowing out.
A short pre-trade checklist
Before you click buy or sell, check five things:
- Market risk What is the exact maximum loss if the stop gets hit?
- Liquidity risk Is this a thin session, a news window, or a market where spreads can widen suddenly?
- Execution risk Can slippage turn this planned loss into a larger real loss?
- Model risk Is this setup still performing like it did in your journal, or are you forcing trades?
- Operational risk Did you enter the right size, the right stop, and the right direction?
That checklist sounds basic. It is supposed to. Cockpit checklists are basic too, and pilots still use them because memory gets unreliable under pressure.
If you want more process-driven examples, browse risk management advice from traders who focus on controlling losses instead of predicting every move. For a trading-specific reference point, MyFundedCapital also publishes forex risk management strategies built around the same principle: define the loss first, then size the trade.
Why Leverage Is the Quiet Killer of Retail Accounts
Small price moves wipe out retail accounts every day, and the trigger is often not a bad idea but too much borrowed exposure on a decent idea.
That is the part beginners miss. Borrowed capital does not improve your entry, your timing, or your edge. It only makes every tick matter more. A trade that would have been a manageable paper cut in a cash-only position can become a broken nose once the position size is inflated.
Here is the practical problem. Active traders do not lose only from market risk. They also get hit by execution risk and liquidity risk. If you are oversized, a normal spread change, a quick slip on the fill, or a brief spike into your stop can push the loss far past what you planned. The market did not need to collapse. It only needed to move enough to expose weak sizing.
What borrowed capital actually does to your account
Borrowed exposure compresses your margin for error.
Say your account is $10,000 and your rule is to risk 1% per trade, or $100. If your stop is 50 pips away, your size should be built so a full stop costs about $100. Many retail traders reverse that process. They pick a big position first because the potential profit looks exciting, then force a stop around it. That turns ordinary market noise into an account-level threat.
A trader can call the direction correctly and still lose money because the position is too large to survive the path price takes before the move works. That matters even more in fast markets, where slippage and gaps turn a planned loss into a larger real loss.
A sane way to use borrowed exposure
Start with the loss limit, not the broker maximum.
Ask a blunt question: if price jumps against me and my exit is worse than expected, does this trade still fit inside my risk budget and my daily loss cap? If the answer is no, the size is wrong. The platform allowing it means nothing. Prop firms understand this well, which is why they convert risk into hard rules such as maximum daily loss and overall drawdown. Those rules are just account survival math written into a dashboard.
If you want a plain-English explanation of how borrowed exposure works in currency markets, read this guide on understanding borrowed capital in forex trading.
Trading Risk Questions Traders Ask Most Often
How much leverage is sane for a retail trader?
Use less than you want, not as much as you can get. The practical answer is to cap exposure at a level where routine adverse movement doesn't violate your per-trade risk rule.
In volatile conditions, educational guidance points traders toward roughly 1:1 to 2:1 as a defensive range, especially when ranges are expanding and gap risk is high, as noted earlier in the volatility section. That's a very different mindset from maxing out broker limits.
What daily loss limit should a trader respect?
A hard daily stop matters because decision quality tends to collapse after a sharp loss. Many funded-trader environments make this explicit with a flat daily loss rule and an overall drawdown ceiling.
In the U.S., margin rules have also shaped how active trading accounts are handled. FINRA and the SEC stated that a pattern day trader in a U.S. margin account had to maintain at least $25,000 in equity, and if the account fell below that level, day trading wasn't permitted until equity was restored (SEC day trading margin guidance). The older framework counted day trades over a rolling five-business-day window and used a four-day-trades threshold plus a 6% activity test to flag the account (older pattern day trading rule summary). FINRA's 2026 notice says new intraday margin standards replace the old pattern day trader designation and the $25,000 minimum equity rule, so that treatment changed in 2026 (FINRA Notice 26-10).
How do you recover from drawdown without making it worse?
Reduce position size as the account drops. Don't try to “win it back” with bigger bets.
The recovery math is ugly enough on its own. A 10% drawdown needs an 11% gain to recover. A 20% drawdown needs 25%. A 50% drawdown needs 100%. That's why disciplined traders respond to drawdown by shrinking risk, not increasing it.
When your account is hurt, your first job is to stop the bleeding. Recovery comes second.
How is model risk different from execution slippage?
Execution slippage is about how the trade gets filled. Model risk is about whether the strategy logic still works at all.
A system can fail because market behavior changed, because the backtest was overfit, or because live conditions include tail events the historical sample barely contained. ESMA's 2026 risk monitor adds useful context here. It says market, contagion, and operational risk are all at the highest level, and stretched valuations raise the chance of a sharp correction. It also notes that equity trading volumes in 2H25 were still 20% above 2H24 even after an 8% drop from 1H25, which suggests traders are still active in a riskier backdrop (ESMA risk monitor 2026).
Putting It All Together and Trading With Discipline
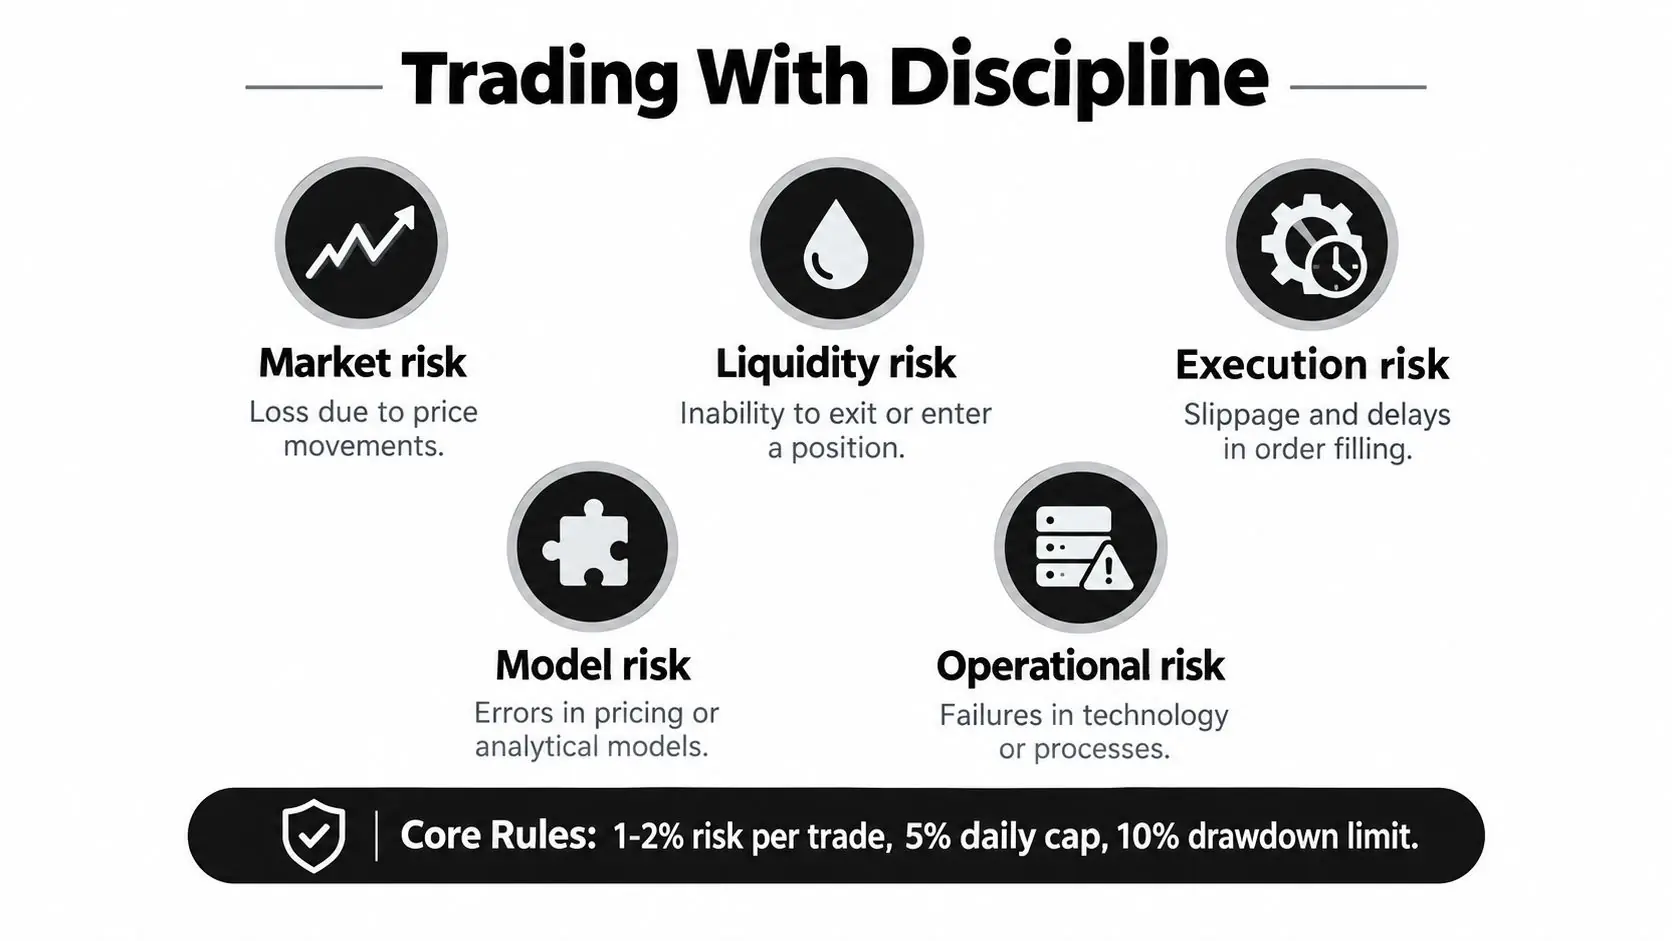
By this point, the answer to what is trading risk should feel more concrete. It isn't a generic warning label. It's the combined effect of market risk, liquidity risk, execution risk, model risk, and operational risk acting on your account.
The pre-session checklist that keeps traders grounded
Before a session starts, a disciplined trader should be able to answer these questions:
- Market risk Where is the trade wrong?
- Liquidity risk Could the exit get messy at this time or around this event?
- Execution risk Is the platform, spread, and order process reliable right now?
- Model risk Is this setup working in current conditions, not just in old screenshots?
- Operational risk Am I focused, prepared, and following the plan?
The rules that deserve zero negotiation
- Per-trade risk Keep it around 1% to 2%, or lower when conditions get unstable.
- Daily stop Use a hard daily loss cap so one session can't wreck the week.
- Drawdown limit If account damage reaches your line in the sand, pause and review.
- Volatility adjustment Let ATR or current range conditions shape your stop and size.
- Execution discipline Use real orders, real stop placement, and pre-defined loss amounts.
A structured prop environment can help because it turns these ideas into enforceable limits instead of vague intentions. Clear daily loss caps and drawdown rules remove a lot of room for self-deception.
Trading involves real risk of loss. This article is educational only and not financial advice. If there's one principle worth carrying forward, it's this: risk control is the only edge that compounds reliably, because a good win rate without discipline doesn't last.
If you want a place to apply these rules under defined risk parameters, MyFundedCapital offers simulated funded trading programs with clear daily loss limits, maximum drawdown rules, and multiple paths like Instant Funding, 1-Step, and 2-Step challenges. Compare the account types, pick the structure that fits your style, and use the rules in this article the way they're meant to be used: before the trade, not after the damage.