You know the setup. Price pushes through a level, the candle looks clean, you enter the breakout, and a few minutes later the move stalls, snaps back, and tags your stop. If that keeps happening, price action alone isn't giving you enough information.
Volume analysis trading helps you judge whether a move has real participation behind it or whether you're chasing noise. Used properly, it won't predict the future, but it can help you confirm trends, filter weak breakouts, and avoid the kind of bad entries that burn through a daily loss limit fast.
Introduction Why Price Action Alone Is Not Enough
The trade usually looks good right before it hurts you.
Price pops through resistance, the candle closes strong, and the breakout entry feels justified. Then aggressive buyers keep hitting the offer, price barely moves, and the market rolls back through the level. That is not confirmation. That is often absorption. Large resting interest is taking the other side, and traders who read only candles notice it too late.
That distinction matters a lot more in funded trading than it does in theory. If you are working under a firm rule set and trying to avoid digging into a daily drawdown limit, clean price action is not enough. You need to know whether the move is attracting real acceptance or whether unseen size is capping it. A lot of failed breakouts come from traders treating high volume as automatic proof that the move is strong. In practice, high volume at a key level can mean the opposite.
Price tells you where the market moved. Volume helps you judge who controlled the auction at that price. A breakout that travels with steady participation and little pushback is one type of trade. A breakout that prints heavy activity but cannot extend is a different trade entirely, and usually a dangerous one.
That is why volume work starts to improve results only when you stop using it as simple confirmation and start using it to spot absorption.
If you need a basic primer before getting into the mechanics, this guide on what volume in trading shows about market participation covers the groundwork. The part many traders miss is what happens when participation is high and price still cannot go.
A level does not fail because volume was absent. It often fails because strong opposing interest absorbed the breakout pressure.
That is the piece price action misses on its own. Candles can show momentum. They do not show whether that momentum is getting accepted or sold into. Once you start reading that difference, you avoid more bad breakouts, take fewer reactive entries, and protect risk for the setups that have room to work.
The Foundations of Volume Analysis
A junior trader sees resistance break on a burst of volume, hits buy, and then watches price stall almost immediately. Ten minutes later the move is back inside the range, slippage has widened the loss, and now a serious problem starts. One bad breakout rarely blows up a prop account. A string of volume misreads does.
That is why the foundation is not "high volume confirms the move." The better question is whether volume is helping price travel or whether opposing size is absorbing the push. If you miss that distinction, you keep buying into traps that eat into your daily loss limit.
What volume is telling you
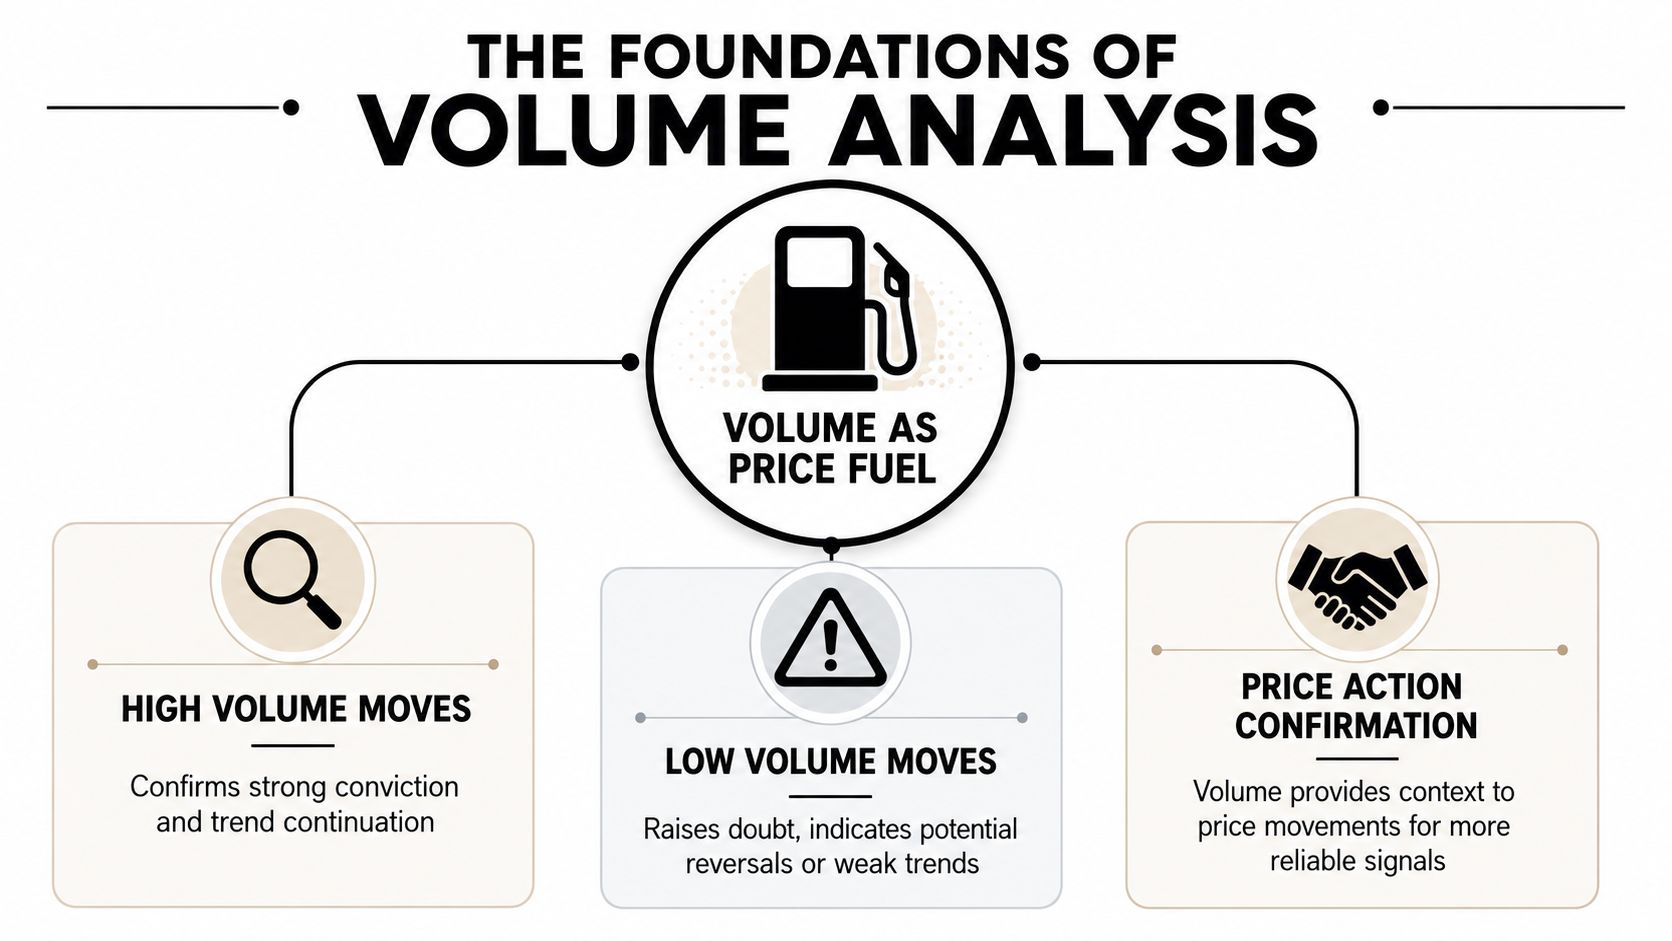
Volume measures participation. On its own, that is only half-useful. The edge comes from reading participation against location and result.
If price pushes through a key level on expanding activity and keeps auctioning higher, that usually shows acceptance. If price hits a key level, prints heavy activity, and cannot extend, that often points to absorption. Buyers are active, but larger sellers are filling them without letting price move far. That is the setup many traders label as "strong breakout volume" right before the reversal starts.
For a basic refresher on what trading volume shows about market participation, start there. The practical step is to stop treating every volume spike as confirmation and start asking a tougher question: did all that activity produce distance?
That framework helps in a few recurring situations:
- Trend continuation: Price advances and volume expands, with bars closing well and follow-through holding.
- Exhaustion: Volume expands into a prior high or low, but the market struggles to progress.
- Breakout attempts: A level breaks, activity surges, and the next few bars tell you whether the move is accepted or absorbed.
- Reversal zones: Heavy participation at an extreme matters more when price fails to hold the new ground.
One detail traders should understand early. Volume reflects completed transactions, not a separate count for the buyer and seller side. A trade happens because both sides met. The print counts once.
Tick volume versus real volume
The next trade-off is feed quality.
In centralized futures or equities, you can often read real exchange volume. In many FX and CFD markets on platforms like DXtrade or cTrader, what you get is tick volume, which tracks price changes rather than confirmed exchange prints.
Real volume is cleaner. Tick volume is still useful if you stay honest about what it can and cannot do.
Use it comparatively, not absolutely. Compare current activity with recent activity in the same instrument, during the same session, around the same type of level. That keeps the read grounded. Traders get in trouble when they demand precision from a feed that cannot provide it, then size up anyway.
Practical rule: If your platform shows tick volume only, use it to judge relative participation and pace. Do not use it as proof that a breakout is safe.
What works and what gets traders trapped
The textbook version says volume should confirm price. That is incomplete. In prop trading, the better habit is to watch how much volume was required to move price and whether the market could hold the move after that effort.
What works:
- Reading volume at obvious decision points, such as prior day high, session VWAP, range edges, and major intraday swings
- Comparing current participation with recent session behavior
- Watching for price acceptance after the surge, not just the surge itself
- Cutting breakout ideas quickly when heavy volume shows up but extension does not
What gets traders trapped:
- Buying every high-volume breakout bar
- Ignoring repeated failure to push past the same level
- Treating a spike in activity as bullish without asking who absorbed it
- Giving a "good idea" too much room after the market already showed no acceptance
That last point matters for risk. Absorption setups are often the ones that trigger revenge trades because the entry looked valid on the surface. Read them properly, and you avoid forcing size into crowded breakout attempts. That alone can save a prop trader from turning one bad read into a daily drawdown problem.
Decoding Key Volume Indicators
Raw volume bars are useful, but they're blunt. Indicators such as On-Balance Volume (OBV) and Chaikin Money Flow (CMF) help organize what the tape is already telling you.
They're not substitutes for reading the chart. They're support tools. Use them to confirm pressure, spot divergence, and catch moments when price and participation stop moving together.
How to think about OBV
OBV is a cumulative line. It adds volume on up closes and subtracts volume on down closes. The value isn't important by itself. The shape is.
That makes OBV especially good for one job: spotting whether buying or selling pressure is keeping pace with price.
Heavy trading volume usually signals stronger conviction behind a move, while light volume suggests uncertainty. That relationship is what makes trend validation and divergence work in the first place, as described in Investopedia's explanation of why trading volume matters.
Watch for these patterns:
- Price makes a new high, OBV doesn't: buying pressure may be fading under the surface.
- Price holds flat, OBV rises: accumulation may be happening before price catches up.
- Price pushes lower, OBV stabilizes: selling pressure may be losing force.
A practical way to pair this with execution is to combine it with session context and tools like VWAP in active trading. If price is extended, OBV is lagging, and the market is struggling around a key intraday benchmark, you have a better reason to stay out or scale down.
How to use CMF without overcomplicating it
CMF tries to measure whether money is flowing into or out of a market by blending price location within the candle range with volume. In plain English, it asks whether buyers are consistently finishing the job near the stronger part of the range, or whether sellers are doing it.
CMF is useful when you want a cleaner read on sustained pressure rather than one-off spikes.
Use it like this:
- Positive CMF with healthy structure: supports long bias
- Negative CMF during weak bounces: supports short bias
- Flat or mixed CMF during a breakout: a warning that the move may lack follow-through
A simple divergence checklist
Don't make divergence mystical. Keep it operational.
| Signal | What it can mean | Better response |
|---|---|---|
| Price up, OBV flat | Trend may be tiring | Avoid chasing late |
| Price up, CMF weak | Buyers may not be in control | Wait for better confirmation |
| Price down, OBV improves | Selling pressure may be fading | Watch for base, not instant reversal |
| Price range-bound, CMF improves | Quiet accumulation possible | Prepare, don't predict |
If an indicator disagrees with price, don't force a trade. Let the disagreement slow you down.
Common misuse
A lot of traders misuse volume indicators in the same way they misuse oscillators. They want an automatic buy or sell signal. That's not the point.
OBV and CMF work best when they answer a narrower question: Is the move being supported, or is it running out of sponsorship?
That's a useful question for a junior trader. It keeps you from buying every green breakout candle or shorting every red breakdown without checking whether the broader flow agrees.
Mastering Order Flow with Volume Profile
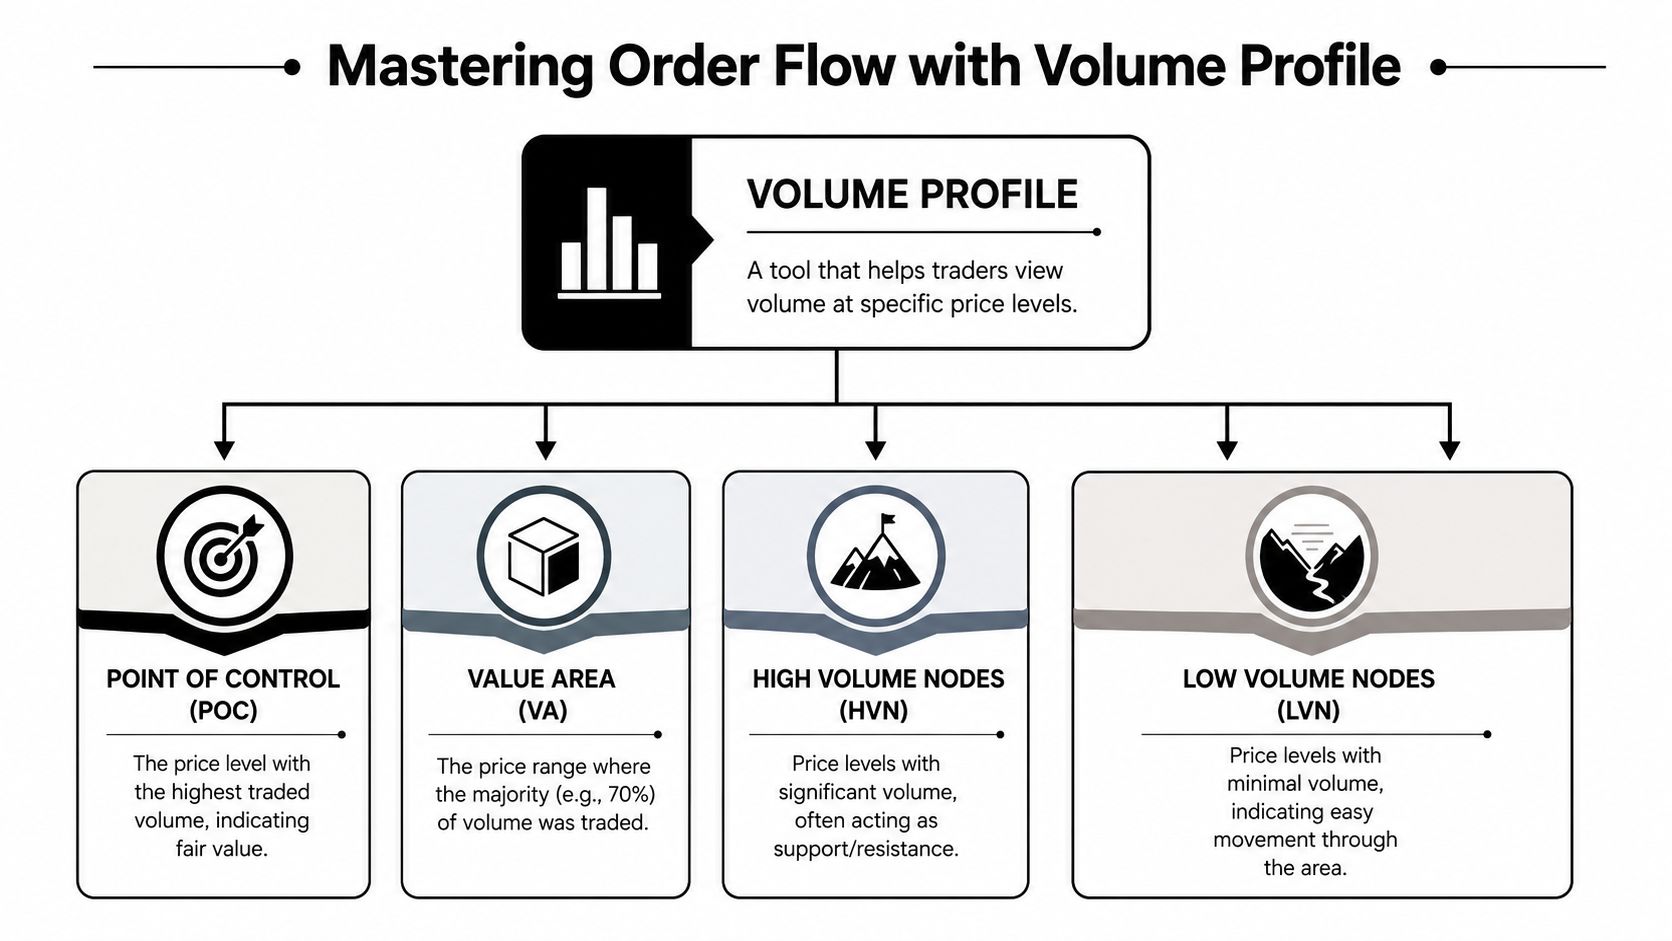
Regular volume bars tell you when activity happened. Volume Profile tells you where it happened on the price ladder. That shift changes how you mark levels.
Instead of drawing support and resistance from memory or obvious swing points alone, you can see which prices attracted the most business and which prices were quickly rejected.
The levels that matter most
The core terms are simple:
- Point of Control or POC: the price with the most traded volume in the chosen window
- High Volume Nodes or HVNs: areas where the market spent time and accepted price
- Low Volume Nodes or LVNs: thinner zones where price was rejected or moved through quickly
- Value Area: the zone where the bulk of trading took place
A major concept in Volume Profile is that the Value Area contains approximately 70% of all trading volume for the period being studied, according to TrendSpider's guide to Volume Profile strategies. When price moves outside that area, traders often treat it as unusual behavior that deserves attention rather than automatic continuation.
That's why many traders use order flow analysis in execution planning alongside profile levels. The profile gives location. Order flow helps confirm what's happening at that location.
Acceptance versus rejection
One of the cleanest ways to use profile is to think in terms of acceptance and rejection.
High-volume areas usually represent price acceptance. The market did a lot of business there, which means participants considered that area fair enough to transact repeatedly. Low-volume shelves or gaps usually represent rejection, and the POC marks the price with the most volume over the selected window, as explained by the International Trading Institute on reading the Volume Profile.
That leads to a practical map:
- At HVNs: expect chop, two-way trade, and slower movement
- Near LVNs: expect faster movement if price enters with momentum
- Around the POC: expect negotiation, not clean trend behavior
- Outside Value Area: expect either rejection back in or a meaningful expansion if acceptance develops
A profile doesn't tell you what price must do. It tells you where the market has already shown comfort and discomfort.
How to trade it in real conditions
Volume Profile works best when you stop treating it like decoration.
A practical routine looks like this:
- Mark the current Value Area.
- Identify the POC.
- Note the nearest HVN and LVN.
- Watch how price behaves when it leaves the Value Area.
- Trade the market's response, not your prediction.
The useful part isn't the drawing. It's the reaction.
If price leaves the value zone and gets rejected back inside, the excursion may have been too expensive or too cheap too quickly. If price leaves and starts building acceptance outside, the market may be discovering a new area of value.
That's a much stronger framework than drawing random horizontal lines and hoping one of them sticks.
Applying Volume Analysis in Your Trading Strategy
Most traders learn one basic rule early: volume should confirm price. That rule is useful, but incomplete. It helps with good breakouts, and it fails badly when larger players are absorbing orders at obvious levels.
That gap matters a lot if you trade under a hard daily loss cap. A fake breakout can cost you one stop. Chasing the retest can cost you two. If you miss the absorption signal, the day can unravel fast.
A basic breakout process that actually helps
Start with a structured routine instead of trading excitement.
A valid breakout should come with volume of at least 1.5x to 2x the average daily volume to confirm stronger institutional participation, according to this volume analysis reference from Wealthsimple. That same source notes that 60% of breakout failures in equity and FX markets occur due to hidden absorption, where larger participants absorb flow at key levels instead of allowing the move to expand.
Use that information in sequence:
Mark the level first
Don't invent breakouts in the middle of nowhere. Identify prior highs, session ranges, profile edges, or clear reaction zones.Wait for price to test the level
Let the market show intent. A level that's never challenged can't produce a breakout.Check whether activity expands
If price pushes through but participation looks ordinary, there's no reason to rush.Read the candle spread against the volume
At this stage, most traders get caught.Only take the trade if the result matches the effort
Big effort should produce visible progress. If it doesn't, step back.
The absorption trap most traders miss
This is the under-explained part.
Textbook teaching says high volume on a breakout confirms the move. Sometimes it does. Sometimes that same high volume is the trap.
Volume absorption happens when a lot of orders hit a key level, but price barely advances. You'll often see a huge volume bar paired with a small candle body, repeated stalling, or a wick-heavy breakout that can't stay extended. That's an effort versus result divergence. Large volume came in, but the market didn't travel.
That often means a larger participant is happily taking the other side.
Watch for this combination:
- Large volume spike at resistance
- Small real body
- Repeated failure to close cleanly beyond the level
- Fast snap back into the prior range
That's not confirmation. That's a warning.
If the market needs heavy effort just to move a little, someone larger may be absorbing every breakout order you're tempted to join.
A concrete trade filter for prop traders
This isn't about being clever. It's about staying in the game.
Use this filter before every breakout trade:
- Location check: Is price breaking a level that matters?
- Participation check: Is activity clearly stronger than normal?
- Spread check: Did the candle travel enough relative to the effort?
- Hold check: Can price stay above the level, or is it instantly slipping back?
- Risk check: If this fails, is the loss small enough to keep your day intact?
For active crypto traders, one extra habit helps. Keep a separate market context tab open, especially when broad sentiment can distort individual setups. A live Bitcoin price tracker can help you see whether a move is happening with broader crypto participation or against it.
What actually works under tight loss limits
Under strict risk rules, the best trade is often the one you skip.
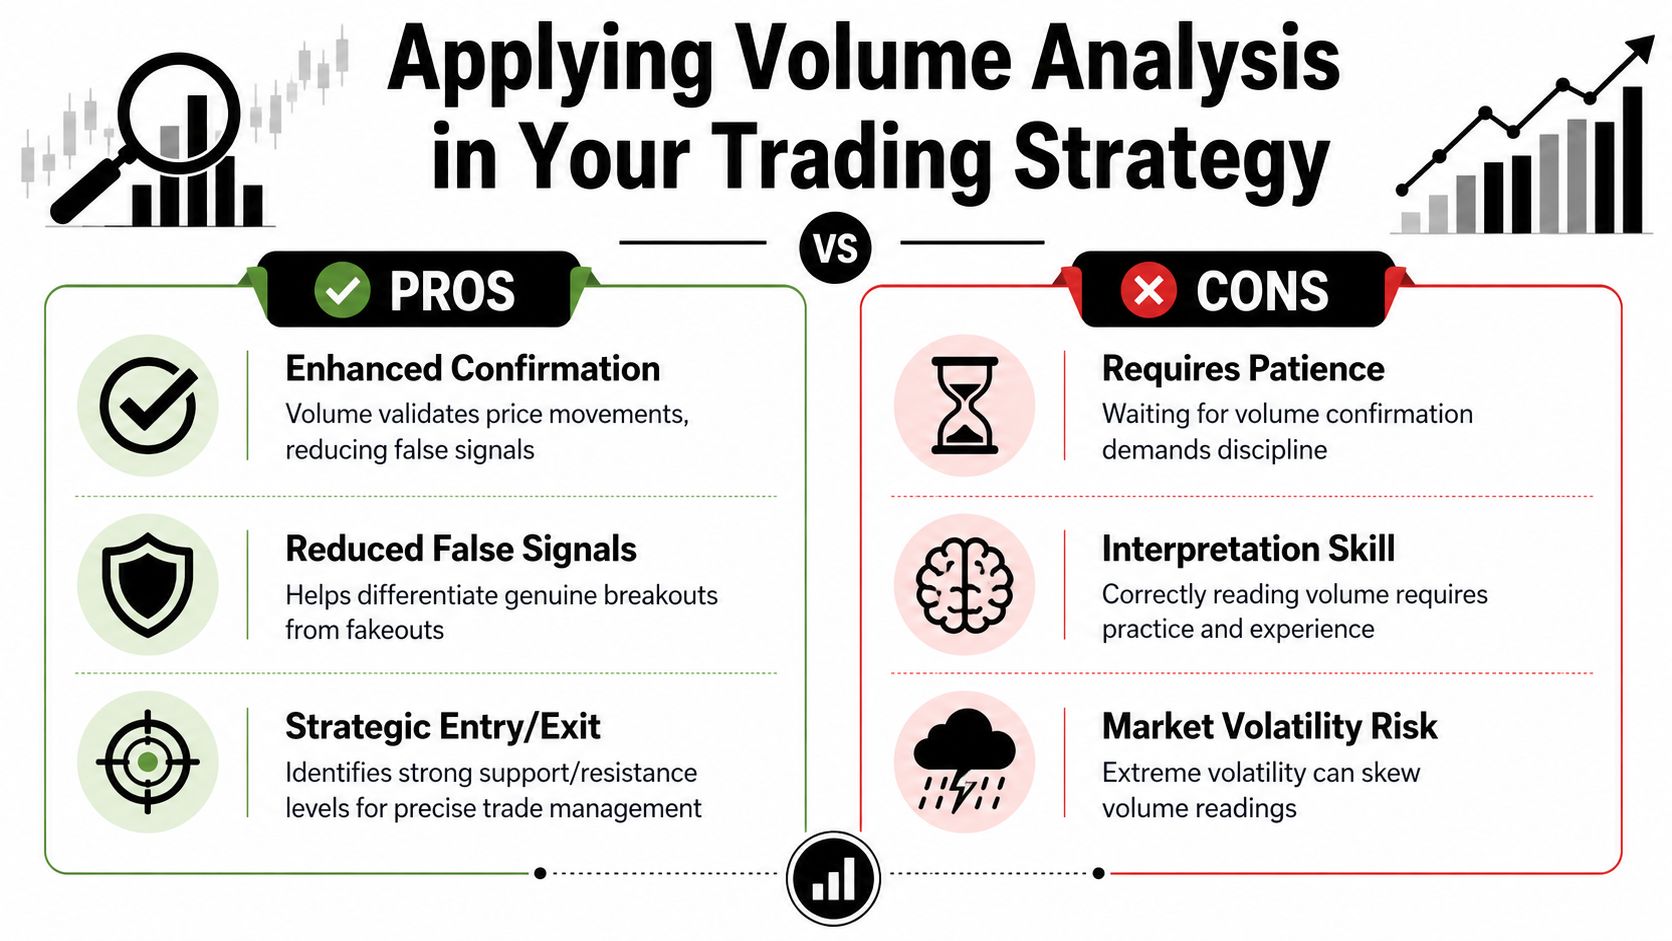
Good volume analysis trading does three things well:
- It keeps you out of thin breakouts
- It warns you when strong-looking volume may in fact be absorption
- It improves timing by forcing you to wait for proof instead of anticipation
What fails is impulsive interpretation. Traders see one large bar and call it confirmation. The better question is whether the market made enough progress to justify that effort. If the answer is no, don't force the trade.
Platform Tips for DXtrade cTrader and Algos
Execution matters. A solid read on volume doesn't help if your platform setup is messy, your charts are cluttered, or your algorithm ignores the one variable that should keep it out of bad breakouts.
The goal here is simple: make volume visible, comparable, and usable.
DXtrade setup basics
On DXtrade, keep the chart practical. You don't need ten indicators competing for space.
A clean setup usually includes:
- Volume panel enabled: so you can compare activity bar by bar
- Session levels marked manually: prior day high, low, range edges, and obvious reaction levels
- A watchlist grouped by market type: FX, indices, crypto, commodities
- Saved layouts by strategy: one for breakout trading, one for pullbacks, one for higher time frame structure
If your DXtrade feed gives you volume that behaves more like tick activity, use it comparatively. Focus on whether activity is clearly expanding around key levels, not on pretending the feed gives exchange-grade precision.
cTrader gives you more to work with
cTrader is often stronger for traders who want more native charting flexibility around volume behavior.
A practical cTrader workflow looks like this:
- Add standard volume and keep it visible on every execution chart.
- Use separate templates for intraday and higher time frame review.
- If your version supports profile-style tools or custom indicators, keep them on a second chart rather than overloading your main execution screen.
- Save workspaces so you're not rebuilding your process each morning.
That last point sounds minor, but it helps. Consistency in chart layout reduces bad decisions. When traders change visual context every session, they start reading the market differently without realizing it.
How algo traders should handle volume
If you build EAs or cBots, volume should be part of the filter logic, not an afterthought.
A useful automation structure might include:
- Entry gating: only allow breakout entries when current activity is meaningfully above recent baseline
- Effort versus result logic: reject signals where a high-activity bar produces poor candle expansion
- Time-of-day filtering: volume means different things during dead hours and active sessions
- Post-break hold logic: require the breakout to stay beyond the level for a defined condition before full entry
For cTrader developers, using Bars.TickVolumes in cAlgo is a common starting point for building these filters. The key is not coding “high volume = buy.” The key is coding context.
An algorithm that reads volume without location usually automates the same bad habits a human trader already has.
Mistakes to avoid on any platform
A few platform habits create bad trades fast:
| Mistake | Why it hurts |
|---|---|
| Hiding volume to save screen space | You lose confirmation at the exact point you need it |
| Using one layout for every market | FX, indices, and crypto don't always behave the same way |
| Letting the algo fire on every level break | It catches fakeouts as efficiently as valid breakouts |
| Ignoring candle spread in code | You miss absorption and effort versus result divergence |
Manual trader or algo trader, the rule is the same. Your platform should make it easier to say no to weak setups.
Frequently Asked Questions and Final Thoughts
Volume analysis trading is useful because it keeps you honest. It doesn't replace structure, execution, or risk control. It adds a second layer of evidence so you're not trading a chart pattern in a vacuum.
It's still a tool, not a guarantee. Trading involves risk of loss, and no volume method can remove uncertainty. This content is educational only and not financial advice.
Common Volume Analysis Questions
| Question | Answer |
|---|---|
| Can volume analysis predict the future? | No. It measures participation and conviction, not certainty. Its job is to help you confirm or question a move, not forecast every next candle. |
| What is the best timeframe for volume analysis? | The best timeframe is the one tied to your holding period. Day traders usually read volume around session structure and execution charts, while swing traders care more about broader context and key levels. What matters most is consistency between your setup, trigger, and risk plan. |
| Is volume analysis reliable for cryptocurrency trading? | It can be useful, especially when paired with market context and key levels. Crypto can move aggressively, so confirmation and absorption reading matter even more. Use volume as part of a broader process, not as a standalone signal. |
Final thoughts that matter in live trading
If you remember one thing, make it this: good volume supports price movement, but abnormal volume that produces little progress can warn of absorption.
That distinction saves trades, but above all, it saves bad days.
Most traders don't blow up because they never learned a setup. They blow up because they force mediocre setups, re-enter after obvious failure, and ignore what the tape is telling them. Volume analysis trading helps prevent that if you use it with discipline.
Keep the process simple:
- Mark real levels
- Wait for activity to matter
- Compare effort to result
- Respect failed follow-through
- Protect your downside first
That's how volume becomes a risk tool, not just a chart feature.
If you want to put that discipline to work in a structured prop environment, explore MyFundedCapital to compare funding programs, review account types, and start a challenge that rewards controlled execution.