Only 48.7% of valid three-candle fair value gaps fully closed in one large-sample summary, while 74.6% received an initial edge tap. That difference changes how you should think about the pattern. A fair value gap is not a promise that price will return to a zone and reverse, but a location whose usefulness depends on structure, momentum, depth, timeframe, and risk control.
Why Most Traders Misuse the Fair Value Gap
The practical question is simple: why do traders who mark every imbalance underperform? The problem usually isn't the fair value gap itself. It's the habit of treating every marked zone as an automatic buy or sell signal.
A bullish gap often gets interpreted as “buy when price comes back.” A bearish gap gets treated as “sell when price revisits.” That shortcut ignores whether the market is trending, whether the original move broke meaningful structure, and whether the return is a controlled retracement or a sign that the original displacement has failed.
The broader data argues against blind gap-filling assumptions. A large-sample summary found that only 48.7% of valid three-candle FVGs achieved full closure, while 61.2% reached the 50% consequential encroachment level and 74.6% received an initial edge tap (data on FVG fill rates across thousands of gaps). Partial interaction is more common than complete mitigation.
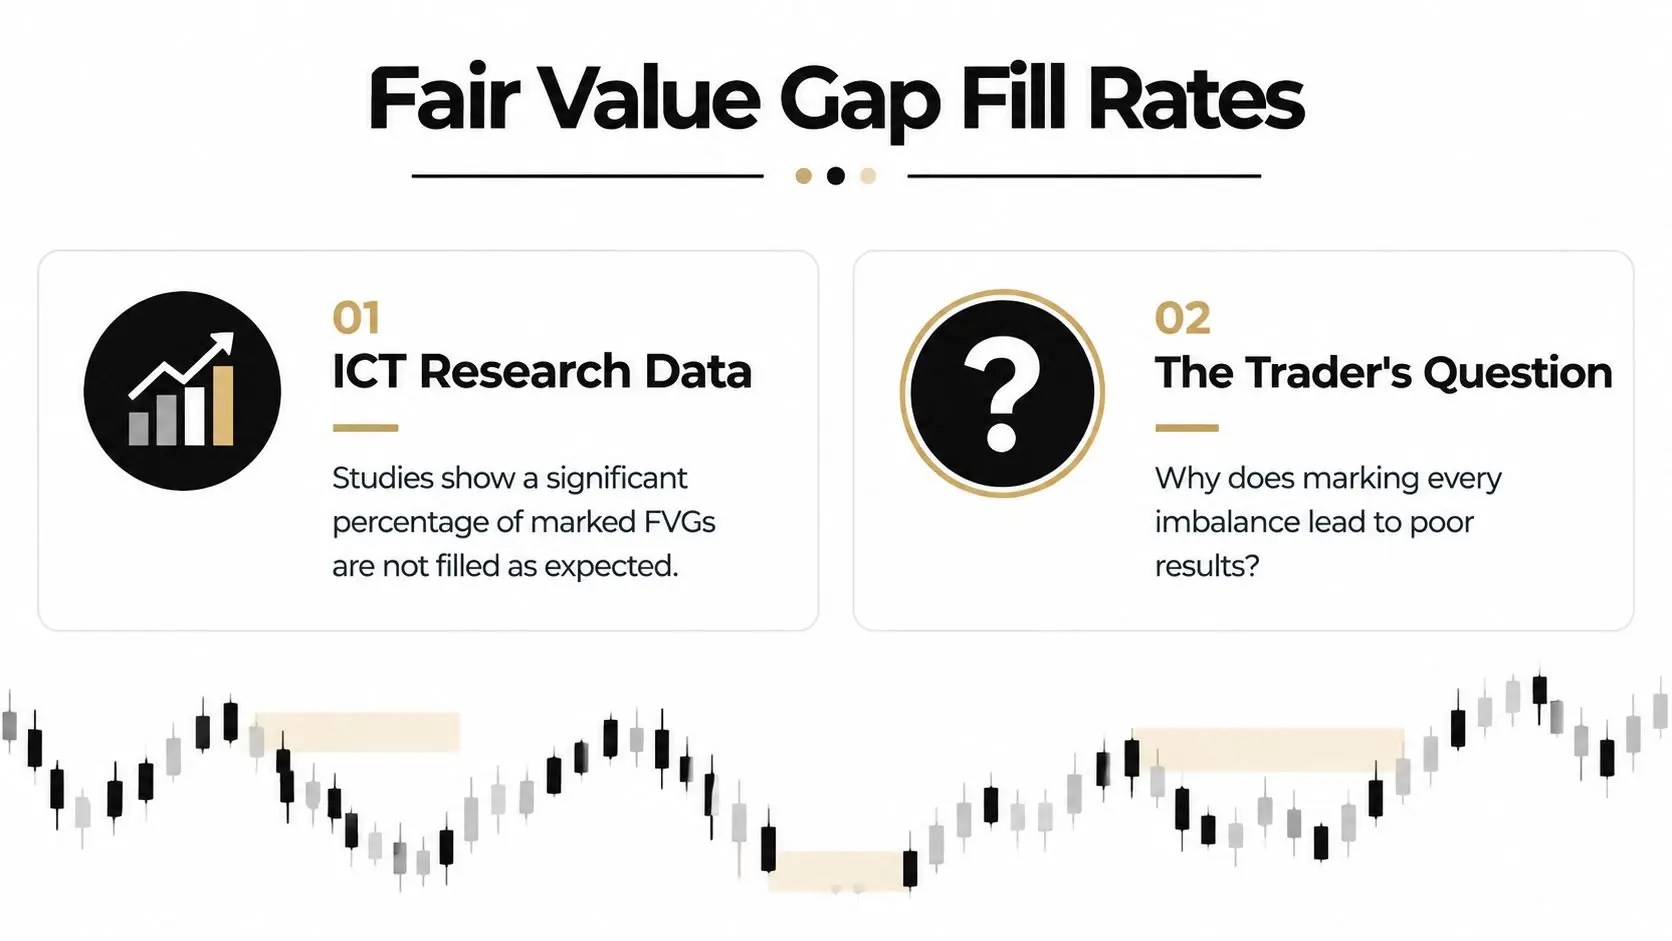
The three errors behind poor FVG trades
- No directional filter A trader buys a bullish FVG while the higher-timeframe market is still making lower highs and lower lows.
- No displacement test The middle candle looks large, but it didn't break meaningful structure or create a decisive change in order flow.
- No invalidation plan The trader enters inside a zone, places a tight stop within the imbalance, and gets stopped before the market reaches the level where the setup is wrong.
That creates cluttered charts and reactive decisions. A fair value gap should be treated as a probabilistic reaction zone, not a guaranteed reversal point. Price may tap the edge, reach the midpoint, pass through the entire zone, or never return.
Practical rule: Mark fewer gaps, then require context before you consider an entry.
This article's framework is procedural. First identify the market bias, then validate the three-candle structure, evaluate the gap's quality, and only afterward plan entry and risk. The pattern becomes useful when it helps you organize evidence. It becomes dangerous when the label replaces analysis.
How a Fair Value Gap Forms on the Chart
A fair value gap is commonly defined as a three-candlestick price imbalance. The first and third candles fail to overlap at their wicks, leaving a visible zone where price moved with limited two-sided trading (three-candle fair value gap definition).
Consider a bullish sequence:
- The first candle establishes the reference range.
- The middle candle expands sharply upward, often with a strong body and limited hesitation.
- The third candle remains above the first candle's high, leaving space between the first candle's high and the third candle's low.
That space is the bullish FVG. In a bearish sequence, the middle candle drives lower, and the third candle remains below the first candle's low. The bearish zone sits between the first candle's low and the third candle's high.
The practical measurement rule is straightforward. In a bullish move, traders commonly measure the relevant range from the high of the first candle to the low of the third candle. In a bearish move, they measure from the low of the first candle to the high of the third candle (practical FVG marking method).
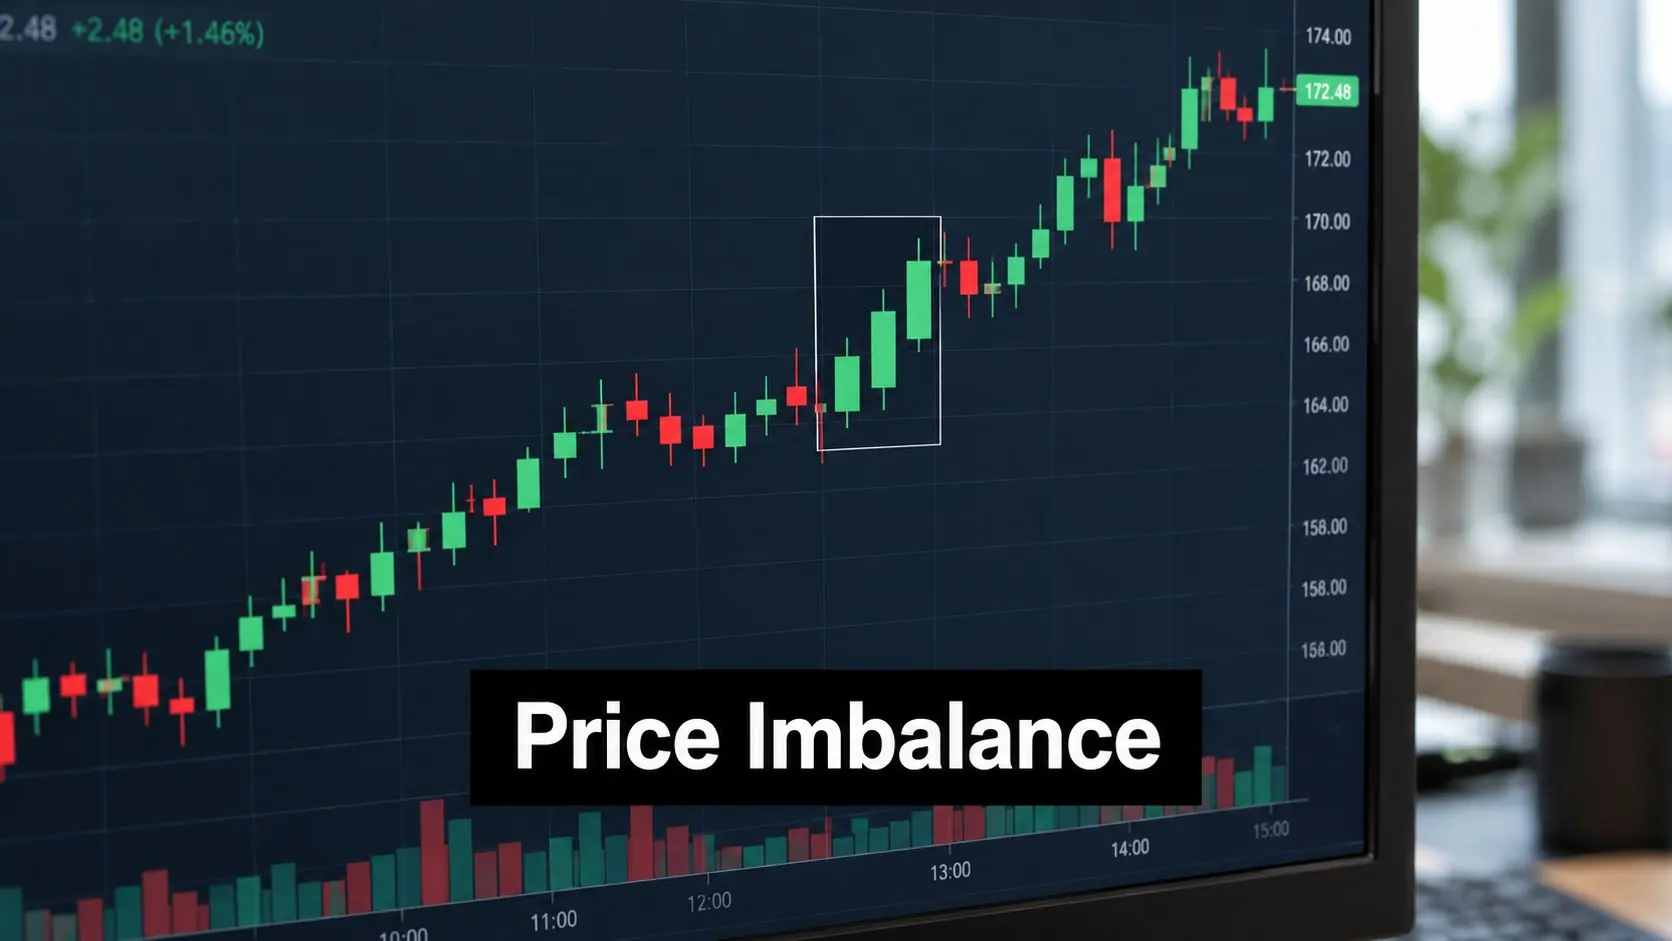
Why displacement matters
The gap forms because one side of the market overwhelms available liquidity. Aggressive buying can lift offers quickly, while aggressive selling can consume bids and push price lower. The resulting zone reflects momentum plus thin opposing flow, not a missed price level (description of FVGs as momentum-driven market inefficiencies).
Institutional execution, stop runs, and sudden changes in demand can all contribute to that fast movement. You don't need to claim that every FVG identifies a specific institution's order. The chart only proves that price moved rapidly enough to leave the three-candle structure.
A wide-range candle by itself isn't necessarily an FVG. Neither is an overnight opening gap in a stock. The defining feature is the relationship between candle one, candle two, and candle three, especially the absence of wick overlap between the outside candles.
The clean identification test is:
- Is there a distinct three-candle sequence?
- Did the first and third candle wicks fail to overlap?
- Did the middle candle show clear displacement?
- Is the zone visible on the timeframe you're using for the trade?
If the answer to those questions is no, you may be looking at volatility, a standard session gap, or ordinary chart noise rather than a fair value gap.
Anatomy of a Valid FVG and How to Mark It
Once you've identified the pattern, mark the zone consistently. A bullish FVG is drawn between the first candle's high and the third candle's low. A bearish FVG is drawn between the first candle's low and the third candle's high. The midpoint, often called consequent encroachment, divides the zone into equal halves and provides a useful reference for partial mitigation.
Many traders describe that midpoint as an equilibrium area. It isn't a magic entry price, but it gives you a repeatable location for testing whether price is accepting or rejecting the imbalance.
Quality depends on more than width
A zone that's too thin may offer little room for a meaningful reaction after spread, slippage, and normal candle noise. A very deep zone can create a different problem, because the stop distance may become unsuitable for the account's risk limit. Rather than using a universal size threshold, compare the zone's depth with the instrument's normal volatility, such as its ATR, and keep the measurement consistent in your journal.
Timeframe also changes the meaning of the pattern. A one-minute FVG during an active market open can reflect short-lived order-flow pressure. A four-hour FVG formed after a significant session low may represent a broader repricing event. Neither is automatically better, but they shouldn't be treated as equivalent.
For a deeper introduction to the surrounding framework, review smart money concepts and their market-structure context.
FVG quality filters at a glance
| Filter | High-Quality FVG | Low-Quality FVG |
|---|---|---|
| Higher-timeframe alignment | Supports the dominant directional structure | Fights the broader trend without a clear reversal |
| Displacement | Middle candle expands decisively and breaks meaningful structure | Movement is small, overlapping, or trapped inside consolidation |
| Location | Sits near a relevant swing, liquidity event, or structural level | Appears randomly in the middle of a range |
| Freshness | Price hasn't repeatedly traded through the zone | Zone has already been tapped or heavily mitigated |
| Depth | Large enough to study and trade with defined risk | Too thin for a clean reaction or too deep for practical risk |
Before marking a zone, ask:
- Does the higher-timeframe bias agree with the direction?
- Did the middle candle create genuine displacement?
- Is the FVG near a meaningful level?
- Is the zone fresh?
- Can the stop sit beyond a logical invalidation point?
- Does the potential target justify the planned risk?
If you can't answer those questions, leave the zone unmarked. A blank chart is better than a chart filled with weak assumptions.
Trading the Fair Value Gap Step by Step
A complete FVG setup needs more than an entry. You need a directional bias, a defined zone, an invalidation point, and a target selected before the trade is active.
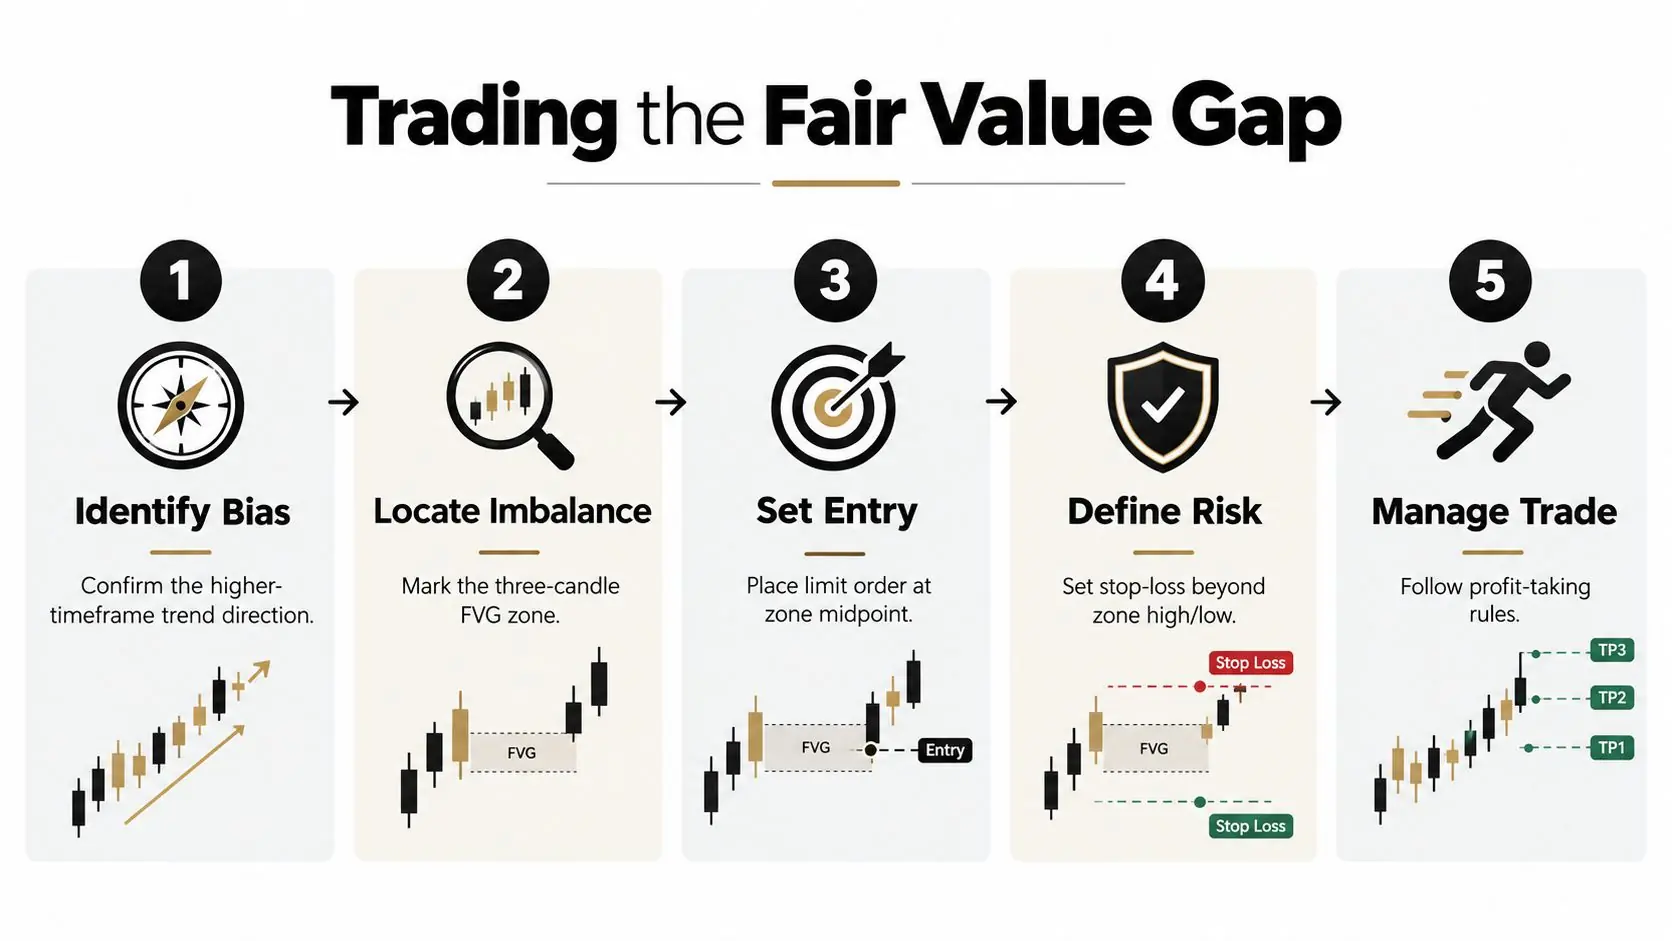
Build the setup before price returns
Assume an index is making higher highs and higher lows on the higher timeframe. A strong bullish candle breaks above a prior swing and leaves a bullish FVG below current price. You don't buy the breakout automatically. You wait to see whether price revisits the zone while the broader bullish structure remains intact.
A practical sequence looks like this:
- Identify the bias. Confirm that the higher-timeframe structure supports buys or sells.
- Mark the imbalance. Draw the bullish or bearish zone using the outside candle wicks.
- Choose the entry. A limit order near the midpoint can provide consistency, but it should only be used when your testing supports that approach. You can also wait for lower-timeframe rejection or a structure shift inside the zone.
- Place the stop. Put the stop beyond the boundary that invalidates the idea, not at an arbitrary distance inside the gap.
- Define the target. Use an opposing inefficiency, a prior swing, or another structural objective. Don't move the target because price hesitates.
For a bullish setup, a stop below the lower boundary may make sense if the broader structure supports that placement. For a bearish setup, the stop may sit above the upper boundary. The exact distance depends on the instrument, timeframe, spread, and account rules.
A pre-entry decision
Before placing the order, run this short test:
- Bias: Is the trade aligned with the higher-timeframe direction?
- Formation: Does the pattern contain three candles with the required wick relationship?
- Displacement: Did the middle candle produce a meaningful move?
- Freshness: Is this the first meaningful return to the zone?
- Location: Is the FVG near structure or a liquidity event?
- Risk: Is the stop placement logical and affordable?
- Target: Is the target defined before entry?
- Execution: Are spread, volatility, and scheduled events acceptable?
A setup that fails one important condition doesn't need to be forced. You can wait for price to offer a cleaner location, or you can skip the trade entirely.
The best FVG entry is often the one you can explain before the order exists, including where the idea is wrong.
Your journal should record the direction, timeframe, zone boundaries, entry method, stop logic, target logic, and outcome. Over time, that record tells you whether midpoint entries, edge entries, or confirmation entries fit your market and temperament.
How FVGs Behave Across Forex, Crypto, and Indices
A fair value gap can be revisited often without producing a reliable trade. The available figures show why each market needs its own testing rather than a single rule copied across forex, crypto, and indices.
One EUR/USD study found that 64.8% of 15-minute imbalances were revisited and partially filled within 48 hours (cross-market discussion of FVG revisit behavior). This is a partial-revisit rate from one EUR/USD sample, not proof that every gap fills. It also cannot be transferred directly to Bitcoin or an index future.
A separate multi-asset and crypto-focused backtest summary reported that about 53% of higher-quality gaps held as support or resistance on touch. Read together, these figures separate two events traders often combine: price returning to a gap, and price reacting there. A revisit can produce a weak response, while a gap can act as support or resistance without closing completely.
A unified table of fill rate, median reaction in ATR, and average time to fill is not available for EUR/USD, BTC, and indices under the same method. The only specific figure here is the EUR/USD result, where 64.8% were partially revisited within 48 hours. BTC and indices cannot be assigned comparable values from the verified evidence, so presenting empty rows would suggest a level of cross-market precision that the data does not support.
That limitation affects how you build rules. Different definitions of “fill,” trading sessions, exchange structures, volatility regimes, and price feeds can change the result. Traders studying crypto market structure can review crypto X posts for Web3 builders, but social commentary is not a substitute for instrument-specific testing.
Indices also require care because futures and CFD charts may differ through contract sessions, rollover treatment, and feed construction. In FX, broker pricing and session boundaries can change wick placement. Crypto trades continuously, giving it a different rhythm from session-based markets.
Use order flow analysis for trading context as a separate confirmation layer. Then record each market's revisit outcome, reaction, and time in the zone. A rule that performs well on EUR/USD may behave differently on BTC or an index, so validate the rule before treating it as transferable.
Do Fair Value Gaps Always Fill The Data Says No
No. The evidence directly rejects the idea that every fair value gap must close completely.
In the YM futures study summarized in the available research, bullish FVGs remained unmitigated 60.71% of the time, while bearish FVGs remained unmitigated 63.2% of the time during the same trading session. Using wick-based measurement over six months, the same source found 52.38% of bullish gaps and 50.4% of bearish gaps stayed unmitigated (FVG best practices and YM futures measurements).
Those figures don't conflict with the idea that price often revisits imbalances. They show that revisit, partial fill, and full closure are different events.
Use the zone as a sequence of tests
A bullish gap can receive an edge tap, reject, and continue higher without reaching its midpoint. It can reach consequent encroachment, react, and never fully close. It can also trade through the entire zone, proving that the original imbalance didn't provide the expected support.
That gives you several observable outcomes:
- Edge tap Price reaches the nearest boundary and reacts.
- Midpoint interaction Price reaches the 50% level and tests equilibrium.
- Full mitigation Price traverses the complete zone.
- Failure Price accepts beyond the zone and invalidates the directional idea.
The correct response isn't to keep waiting for a full fill. Define in advance what interaction qualifies as an entry, what movement invalidates the setup, and where profits come out.
For a practical comparison of gap concepts and execution considerations, see this guide to trading gaps and their behavior. The key lesson is procedural: never build a trade plan around an outcome the market doesn't consistently deliver.
Common Questions About Trading Fair Value Gaps
Can FVGs work with other smart money concepts?
Yes, but each added filter changes the number and character of trades. An order block can provide location, a liquidity sweep can show that recent highs or lows were taken, and a breaker block can help frame a failed structure level. Combining them may improve selectivity, but it can also leave you with fewer opportunities and more subjective decisions.
Choose one confirmation filter first, then test whether it improves your results. Don't stack every SMC label on a chart and assume the setup is stronger because it has more names.
How should prop-firm drawdown rules affect the stop?
A stop beyond the FVG boundary generally gives the setup more room than a stop placed inside the zone, but it can also increase the amount at risk unless you reduce position size. A stop inside the gap may lower the nominal distance while increasing the chance that ordinary zone interaction removes you before the setup is invalidated.
The 1% rule is a risk-management convention, not a universal prop-firm requirement. Check the firm's actual daily-loss and drawdown rules, then size the trade so one loss doesn't threaten compliance.
What win rate should traders expect?
The specific win-rate range requested for an FVG-only approach isn't supported by the verified data, so it shouldn't be presented as a fact. A realistic assessment requires your market, timeframe, entry definition, stop method, target method, and sample to be tested together.
Backtest a clearly defined rule set across different market conditions. Also check how MetaTrader, TradingView, and TrendSpider render wicks, sessions, synthetic candles, and historical zones, because platform settings can change what appears to be a valid imbalance.
Putting It Together and Trading It on a Funded Account
Use a binary checklist before every order. Each answer should be yes or no, not “probably.”
- Higher-timeframe bias confirmed: Does the weekly or daily direction support the trade?
- Three-candle imbalance validated: Do the outside candle wicks fail to overlap?
- Displacement confirmed: Did the middle candle create a meaningful structural move?
- Zone quality acceptable: Is the gap fresh, visible, and deep enough to study without making risk impractical?
- Liquidity context present: Has price interacted with a recent high, low, or meaningful structural area?
- Entry defined: Is the entry at the edge, midpoint, or confirmation level according to your tested rules?
- Invalidation defined: Is the stop beyond the boundary or structure that proves the idea wrong?
- Target defined: Are you targeting an opposing inefficiency or a measured swing?
- Account risk acceptable: Does the position size respect the account's daily and maximum drawdown limits?
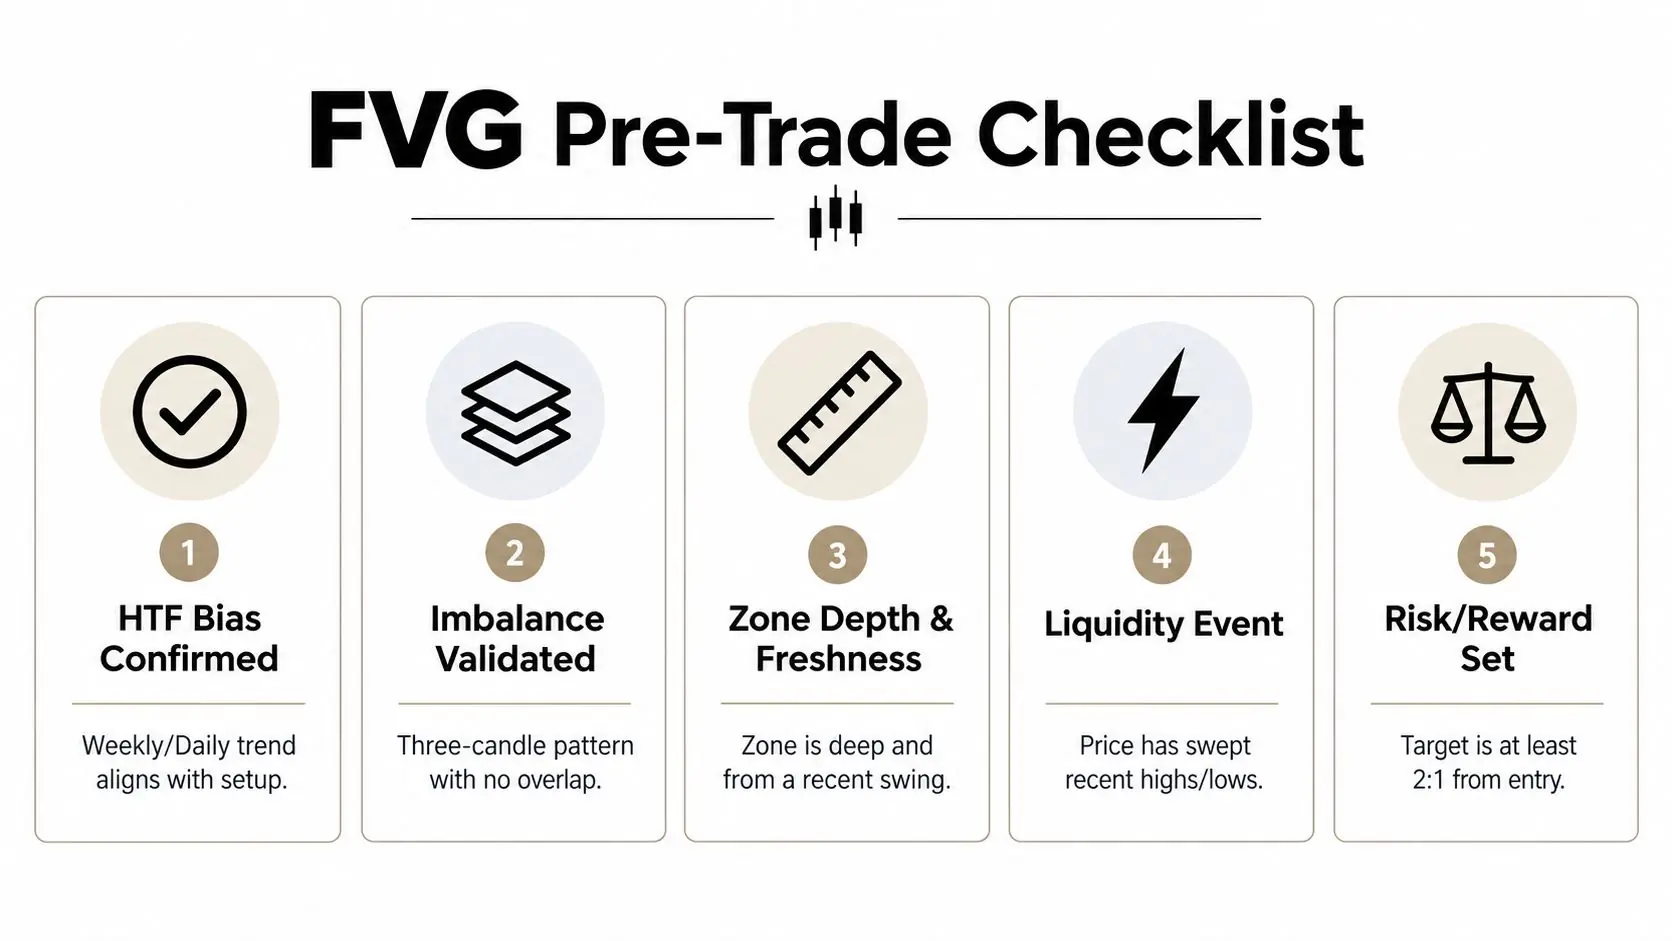
Funded trading adds an operational layer. Scale position size to the account, account for trailing drawdown, and record every setup in a journal that another person could audit. Your journal should show why the FVG qualified, where you entered, why the stop was placed there, and whether you followed the plan.
The framework above is designed to be compatible with typical 5% trailing drawdown and 10% daily-loss parameters, but each firm defines and measures risk differently. Read the specific agreement before trading, especially if the account includes news restrictions, weekend rules, or platform-specific limits.
Trading involves risk of loss. A fair value gap can fail, remain unfilled, or produce a reaction too small to reach your target. Treat the pattern as an analytical tool, not a standalone strategy or a guarantee of performance.
MyFundedCapital offers Instant Funding and 1-Step or 2-Step Challenges, with account options from $5K to $100K and scaling paths up to $500K, plus access to forex, crypto, and commodities. If your FVG process is tested and disciplined, visit MyFundedCapital to compare the available programs and choose an evaluation structure that fits your risk plan.