Most advice on volatility trading options is too simple. “Sell high IV, buy low IV” sounds clean, but it ignores the only part that determines outcomes: what kind of volatility is overpriced, where it sits on the surface, and how your structure carries risk after the trade is on.
Think of volatility like weather. Implied volatility is the market's forecast. Realized volatility is what the weather did. If you want to trade options like a pro instead of a tourist, you need to stop treating IV as a single number and start treating it as a pricing framework. That means reading term structure, skew, vega, gamma, and event risk before you choose the strategy.
Introduction
Volatility trading options isn't about predicting up or down. It's about deciding whether the options market is pricing movement well, badly, or unevenly.
That's the difference between amateur and desk-level thinking. Retail traders often jump from IV Rank straight into a straddle or short premium trade. Better traders ask a harder question first: am I trading a volatility level, an event, a maturity mismatch, or a skew distortion?
Decoding Volatility Implied vs Realized
Start with the forecast versus the tape
A clean way to frame volatility is this:
- Implied volatility: what the options market is pricing for future movement
- Realized volatility: what the underlying asset has done
- Your job: decide whether the market's forecast is too high, too low, or wrong in a specific part of the curve
Schwab describes implied volatility as the annualized percentage the options market uses to express expected future price movement, while realized volatility measures what happened. Traders commonly compare IV with 20, 30, or 50 day historical windows to judge whether options look relatively expensive or cheap, as Schwab explains in its overview of implied volatility and historical comparisons.
That comparison is the starting point. It is not the trade.
If recent movement has been muted but front-month options are priced for expansion, you may have a reason to own volatility. If realized movement has been violent but options still price a sleepy future, buying premium may make sense. But don't stop there. You still need to ask where that IV sits across strikes and expirations.
For a broader grounding in market behavior before drilling into options structure, this guide to navigating market swings is a useful primer.

Why “cheap” options can still be bad trades
A lot of newer traders compare IV to recent movement and stop there. That's how they end up buying “cheap” options that still decay cleanly to zero.
Three reasons that happens:
The event is already priced
Low-looking IV on a chart can still be rich relative to the actual move expected around a catalyst.The wrong expiration is carrying the premium
Front expiry and back expiry can tell very different stories.The underlying doesn't move in a way that helps your structure
Realized volatility isn't just about size. Path matters.
Desk habit: Compare IV to realized volatility first. Then check whether the mispricing is in the event week, the next monthly cycle, or the strike selection itself.
Range tools can help with the realized side. If you use price-based volatility tools alongside options data, this piece on average true range in trading gives a practical way to think about how movement is showing up in the underlying.
What experienced traders are really asking
They aren't asking, “Is IV high?”
They're asking:
- Is front-month IV rich versus back-month IV?
- Is downside protection overpriced relative to upside?
- Is the current IV premium justified by the event path?
- If I'm right on movement, will vega, gamma, and decay still let me monetize it?
That's the mindset shift. You're not trading a label. You're trading a pricing disagreement.
The Language of Volatility Vega and Gamma
Vega is your direct exposure to IV
If you trade volatility trading options, vega is one of the first Greeks you need to respect. The Options Industry Council defines vega as an option's sensitivity to a 1% change in implied volatility, explained in its volatility Greeks guide.
That matters because many traders think they bought a directional setup when they really bought volatility exposure. Around earnings, macro releases, or sharp repricing in risk sentiment, options can reprice hard even before the stock or index makes the move you expected.
In plain terms:
- Positive vega: you benefit if implied volatility rises
- Negative vega: you benefit if implied volatility falls
- High vega structures: they can look right on price and still lose if volatility collapses
Gamma tells you how fast the position reacts
Gamma is the accelerator. It measures how quickly delta changes when the underlying moves.
You don't need a textbook definition to use it well. You need to know what it feels like in a live position:
- Long gamma: your position becomes more responsive as the market starts moving
- Short gamma: the market moves against you faster than your initial delta suggested
- Near-term options: they often feel more “twitchy” because small moves can change the position profile quickly
That's why a long straddle can be powerful in the right setup. You're typically long gamma and long vega, so you benefit if the underlying starts moving and the market reprices volatility higher. The catch is cost. You need movement soon, and you need enough of it.
A basic toolkit view
Here's how I'd frame common long-vol structures to a junior trader:
| Structure | What you're really buying | Best use case | Main weakness |
|---|---|---|---|
| Long straddle | High gamma, positive vega, clean event exposure | You expect a sharp move and want balanced exposure | Expensive premium |
| Long strangle | Similar idea, lower upfront cost | You expect a bigger move but want cheaper entry | Needs more movement |
| Calendar spread | A view on maturity pricing | Front-month event premium versus back-month | Can get messy if both legs reprice |
| Skew trade | A view on relative strike pricing | You think one wing is too rich or too cheap | Layered risk, not beginner-friendly |
For traders learning the mechanics of listed options before specializing in volatility, this practical guide to day trading in options is a decent bridge.
Long volatility doesn't mean safe. Short volatility doesn't mean income. Both can be wrong fast, just in different ways.
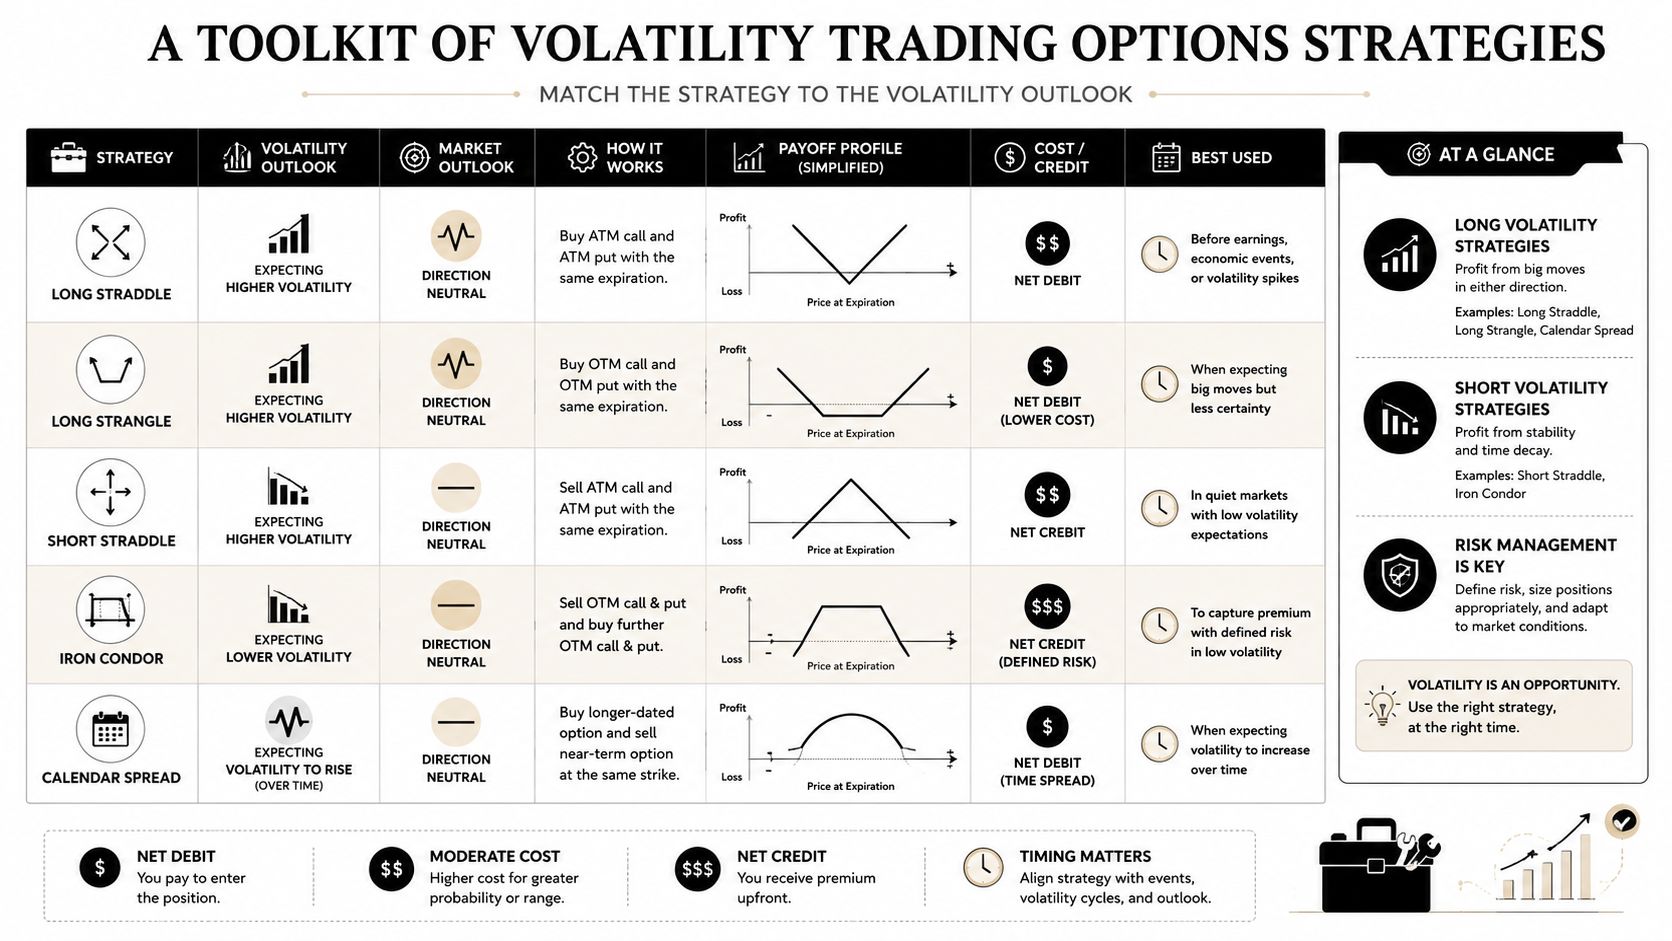
A Toolkit of Volatility Trading Options Strategies
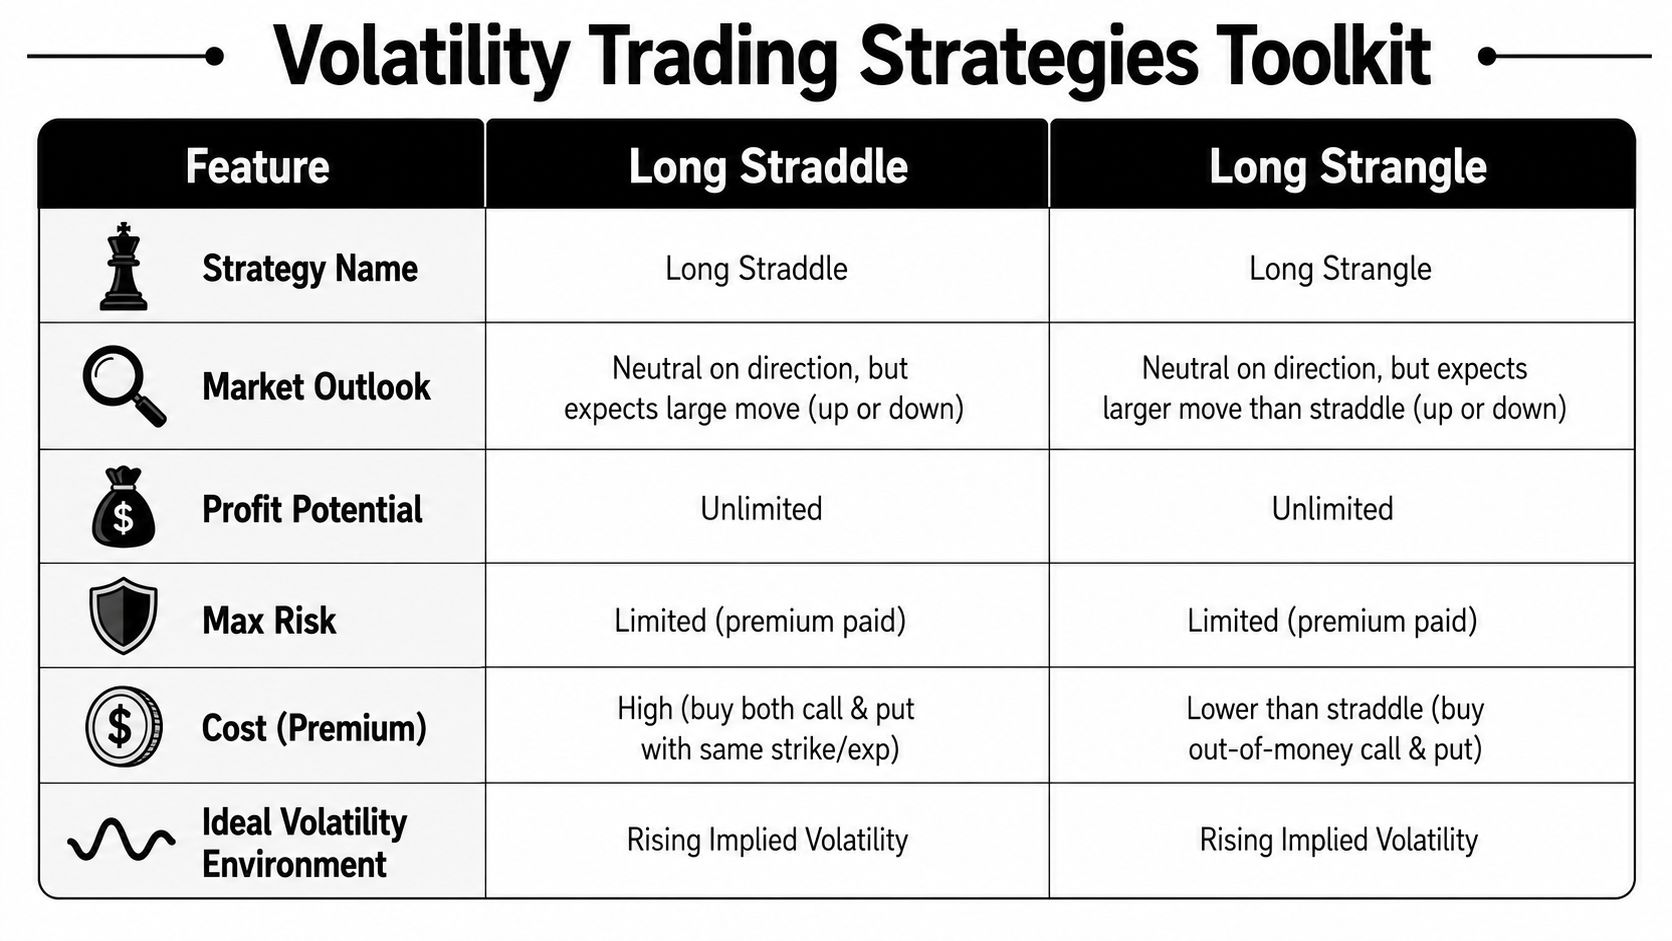
Long straddles and long strangles
These are the first tools most traders meet, and they're useful, but only when the setup fits.
A long straddle is the cleaner expression when you expect a meaningful move but don't have a strong directional view. You're paying more because you're buying at-the-money optionality. That gives you stronger gamma, but the clock starts hurting you immediately if the move doesn't arrive.
A long strangle reduces the premium outlay by moving the strikes out of the money. That can make sense if you think the market is underpricing the size of a move. But the trade-off is obvious. You need a larger move to make it work.
Use them when:
- Event risk is underpriced
- The underlying has a habit of repricing violently
- You expect realized movement to beat what options imply
Avoid them when:
- You're buying because IV Rank looks low without a catalyst
- You have no view on timing
- The move may happen, but after your options decay
Calendar spreads for term structure
A lot of good volatility trading options setups aren't about high or low IV. They're about where IV is rich on the curve.
A calendar spread is useful when you think short-dated options are mispriced relative to longer-dated options. In practice, traders often look at these when a near-term event is pumping front expiry but the back months remain calmer.
What you're really trading:
- The shape of term structure
- The relationship between front premium and back premium
- Whether the event reprices only the nearest expiration or drags the whole curve with it
This structure can be cleaner than a naked long straddle if your edge is maturity selection rather than raw directionless movement.
Skew trades for relative value
Here, most retail content ends, and professional thinking begins.
Institutional commentary on skew points out that skew trades are often built by combining a view on the skew itself with a separate view on whether overall volatility is too high or too low, and that these trades carry layered gamma, vega, and directional risk, as discussed in this desk-oriented look at volatility skew strategies.
That's the key distinction. A skew trade is not just “bullish” or “bearish.” It's often saying:
- downside puts are too expensive relative to calls
- upside is underpriced relative to the rest of the surface
- the wing is wrong, but at-the-money volatility is also wrong
If you don't understand how the structure behaves after a move, don't put on the trade just because it looks “smart.”
A practical pre-trade checklist
Before entering any volatility position, run this list:
Define the view
Are you trading a level, an event, term structure, or skew? If you can't answer in one sentence, the structure is probably premature.Pick the Greek exposure on purpose
Do you want positive vega, positive gamma, or a relative-value expression that reduces one and emphasizes the other?Know what has to happen
Does the trade need a fast move, a steady move, a volatility expansion, or simply no move at all?Map the failure mode
Every options structure has one dominant way it loses. Time decay, IV collapse, runaway directional move, or bad hedge path. Name it before entry.
If your edge comes only from “IV looks high,” you probably don't have an edge yet.
What works and what usually doesn't
What tends to work:
- Matching the structure to the exact volatility view
- Trading events only when you understand how post-event repricing can hit the position
- Using spreads when you want to isolate one part of the volatility surface
What usually fails:
- Buying premium because the chart “feels ready”
- Selling naked premium because the last few trades worked
- Confusing a skew idea with a directional thesis
- Entering long vol too late, after everyone else already paid up for the same event
From Theory to Trade Selection and Sizing
IV Rank is a filter, not a signal
IV Rank and IV Percentile can help you orient quickly. They tell you where current implied volatility sits relative to its own recent history.
Useful? Yes. Sufficient? Not even close.
A trader who relies only on IV Rank usually overlooks a crucial question: which part of the market is expensive? Front-week options might be pumped by an event while the back months are stable. Put skew might be high while at-the-money vol is reasonable. The headline number hides that.
That's why professionals read at least three layers before they place the trade:
Level
Is overall IV rich or cheap versus the underlying's recent behavior?Term structure
Is the front expiry higher relative to later maturities, or is the whole curve moving together?Skew
Are certain strikes carrying a premium because of protection demand or crowding?
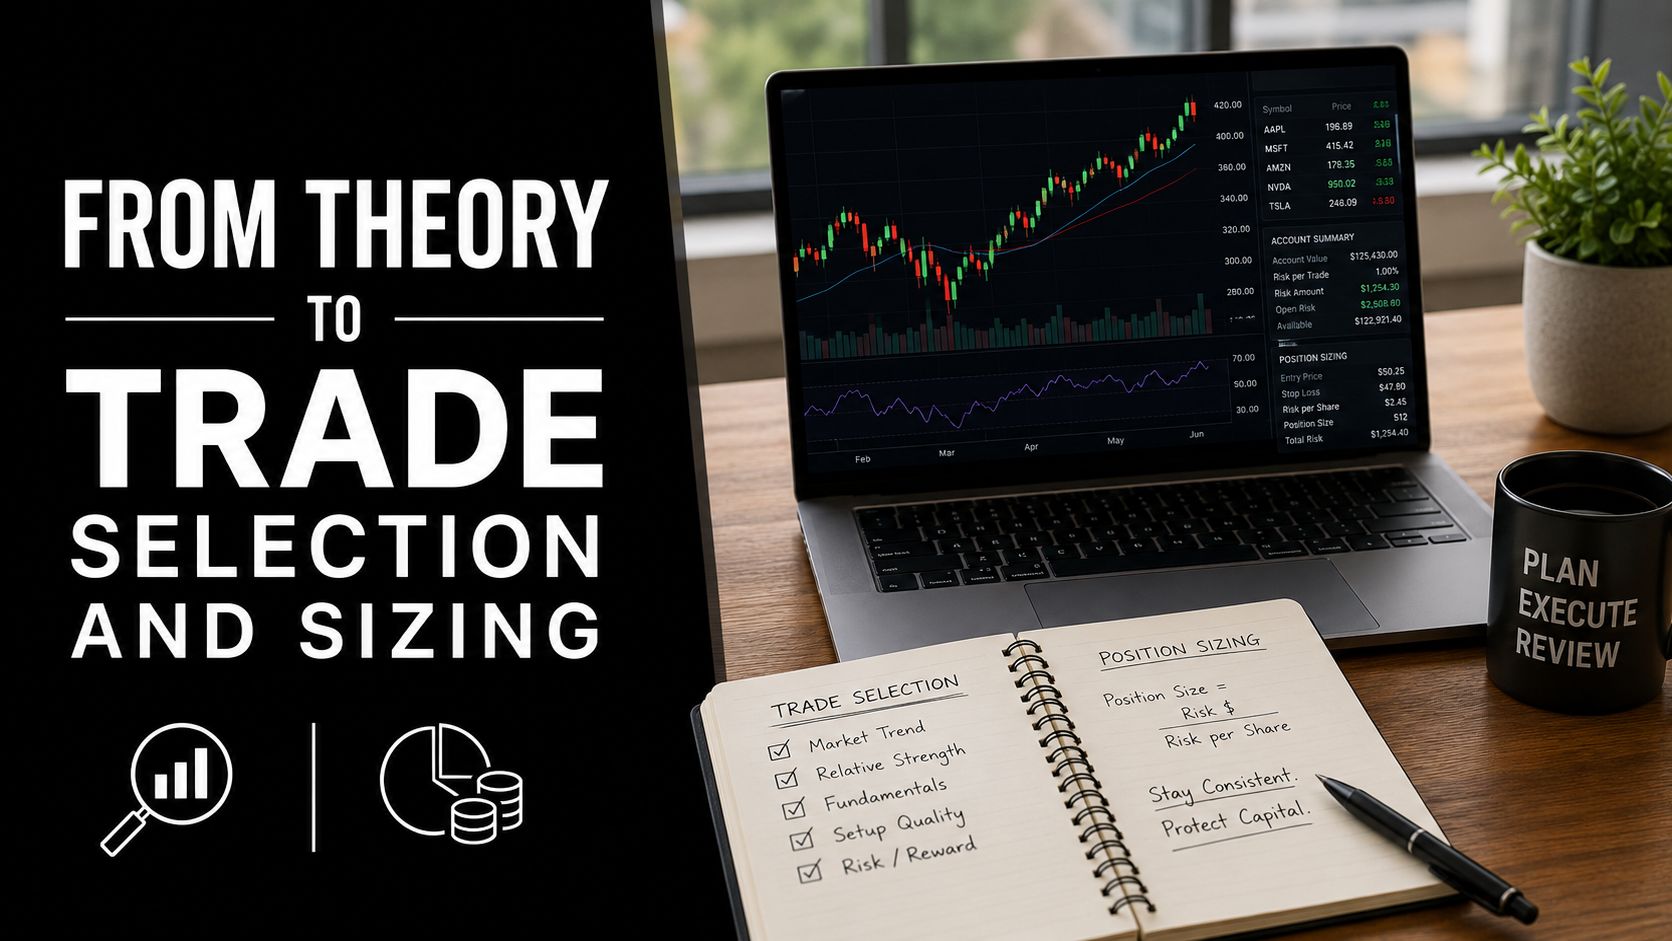
Build the trade plan before the order ticket
Fidelity's educational material warns that a long strangle can lose money even after a large move if implied volatility decreases, which is the classic post-event IV crush problem, as noted in its strangle strategy discussion.
That single point should change how you structure trades. Being “right” on movement isn't enough. You need to be right on timing, implied pricing, and how the option reprices after the move.
A trade plan should include:
Why this structure fits
“I'm using a calendar because the distortion is in front expiry, not the whole curve.”What invalidates the idea
“If front vol doesn't hold into the catalyst, the thesis is weakening.”What you'll do after entry
Reduce, hedge, take profits, or close before the event if the repricing already happened.How much room the trade gets
Defined-risk structures still need size control. Cheap premium can tempt traders into taking oversized positions.
Size for survival first
Small accounts and prop-style risk limits punish sloppy sizing.
A good rule set:
Defined-risk trades still need a cap
Limited loss doesn't mean acceptable loss.Undefined-risk trades need stricter standards
If you can't explain the adjustment plan before entry, skip the trade.Event trades deserve smaller size
Event volatility can change the entire position profile overnight.
I also like to borrow a broader capital mindset from resources focused on long-term discipline. These principles for financial stability and income align well with trading: preserve capital, avoid fragility, and don't mistake activity for edge.
For traders operating in a prop framework, some firms publish risk rules and account structures that force this discipline. MyFundedCapital, for example, runs simulated funded programs with a 5% daily loss limit and up to 10% maximum drawdown, according to its published firm information. That kind of environment punishes oversized volatility bets quickly.
Managing the Risks of Volatility Trading
The real risk isn't being wrong once
The primary risk is carrying a position whose exposure changes faster than you can respond.
That's why volatility traders obsess over the Greeks. Not because they love theory, but because gamma, vega, and delta can drift into a different trade than the one you thought you entered.
Focus on these risk questions every day the position is open:
Delta drift
Has the position become more directional than intended?Gamma exposure
Will a modest move make the position much harder to manage?Vega sensitivity
If implied volatility drops, does the trade still make sense?
A bad volatility trade often starts as a decent idea with unmanaged second-order risk.
IV crush and event traps
One of the most common mistakes in volatility trading options is buying premium too close to a known catalyst without a clear exit plan.
If the market has already paid up for the event, the underlying can move hard and your option can still disappoint. That's why professionals often decide in advance whether they want to:
- Own the event
- Trade the run-up into the event
- Trade the aftermath after the crush resets pricing
Those are different trades. Don't blend them by accident.
Practical ways to reduce event risk:
Use spreads instead of naked long premium
You give up some upside, but you also reduce dependence on a perfect volatility outcome.Take partial profits before the catalyst
If the pre-event IV expansion was the edge, monetize it.Short premium only with a clear disaster plan
Collected premium feels good until gamma turns against you.
Undefined risk needs professional discipline
Short straddles and short strangles can work in stable markets, but they are not beginner structures. The premium received can hide how ugly the position becomes once price starts running or volatility expands.
If you insist on using undefined-risk structures, set rules before entry:
| Risk area | What to decide in advance |
|---|---|
| Adjustment point | At what point do you hedge, reduce, or close? |
| Volatility shock | What happens if IV jumps before you can react? |
| Liquidity | Can you exit efficiently in stressed conditions? |
| Portfolio impact | Does this trade stack risk with other positions? |
A professional doesn't ask, “How much can I make if this works?” A professional asks, “How many bad outcomes can I survive if this trade behaves badly?”
That's the whole game. Trading involves risk of loss. This article is educational only and isn't financial advice.
FAQ and Your Path to Funded Trading
Can I trade volatility with a small account
Yes, but your menu is smaller. Defined-risk structures usually make more sense because they limit the damage from one bad read. Small accounts also make it harder to diversify across expirations and underlyings, so trade frequency should stay lower and setup quality should stay higher.
Is volatility trading better in index products or single stocks
They behave differently. Single stocks often carry sharper event risk and more violent repricing around company-specific news. Index products usually reflect broader macro flows, hedging demand, and surface effects across the market. If you're learning, index-related products can be simpler to read structurally. If you want a broader view of that path, this option trading prop firm guide connects options-style thinking with index markets.
Is gamma scalping realistic for retail traders
It can be, but it's harder than people think. You need clean execution, discipline around re-hedging, and a structure that gives you enough gamma to monetize movement after costs and slippage. Most newer traders are better off first learning how long gamma behaves inside simple structures like straddles and calendars.
What's the biggest mistake beginners make in volatility trading options
Treating IV as a single on or off signal. Good traders don't just ask whether IV is high or low. They ask where it's rich, what catalyst is driving it, how the surface is shaped, and whether the structure they picked expresses that view cleanly.
If you've read this far, you already know the standard strategy lists aren't enough. The next step is proving you can apply this with discipline: choose the right structure, control size, and stay inside hard risk limits.
If you want to put that skill set to work, learn more about MyFundedCapital and compare its funding paths. You can review challenge models, account sizes, and risk parameters, then choose the route that fits your style if you're ready to trade with discipline.