
Struggling to find reliable entry and exit points in a volatile market? This guide explains how to use the Bollinger Bands indicator to identify high-probability trade setups without the hype. You'll learn a practical, step-by-step framework for building a trading strategy that emphasizes risk management, a critical skill for passing a prop firm challenge.
Building a Bollinger Bands Strategy That Works
This guide is about building a practical Bollinger Bands strategy that can hold up under the pressure of prop firm trading. We'll skip the abstract theories and get right into the nuts and bolts of setting up your charts, spotting high-probability trades, and managing your risk so you don't violate drawdown limits. This content is for educational purposes only and is not financial advice; all trading involves the risk of loss.
We'll cover two core methods—trading breakouts and pullbacks—with clear rules for entries, exits, and stop-losses, using examples on assets like EUR/USD and the US100. The goal is to give you a complete framework you can start testing and refining to build the consistency needed to pass a funded challenge.
The Three Pillars of a Solid Strategy
Every functional trading plan, especially one using Bollinger Bands, is built on three pillars:
- Setup: Configuring the indicator for the specific market and timeframe you're trading.
- Identification: Training your eye to recognize specific, high-probability patterns, like the classic "Squeeze" or a pullback to the middle band.
- Management: Defining your position size, stop-loss, and profit targets before you place a trade.
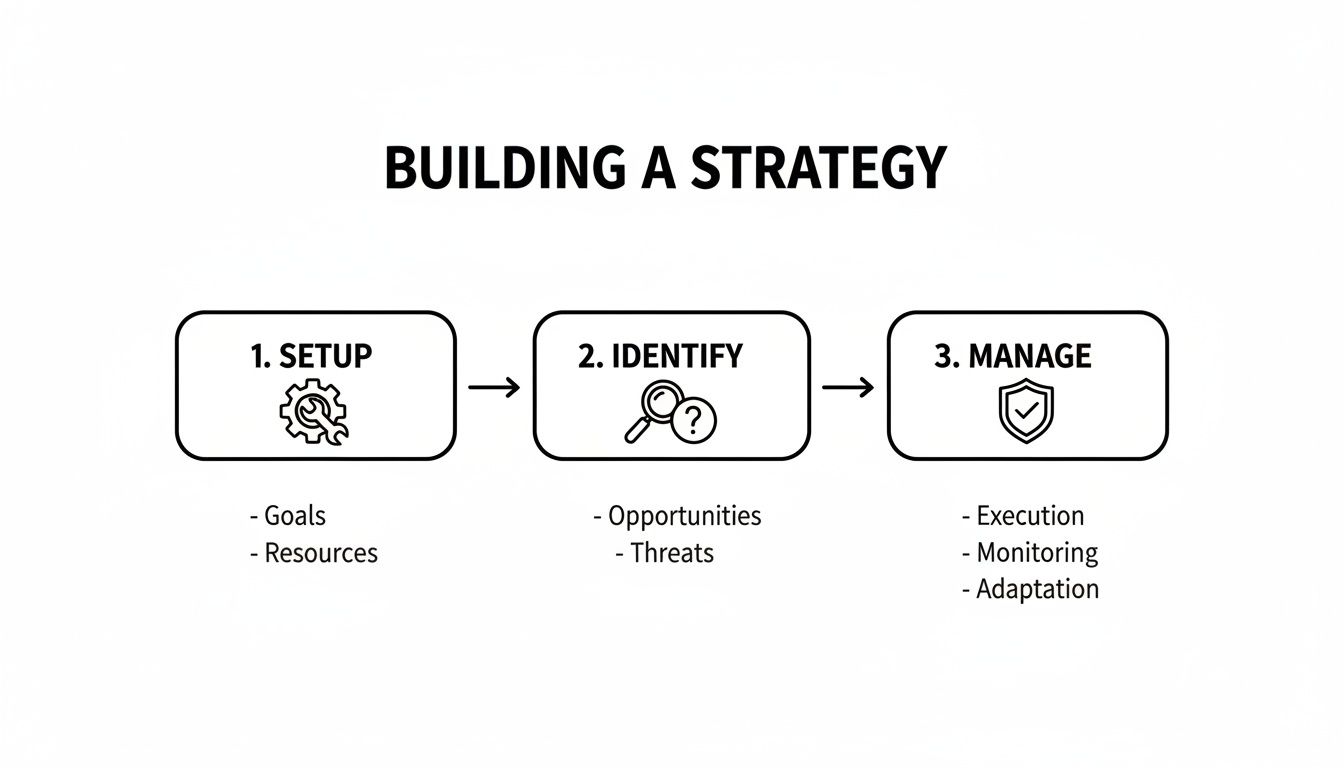
Following this flow turns trading into a disciplined process. It removes guesswork and emotional decisions, which is crucial for long-term success.
Why This Framework Matters for Prop Trading
In a prop firm challenge, consistency is rewarded over hitting one massive home run. The daily and maximum drawdown rules favor traders who can generate steady gains while protecting their capital. A structured approach is tailor-made for this environment.
- Clarity on Entries: It eliminates guesswork. A candle closing outside the bands becomes a clear, objective signal.
- Defined Risk: It forces you to calculate your risk before entering, making it much harder to accidentally violate a firm's daily loss limit.
- Repeatable Process: It gives you a systematic approach, which is key to building a solid track record and passing your evaluation.
Let's dive in and start by getting the bands set up for optimal performance.
Fine-Tuning Bollinger Bands to Match Your Trading Style
The standard Bollinger Band settings are a starting point, not a universal rule. A successful strategy comes from tweaking them to fit the market, your chosen timeframe, and your personal style.
Most trading platforms, like cTrader and DXtrade, default to the '20,2' setup. This means the middle line is a 20-period simple moving average (SMA), with the upper and lower bands drawn two standard deviations away. It’s a reliable baseline for spotting trends on daily or 4-hour charts, but adjusting these numbers is what separates a decent strategy from a great one.
How to Adjust Your Settings
Changing the period and standard deviation directly impacts how the bands react to price.
- Shorter Period (e.g., 10-period): This makes the bands "hug" the price more closely, reacting instantly to every move. It’s useful for day traders and scalpers, but you'll get more false signals.
- Longer Period (e.g., 50-period): This smooths everything out, making the bands less jumpy and better at ignoring short-term market noise. It's ideal for identifying the primary trend on a daily chart. You’ll see fewer signals, but they are often more reliable.
The standard deviation setting controls the channel width. Increasing it to 2.5 or 3 widens the bands, meaning the price must make a bigger move to touch them. This is a great way to filter out noise in choppy, range-bound markets.
Adapting Your Bands to Different Assets
Every asset has its own personality. A volatile commodity like Gold (XAU/USD) moves differently from a calmer currency pair. For instance, a fast-moving pair like GBP/JPY might constantly trigger false signals on a 10-period setting. In that scenario, widening the standard deviation slightly to 2.1 or 2.2 can make a huge difference.
A solid grasp of market behavior is key. To build on that foundation, you may find our guide on technical analysis tips and charting trends helpful.
Here is a simple comparison of common settings to guide your own testing:
Standard vs. Adjusted Bollinger Band Settings
| Parameter Setting | Period (SMA) | Standard Deviations | Best For | Signal Frequency |
|---|---|---|---|---|
| Short-Term | 10 | 1.9 or 2.0 | Scalping, day trading in volatile markets | Very High |
| Standard | 20 | 2.0 | Swing trading on H1/H4 charts | Moderate |
| Long-Term | 50 | 2.0 or 2.1 | Position trading, confirming major trends on daily charts | Low |
| Noise Filtering | 20 | 2.5 or 3.0 | Reducing false signals in choppy markets | Very Low |
Your goal is to find a configuration that fits your trading psychology and the specific patterns you’re hunting. The next logical step is to backtest your chosen settings to confirm they produce consistent results for your strategy.
Trading Volatility with the Bollinger Band Squeeze
The Bollinger Band Squeeze helps you spot the calm before the storm and position yourself for a breakout. It’s a classic setup, but trading it effectively within the tight risk rules of a prop firm requires precision.
Identifying the Squeeze Setup
A Bollinger Band Squeeze occurs when volatility dries up and the upper and lower bands contract. This consolidation is like a spring coiling up before it releases.
For an objective measure, use the Bollinger Band Width indicator. When this tool plots the distance between the bands as a single line, and that line hits a new low (e.g., the lowest point in the last 120 candles), a squeeze is on. This is a high-probability setup that warrants close attention.
Rules for Entry and Confirmation
A valid breakout requires more than just a candle closing outside the bands. You need confirmation to avoid getting chopped up by false signals.
Here are two filters to use with every squeeze trade:
- Volume Confirmation: A true breakout has power. Look for a noticeable spike in volume as price leaves the consolidation range. A breakout on weak volume is a major red flag that often signals a "head fake."
- Momentum Confirmation: A momentum oscillator like the Relative Strength Index (RSI) helps verify the move's direction. For a bullish breakout, look for the RSI to cross above 50 (or 60 for a stronger signal).
This chart perfectly captures the pattern: a quiet contraction of the bands, then a powerful expansion as price takes off.
Stop-Loss and Profit Target Placement
Knowing your exit points before you enter is non-negotiable.
- Stop-Loss: For a long (buy) trade, place your stop-loss just below the low of the breakout candle or below the middle band (the 20-period SMA). For a short, reverse this logic. This clear placement helps you stay within strict prop firm drawdown limits.
- Profit Target: A simple method is to target a fixed risk-to-reward ratio, like 1:2 or 1:3. A more advanced technique is to trail your stop-loss just under the middle band, letting you ride the trend for maximum profit.
This approach works well on major indices after consolidation. Backtests on the S&P 500 going back to 1993 have shown this pattern's effectiveness. You can find more backtesting data on this at QuantifiedStrategies.com. Many traders at firms like MyFundedCapital use this strategy on higher timeframes like the 4-hour or daily chart on platforms such as cTrader to filter noise and get cleaner signals.
Using Pullbacks and Reversals for Consistent Entries
Chasing breakouts can be frustrating. A more consistent and less stressful way to trade is by working with the market's natural rhythm. The two setups below, the Trend-Following Pullback and the Mean Reversion Bounce, often generate a higher win rate, which is great for building the discipline needed to pass a prop firm challenge.
Riding the Trend with Pullbacks
The most straightforward way to use Bollinger Bands is to follow an established trend. During a strong uptrend, the price will often pull back from the highs to re-test the middle band (the 20-period SMA). This is your potential buy zone.
Here is the step-by-step process:
- Identify the Trend: Is the price generally "walking the band" up or down?
- Wait for the Pullback: In an uptrend, wait for the price to pull back and touch the middle band. In a downtrend, wait for it to rally and touch the middle band.
- Look for Confirmation: Wait for a clear sign of support or resistance at the middle band, like a hammer candle or a bullish/bearish engulfing pattern, before entering.
- Set Your Stop-Loss: Place your stop-loss just below the recent swing low for a long trade, or just above the recent swing high for a short. This defines your risk on every trade.
Data supports this approach. A backtest of a Bollinger Band Pullback System showed a 66% win rate and an average annual return of 14% over 25 years. You can discover more insights about these findings, which confirm that price tends to revert to its average.
Catching the Snap-Back: The Mean Reversion Play
The Mean Reversion Bounce is about betting against a short-term, over-extended move. When the price stretches too far from its average and hits an outer band, it’s often likely to snap back. However, blindly trading every touch of an outer band is a fast way to lose money. You need a filter.
My favorite confirmation tool is the Relative Strength Index (RSI). Here is the exact two-step setup:
- For a Potential Long (Buy):
- Price must touch or close below the lower Bollinger Band.
- At the same time, the RSI must be in oversold territory (below 30).
- For a Potential Short (Sell):
- Price must touch or close above the upper Bollinger Band.
- Simultaneously, the RSI must be in overbought territory (above 70).
The RSI confirms that momentum is fading. Once both conditions are met, look to enter on the first candle that closes back inside the bands. The middle band is a natural first target for taking profit.
Smart Risk Management for Funded Trading Accounts
You can have the best strategy, but it's worthless if you blow up your account. For a prop firm trader, where drawdown rules are absolute, risk management is everything.
It starts with position size. On a $100,000 account with a 5% daily drawdown limit, you cannot lose more than $5,000 in a day. If your stop-loss on a EUR/USD trade is 25 pips away, your lot size must be calculated to keep that potential loss well under the $5,000 limit. This is not a suggestion; it's the line between traders who get funded and those who fail.

Defining Your Risk-to-Reward Ratio
Only take trades that offer at least a 1:2 risk-to-reward ratio. This means for every dollar you risk, you have a clear path to making at least two.
- Risk: Your stop-loss is placed at 20 pips.
- Reward: Your take-profit target is set at 40 pips.
With this structure, you only need to win one out of every three trades to break even (excluding commissions). This statistical edge is your lifeline. A strict risk-to-reward rule is what keeps you in business. You can learn more in our guide on Forex risk management strategies.
Trailing Your Stop to Maximize Winners
A trailing stop-loss helps you protect profits and let winners run. When a trend is established, the middle band becomes your guide.
- For a long trade: As the price and the middle band climb, continually adjust your stop-loss upward, keeping it just underneath the middle band.
- For a short trade: As the price falls, move your stop-loss down, keeping it just above the middle band.
This technique forces you to stay in a winning trade as long as momentum is strong. The trade closes only when the trend shows genuine weakness by crossing back over the middle line.
Proving Your Strategy: How to Backtest and Automate
A strategy is just an idea until you test it. Backtesting is the only way to know how your rules would have performed against historical market data. Platforms like cTrader have built-in tools that let you run these simulations.
What to Look For in Your Backtest Report
When you review your backtest report, focus on these metrics:
- Maximum Drawdown: This is the biggest drop your account would have taken. If this number is larger than your prop firm's limit (e.g., 10% at MyFundedCapital), the strategy is not viable.
- Profit Factor: This is your gross profit divided by your gross loss. A profit factor over 1.5 is solid, and anything above 2.0 is exceptional.
- Win Rate & Average Win/Loss: A 30% win rate can be profitable if the average winner is five times larger than the average loser. Look at these two numbers together.
Academic studies on Bollinger Bands strategies have shown real-world profitability. One paper reported a max drawdown of just -3.08% on S&P 500 stocks, well within the risk limits of most prop firms. You can check out the research findings yourself.
Taking It to the Next Level with Automation
Once you've proven your strategy has a statistical edge, automation is the next step. An Expert Advisor (EA) or trading bot removes emotion and ensures you never miss a signal. For a Squeeze breakout, a bot can monitor the Bollinger Band Width indicator and execute a trade with a pre-set stop-loss and take-profit the moment your conditions are met.
This systematic execution is exactly what prop firms value. If you're exploring the tools for this, we've put together a guide on the best backtesting software for traders that you might find useful.
FAQ: Your Top Bollinger Bands Questions
Here are answers to some common questions traders have about using Bollinger Bands.
What is the best timeframe for a Bollinger Bands strategy?
There is no single "best" timeframe; it depends on your trading style.
- Day traders and scalpers often focus on 5-minute to 15-minute charts to trade Squeeze breakouts around major session opens.
- Swing traders typically prefer the 1-hour or 4-hour charts to get a clearer view of the trend and spot high-probability pullbacks.
The key is to pick one or two timeframes and master how the price behaves on them.
Can I trade with just Bollinger Bands?
You could, but it's not recommended. Bollinger Bands are excellent for gauging volatility but don't tell the whole story. Adding a confirmation tool like the RSI for mean reversion plays or volume for breakouts dramatically increases your odds by filtering out noise. Using them in isolation is like trading with only half a map.
How do I handle false breakouts from a Squeeze?
False breakouts are a part of trading. The goal is to manage them. Here’s a simple checklist:
- Wait for a Candle Close: Never enter on a wick that pokes outside the band. Wait for the candle to close firmly outside the band.
- Check the Volume: A genuine breakout should have strong volume behind it. A breakout on weak volume is a major red flag.
- Define Your Stop-Loss: Always have a hard stop-loss set before you enter. If a trade breaks out and then quickly snaps back inside the bands, cut the loss quickly and move on.
Ready to put your Bollinger Bands strategy to the test? MyFundedCapital provides the capital and transparent rules you need to succeed as a funded trader.
Compare our funding programs and start your challenge today.