
Struggling to find reliable entry and exit points in your day trading? A VWAP trading strategy uses the Volume Weighted Average Price (VWAP) indicator to reveal where the real money is moving, helping you trade alongside institutional benchmarks. This guide will provide actionable steps and concrete examples to help you build a robust VWAP trading strategy.
Trading any financial market involves substantial risk of loss and is not suitable for all investors. This content is for educational purposes only and is not financial advice. No "get rich quick" promises are made; success requires discipline, risk management, and a solid strategy.
What Is the VWAP and Why Does It Matter for Day Traders?
If you've ever felt like price action alone isn't giving you the full picture, you're not wrong. A big price move on heavy volume means something entirely different than the same move on barely any trades. This is precisely where the VWAP indicator gives you an edge.
Unpacking the Volume Weighted Average Price
The VWAP is a dynamic, session-based calculation that starts fresh every trading day. By blending both price and volume, it shows you the average price paid for an asset throughout the day, weighted by the amount of volume at each price level. This makes it a far more honest benchmark for an asset’s value during a trading session.
Big funds and institutions often try to buy below the VWAP and sell above it to prove they got a good deal. This behavior can turn the VWAP line itself into a self-fulfilling magnet for price.
VWAP vs. a Simple Moving Average (SMA)
It’s easy to mix up the VWAP with a Simple Moving Average (SMA), but they tell you very different stories. An SMA simply gives you the average price over a certain number of candles, treating each one equally. The VWAP, on the other hand, gives more weight to price levels where significant trading activity occurred.
Because of this key difference, many seasoned day traders see the VWAP as a more accurate reflection of an asset's "fair value" for that day.
How VWAP Informs Trading Decisions
For traders trying to build a consistent approach, the VWAP provides an invaluable visual anchor for reading the market. It cuts through the noise and helps you answer the most important questions of the day:
- Who's in control? When price holds consistently above the VWAP, bulls are generally in charge. When it's stuck below, the bears have the upper hand.
- Where are potential opportunities? In a strong uptrend, a dip back down to the VWAP line can often be a spot to look for a long entry.
- Is the price getting stretched? If the price has rocketed far above (or plummeted far below) the VWAP, it might be overextended and due for a pullback toward the mean.
Just remember, a VWAP trading strategy is a framework, not a magic bullet. It's a powerful tool for adding context to your trades, but it doesn't eliminate risk.
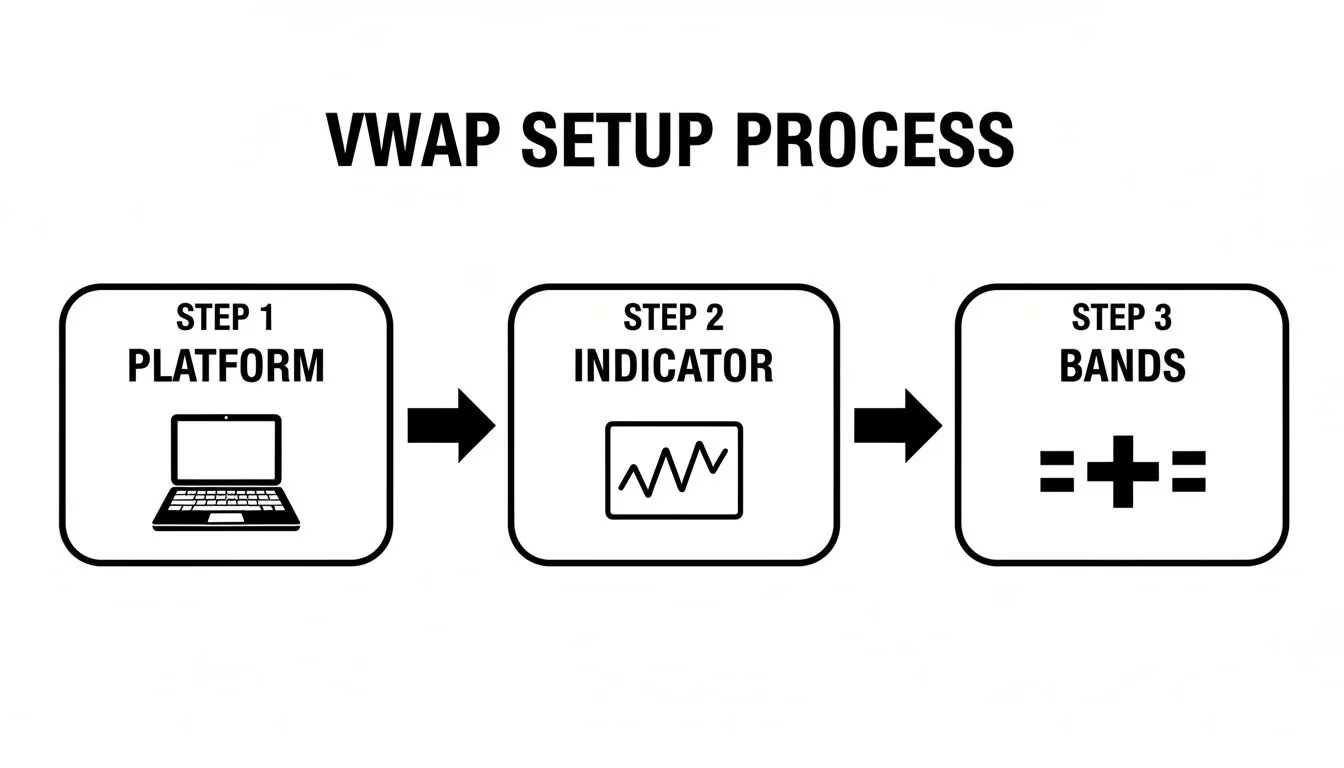
How to Set Up the VWAP Indicator on Your Charts
Before you can trade with VWAP, you need to get your charts set up correctly. Adding the VWAP indicator is a breeze on most modern platforms like DXtrade or cTrader.
Step 1: Add the Core VWAP Indicator
First, pull up the chart for the instrument you're watching (e.g., EUR/USD or US30). Head over to your platform's indicator list and search for "VWAP" or "Volume Weighted Average Price." Once you add it, a single line will appear on your chart.
This line is your anchor—the volume-weighted average price for the session.
Step 2: Configure the Standard Deviation Bands
Standard deviation bands turn the VWAP from a simple line into a dynamic trading tool. They measure volatility around the core VWAP line, creating a "value area" for the trading session.
To set this up, go into the indicator's settings and look for fields like "Band Multiplier" or "StdDev."
- First Standard Deviation: Enter multipliers of 1.0 and -1.0. The area between these bands is often considered the "fair value" range for the session.
- Second Standard Deviation: Add another layer using multipliers of 2.0 and -2.0. A move to these bands signals a more significant stretch from the average and can act as strong support or resistance.
Step 3: A Practical Chart Setup
Let's walk through a typical configuration for day trading.
- Load the Indicator: Find and add "VWAP" from your platform's indicator library.
- Open Settings: Right-click the VWAP line and choose "Properties" or "Settings."
- Set Up Bands:
- Set the first upper/lower band multiplier to 1.0.
- Set the second band multiplier to 2.0.
- Customize Colors: Use distinct colors to tell everything apart. For example, a bold white VWAP line, blue for the first deviation bands, and red for the outer second deviation bands.
Once this is done, you have a dynamic map showing the session's fair value area, potential bounce zones, and signals of when price is getting overextended. This setup is the foundation for any effective VWAP trading strategy.
Core VWAP Trading Strategies You Can Use Today
With your charts set up, it’s time to move from theory to actual trades. Think of VWAP not as one rigid set of rules, but as a framework for reading the day's price action against an institutional benchmark.
Let's break down three practical, rules-based approaches.
1. The VWAP Pullback Strategy
This is a classic VWAP play for trend-following traders. The idea is simple: in an established trend, wait for the price to pull back to the VWAP line and use it as a dynamic entry point.
Rules for a Bullish VWAP Pullback
- Entry Condition: The market is in an uptrend, staying consistently above the main VWAP line. Wait for the price to dip back and touch the VWAP. The trigger is a bullish candle (e.g., a hammer) forming at the VWAP, signaling that buyers are defending that level.
- Stop-Loss Placement: A logical spot for your stop is just below the low of that entry candle or, more conservatively, below the first lower standard deviation band.
- Take-Profit Targets: Your initial target can be the trend's most recent high. After that, look to the first and second upper standard deviation bands.
Rules for a Bearish VWAP Pullback
- Entry Condition: The price is in a downtrend, trading below the VWAP. Wait for a rally back up to the VWAP. Your entry signal is a clear bearish candle pattern (e.g., a shooting star) forming at the VWAP line.
- Stop-Loss Placement: Set your stop-loss just above the high of your entry candle or above the first upper standard deviation band.
- Take-Profit Targets: The previous low is your first logical target. From there, the first and second lower standard deviation bands are good secondary targets.
The secret to this strategy is patience. You aren't chasing price; you're letting it come back to a high-probability zone of value. As you get comfortable with this, you'll see how learning to create a forex strategy based on technical analysis involves layering these kinds of concepts into a cohesive plan.
2. The VWAP Breakout Strategy
While pullbacks help you join an existing trend, breakout strategies are about catching the start of a new one. This approach works well when the price is consolidating in a tight range around the VWAP.
A breakout happens when price explodes out of this consolidation and through the VWAP with a surge in volume.
- Bullish Breakout: Price shoves above the consolidation range and the VWAP on a clear spike in volume. A long entry can be taken as that powerful breakout candle closes.
- Bearish Breakout: Price breaks down below the tight range and the VWAP, again with a noticeable jump in volume. A short position can be opened on the close of that candle.
Managing a VWAP Breakout Trade
- Entry: Enter on the close of the strong candle that breaks both the VWAP and the prior consolidation range.
- Stop-Loss: Place your stop on the other side of the VWAP line (below for a long, above for a short).
- Take-Profit: The second standard deviation band is an excellent primary target because it represents a major deviation where initial momentum might stall.
3. The VWAP Mean Reversion Strategy
This third VWAP trading strategy is based on the idea that prices, after making extreme moves, tend to gravitate back toward their average (the VWAP). This strategy works best in ranging or choppy markets.
The entry signals come from the outer standard deviation bands.
- The Setup: Price makes an extended move to the second or even third standard deviation band without a significant pullback, signaling a potentially overbought or oversold market.
- The Entry:
- Long Entry: Look for the price to hit the second lower band and then print a reversal candle (like a bullish pin bar). This suggests selling pressure is exhausted and the price may "snap back" toward the VWAP.
- Short Entry: Look for the price to tag the second upper band and form a clean bearish reversal pattern, suggesting a move back down to the VWAP is likely.
- The Targets:
- Stop-Loss: Place your stop just outside the extreme of the reversal candle (above its high for a short, below its low for a long).
- Take-Profit: The primary profit target is simple: the VWAP line itself.
Remember, successfully trading any of these strategies requires discipline and robust risk management. No indicator is a crystal ball, and taking losses is a part of trading.
Advanced VWAP Techniques and Risk Management
Once you're comfortable with the basic VWAP strategies, you can add layers to your analysis to find a greater edge. This is about seeing the bigger picture and combining your strategy with ironclad risk management—a crucial skill for prop firm trading.
Using Multiple VWAP Periods for Greater Context
The daily VWAP is great for intraday trading, but adding weekly and monthly VWAPs provides powerful long-term context.
- Session VWAP: Your intraday compass, resetting daily.
- Weekly VWAP: Starts on Monday's open and shows the average price for the week. It often acts as a major support or resistance level.
- Monthly VWAP: The 30,000-foot view. When price approaches the monthly VWAP after a long trend, it can signal a major turning point.
When these longer-term VWAPs line up with your daily VWAP (a concept called confluence), it can signal a much higher-probability trade setup.
Combining VWAP with a Momentum Indicator
VWAP identifies value, but it doesn't measure momentum. Pairing it with an oscillator like the Relative Strength Index (RSI) can provide the confirmation needed to act with more confidence.
A classic setup is a VWAP pullback confirmed by the RSI.
- Example: Price is in an uptrend and pulls back to the VWAP line. That's your alert. A bullish pin bar forming at the VWAP while the RSI is turning up from oversold territory (crossing above 30) is your entry signal. It tells you that both institutional value (VWAP) and retail momentum (RSI) are aligning.
This simple filter helps you avoid weak bounces and build a stronger case for your trade.
VWAP Entry and Exit Signal Checklist
Using a checklist turns a subjective feeling into an objective, rules-based decision. Before placing a trade, run through these points to confirm you have a high-probability setup.
| Checklist Item | Bullish Signal (Long) | Bearish Signal (Short) |
|---|---|---|
| Market Context | Price is in an overall uptrend | Price is in an overall downtrend |
| VWAP Location | Price pulls back down to the VWAP | Price rallies up to the VWAP |
| Candlestick Pattern | Bullish pattern forms (e.g., pin bar, engulfing) | Bearish pattern forms (e.g., shooting star) |
| Momentum Confirmation | RSI is oversold or hooking up from below 50 | RSI is overbought or hooking down from above 50 |
| Volume Confirmation | Volume increases on the confirmation candle | Volume increases on the confirmation candle |
| Risk/Reward | Potential reward is at least 1.5x the risk | Potential reward is at least 1.5x the risk |
If you can't tick most of these boxes, it's often best to wait for a better opportunity.
A Practical Risk Management Framework
Advanced techniques are useless if you blow up your account. This is especially true when trading for a prop firm, where rules like maximum daily drawdown are not suggestions—they are hard limits.
Every trade must begin with one question: "Where am I wrong, and how much will it cost me?"
Let's use a real-world example with a $100,000 account and a 5% daily drawdown limit.
- Define Risk Per Trade: A professional standard is risking no more than 1% of your account on a single idea. On a $100,000 account, that’s $1,000.
- Identify Invalidation Point: For a VWAP pullback long trade, your stop-loss might go below the first VWAP standard deviation band. Let's say this is 20 pips from your entry.
- Calculate Position Size: This is simple math, not guesswork.
- $1,000 (Max Risk) / 20 pips = $50 per pip
- This means you can trade 5 standard lots (since 1 lot of EUR/USD is ~$10/pip).
This process ensures that if the trade fails, the loss is contained and you live to trade another day. It is a critical habit detailed further in our guide to forex risk management strategies.
Adapting Your VWAP Strategy for Prop Firm Success
Trading for a prop firm is different. Your success hinges on sticking to a strict set of rules, where consistency and discipline matter more than hitting one massive home run. Your VWAP strategy must be dialed in for this unique environment.
The game shifts from maximizing every trade to producing steady, repeatable gains while protecting capital at all costs.
Aligning VWAP With Prop Firm Risk Rules
The first rules to burn into your brain are the drawdown limits (e.g., 5% maximum daily drawdown, 10% total drawdown). One oversized trade can get you disqualified.
Your VWAP strategy must be built around these hard stops. Before entering a trade, calculate your position size so that a full stop-loss hit won't breach your personal risk per trade (e.g., 0.5% – 1% of your starting balance).
Prop firm trading is fundamentally a game of risk management. Your VWAP strategy finds opportunities, but your risk protocol keeps you in the game.
Using VWAP to Target Realistic Profit Goals
Survival is about managing risk, but passing a challenge requires hitting a profit target (e.g., 10%). The smart way to get there is by using VWAP levels to methodically chip away at that target.
Instead of swinging for the fences, focus on high-probability setups like VWAP rejections or pullbacks. A trade that banks a 1% or 1.5% gain is a huge win. Stringing together six or seven of these well-managed trades is a far more reliable path to hitting your goal than gambling on one high-risk move.
Documenting Your Trades for Consistency
The secret weapon of any serious prop firm trader is a meticulous trade journal. This isn't optional. Every VWAP trade you take needs to be documented.
Track the following for every trade:
- The Setup: Which VWAP strategy did you use? (e.g., Pullback, Rejection).
- The Entry: Screenshot of the chart with your entry marked.
- Your Rationale: Why did you take this trade?
- The Outcome: The final P/L and an exit screenshot.
- The Review: What went right? What could be improved?
This process of documentation and review is what elevates your trading from a hobby to a professional operation. It helps you discover what truly works within the firm's rules. For more details on prop firm challenges, check out our guide on the prop firm challenge.
VWAP Trading Strategy FAQ
Is VWAP better than a moving average?
They are different tools for different jobs. A Simple Moving Average (SMA) is great for identifying longer-term trends. VWAP is a specialist for intraday analysis because it incorporates volume, showing where significant money has been traded during the day. Many traders use both: the SMA for macro context and VWAP for intraday execution.
What are the best timeframes for a VWAP strategy?
Since VWAP is an intraday indicator that resets daily, it's best used on lower timeframes. Most VWAP traders use the 5-minute and 15-minute charts for their entries and exits. However, it's crucial to analyze higher timeframes (like the 1-hour or 4-hour) first to understand the overall market context and trend.
Can the price stay away from VWAP all day?
Yes, and this is critical to understand. On strong trend days, often driven by major news, the price can open far from the VWAP and continue moving in one direction all day without pulling back. Trying to short a powerful uptrend just because it's "overextended" from VWAP is a recipe for significant losses. Identifying the market type (trending vs. ranging) is the first step in applying the correct VWAP strategy.
Ready to put your VWAP trading strategy to the test in a professional trading environment? At MyFundedCapital, we provide the platform, support, and capital to help you succeed.
Compare our funding programs and start your journey to becoming a funded trader today.