You can click into a chart, see US30, NAS100, or GER40, and still get tripped up by the simplest part of the trade, the sizing. The numbers on the screen look clean, but the contract spec, tick value, and account currency can make a good idea turn into a sloppy risk decision if you don't check the math first.
A proper calculator for indices does more than spit out a generic lot size. It helps you turn the contract sheet, the stop distance, and the account currency into a position you can defend.
Free resources: Forex & Prop Trading Glossary (drawdown, breach, lot, pip and the rest in plain words), and the free Position Size Calculator.
Why Index Calculations Trip Up So Many Traders
Open a US30 ticket on one broker, then compare it with NAS100 or GER40 on another, and the first problem shows up fast. The point value may look familiar, but the contract spec, quote currency, and how the broker rounds the move can all change the risk you carry.
A clean calculator for indices must ask a trader one blunt question first, is this US30 CFD priced at $1 per point or $0.01 per pip? That single difference changes the whole risk math. The same issue shows up on NAS100 and GER40, where one broker may quote a tight point value in the account currency while another leaves the conversion step buried in the fine print.
Three things you need before any calculation
Every index trade starts with the same three checks:
- Contract size, how much one CFD or one lot controls.
- Tick size, the smallest price increment your broker uses.
- Quote currency, the currency the broker uses for that product's P&L.
If any one of those is wrong, the final number is wrong too. That is how a trader thinks they have a safe stop, then finds out the account loss is larger once the position is marked back into the account currency.
The label “indices” also creates noise. It gets used for market indices, but it appears in other fields too, so search results often throw up pages that have nothing to do with trading. A trader needs the spec sheet for the exact instrument, not a generic formula that ignores how the broker defines the move.
Practical rule: never trust a generic index calculator until you have matched it to the exact broker spec sheet.
The historical side helps only if it is used properly. The point is not the dates themselves, it is that index levels only mean something when they are compared against a base and read in context, the same way a desk compares today's price to the entry, not to some raw number floating in isolation. That is the useful part of the comparison logic, whether you are looking at a long-running benchmark or a live CFD ticket. STATISTICS AUSTRIA index calculator
For a trader, the clean check is simple. Before you size the order, confirm what one point is worth, what currency that value sits in, and how the broker defines the tick on that exact product. If those three line up, the rest of the calculation is just arithmetic.
The Base Index Formula Every Calculator Relies On
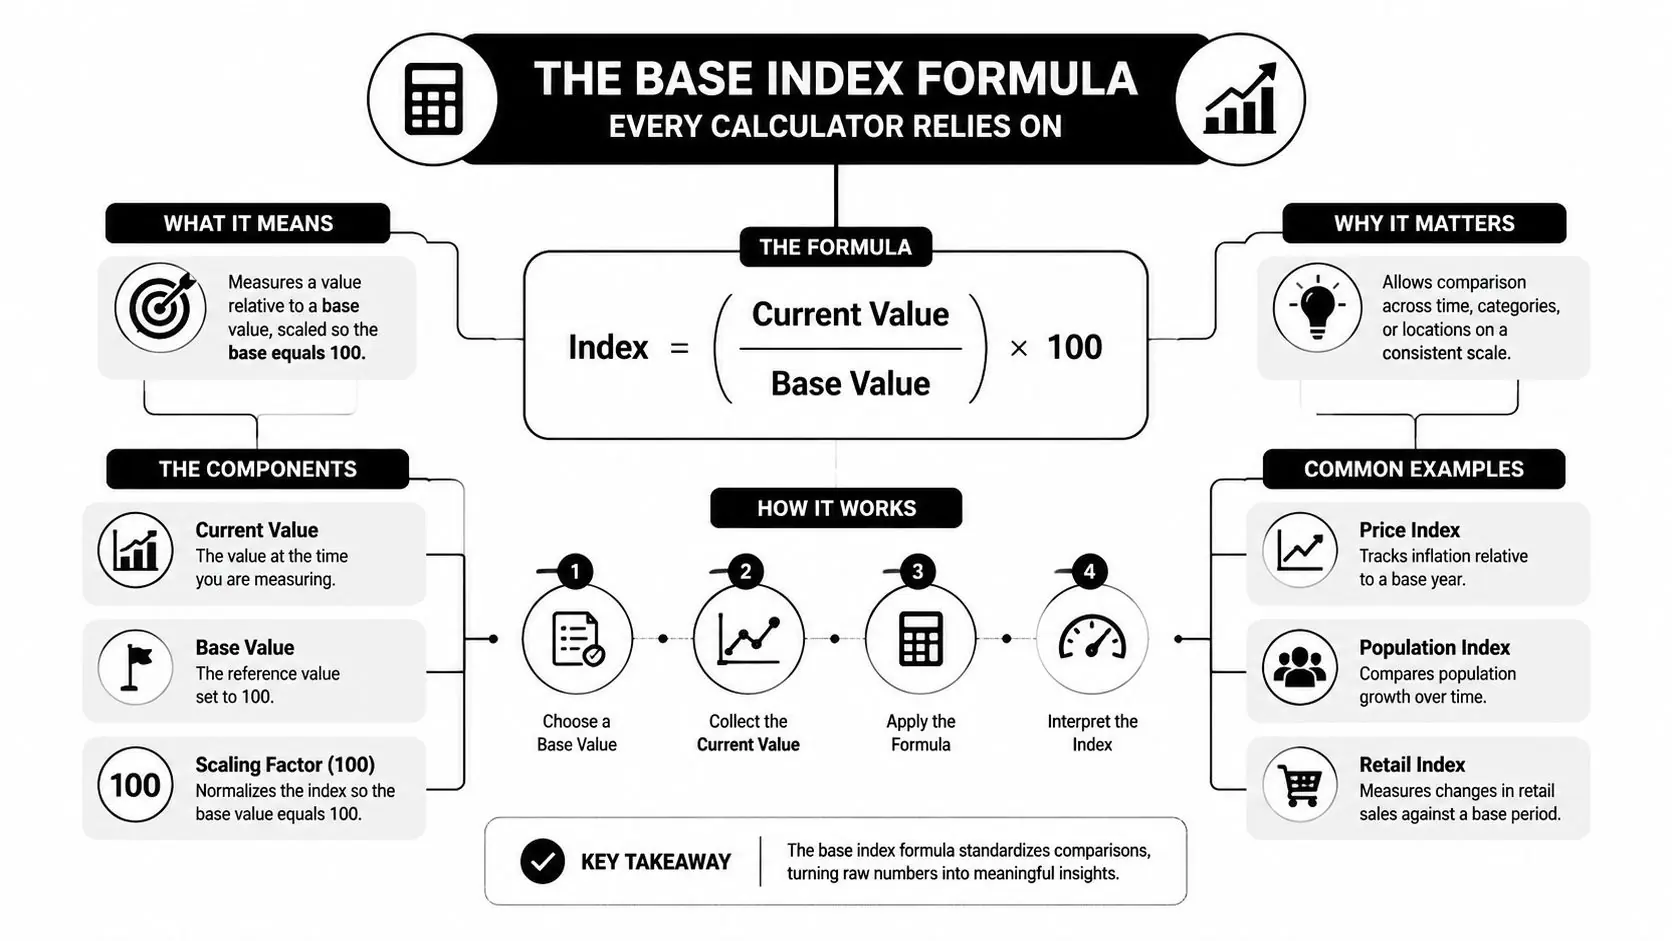
The classic index-number formula is (current value ÷ base value) × 100. That's the standard statistical convention, and it makes the base period equal to 100, so you can compare changes as percentages instead of raw units. In one educational example, a move from 250 to 375 becomes an index of 150, which means a 50% increase relative to the base period.
What that means on a trading desk
That statistical formula isn't the same as a CFD ticket, but the logic is identical. On a price chart, you're still comparing a current value to a prior value, then translating the change into a standardized move. The difference is that traders think in points, ticks, and contract value, not in an abstract base period of 100.
Take the DJIA as a plain example. If it closes at 53,791.85 and then rises to 54,500, the move is roughly 1.32%. That's the same comparison logic the index formula uses, just applied to a live market level rather than a statistical base period. Historical index data for DJIA, S&P 500, and NASDAQ
A trader's calculation needs four inputs:
- Start value
- End value
- Unit size, meaning the point or tick increment
- Currency context, because the P&L may not be in your account currency
The formula is only half the job. The broker spec tells you what one unit is actually worth.
That's why a calculator for indices built for traders has to behave differently from a classroom index formula. It can't stop at percentage change. It has to tell you what the move means in real money, on your account, with your broker's conventions.
Pip and Point Value for Major Indices
The cleanest way to read an index contract is to stop using the word “pip” loosely and look at the broker's spec sheet. Some brokers call 0.01 of an index level a pip, others call 1 full point a pip, and that naming choice is where a lot of beginner calculators break. The number matters less than the contract definition underneath it.
Reading the spec sheet without guessing
For index CFDs, the useful working formula is:
Point value = contract size × tick size × quote currency rate
That's the one line you keep in your head while checking the platform ticket. If the quote currency matches your account currency, the final conversion step disappears. If it doesn't, you need to convert before you trust the result.
| Typical Index CFD Contract Specs | |||
|---|---|---|---|
| Index | Tick Size | Point Value per CFD | Quote Currency |
| US30 | 0.01 | $1 per point per CFD | USD |
| NAS100 | 0.01 | $1 per point per CFD | USD |
| GER40 | 0.01 | €1 per point per CFD | EUR |
For a US30 CFD quoted at $1 per point per CFD, one point of movement changes P&L by $1 per CFD. If you trade 5 CFDs, that becomes $5 per point. The same logic applies to NAS100 when the broker uses the same point value structure, although that is broker-dependent and you should verify it on your own ticket. NAS100 tick value discussion
GER40 is the cleanest reminder that currency matters. If the contract is priced in euros, then the point value is still measured in euro terms even if your account is in dollars or pounds. That's why a calculator that ignores quote currency gives you a number that looks precise but isn't operationally useful.
A quick habit saves time: check the contract size column first, then verify whether the broker quotes point value per CFD or per lot. Those two details tell you whether the number on the screen is directly tradable or just a headline figure.
Position Sizing From a Risk Budget
Risk-based sizing is where the calculator becomes useful on an actual ticket. The core formula is:
Position size (CFDs) = Account risk ÷ (stop distance in points × point value)
That formula stays stable even when the index itself changes. What changes is the point value, the stop distance, and the account currency.
A straight US30 example
Say a funded account has $50,000 and the trader risks 1%, which is $500. If the US30 stop is 150 points and the broker values the contract at $1 per point per CFD, the position size is:
$500 ÷ (150 × $1) = 3.33 CFDs
That means the practical trade size is about 3 CFDs if the desk rounds down for safety, or 3.33 if the platform allows fractional sizing. The point is not to chase the exact decimal. The point is to stay inside the risk budget.
Rule of thumb: if the platform won't let you size cleanly, round down. Risk control beats precision theater.
Adding the account currency layer
Now shift the account to EUR while the US30 quote still settles in USD. The math still starts with the dollar risk, but the final contract exposure has to be judged in the account's currency. That means the trading desk has to convert the dollar-denominated risk budget by the prevailing EURUSD rate before treating it as account equity in euros.
That extra layer matters because the same trade can look safe in USD and oversized in EUR if the conversion step is skipped. A calculator for indices that assumes every account is in USD omits that problem, which is why generic tools often miss the correct answer.
Before every trade, run this checklist:
- Risk %, confirm the account fraction you're willing to lose.
- Stop distance, measure it in points, not in feelings.
- Point value, verify per CFD or per lot.
- Account currency, convert if the quote currency differs.
If you want a fast way to cross-check your lot math, keep a separate sizing sheet beside your ticket and compare it with a dedicated lot size calculator. A trader who does that catches bad assumptions before they become bad fills.
Margin Requirements and How Brokers Quote Them
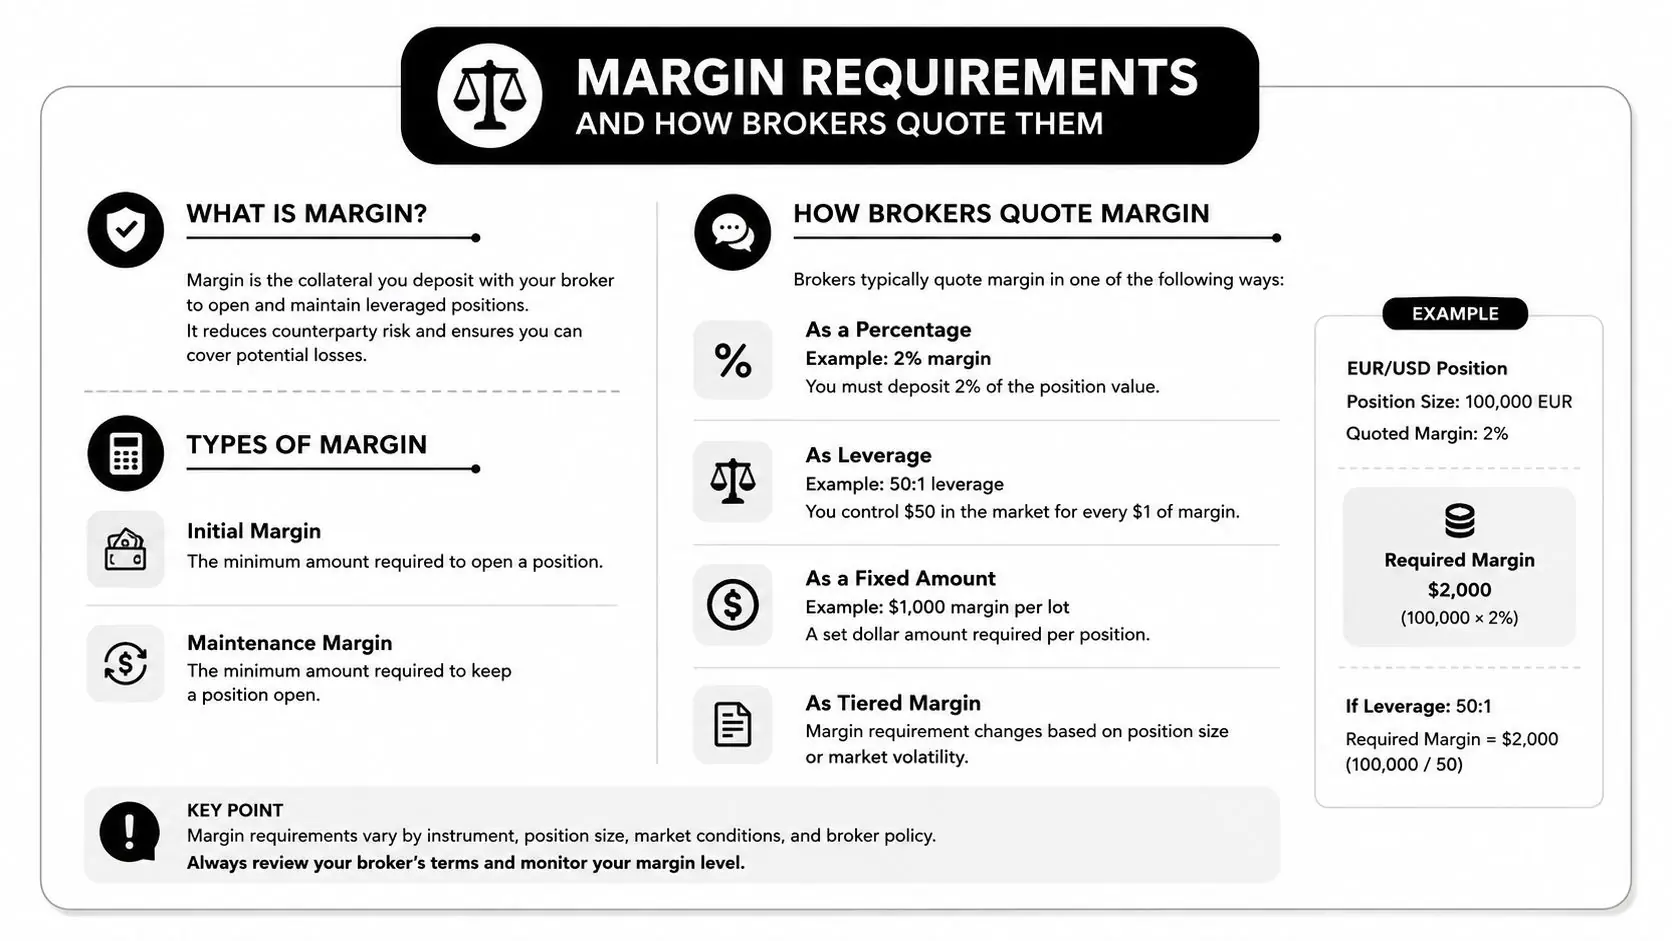
Margin is not the same thing as risk. Margin is what the broker locks up to open the trade, while risk is what you can lose if the stop gets hit. Traders mix those up all the time, then act surprised when a position fits the margin requirement but still blows through the day's loss limit.
Notional margin versus dynamic margin
A notional margin model uses a fixed percentage of contract value. A dynamic or tiered model changes with volatility, product conditions, or platform rules. Both are common, and both can change the amount of cash that gets reserved when you open the order.
The trading math is straightforward:
Margin = contract value × margin rate
Using the earlier US30 level of 53,791.85, a 1-lot position at 0.5% margin comes out to roughly $269. At 5% margin, the same 1-lot position jumps to roughly $2,690. That difference is why two brokers can show the same trade as “affordable” on one platform and tight on another. The contract is the same, but the margin policy isn't.
What margin does not protect you from
Prop-style accounts add another layer on top of broker margin, including a 5% daily loss limit and up to 10% maximum drawdown. That means margin headroom is not a safety net. A trade can still violate the account rules even if the broker hasn't forced a stop-out.
Keep used margin under 30% of equity on a single position if you want breathing room during intraday volatility. That's not a magic number, it's a practical buffer that helps reduce the chance of a normal wiggle turning into a forced exit.
The safest habit is to separate the two questions in your head. First ask whether the broker will allow the trade. Then ask whether your risk rule will allow the trade. Those are not the same answer.
Tracking P&L From Entry to Exit
Profit and loss gets easier once you stop thinking in abstraction and write the trade out line by line. A US30 position is a clean example because the point value is simple, the arithmetic is visible, and the currency conversion step is easy to inspect if the account isn't in dollars.
A full US30 walkthrough
Enter long at 53,791.85 with 5 CFDs at $1 per point. Exit at 54,200. The move is:
54,200 – 53,791.85 = 408.15 points
Now multiply:
408.15 × 5 × $1 = $2,040.75
That's the gross P&L before any spread, swap, or platform-specific adjustment. If the account is in USD, the number is already in account currency. If the account is in EUR, convert the dollar result using the prevailing EURUSD rate before you treat it as realized account profit. Profit and loss calculation reference
Why the platform can still disagree
Three things can make the platform's P&L column differ from your notebook:
- Swaps, which can charge or credit the position overnight.
- Widening spreads, especially when liquidity thins around rollover or session changes.
- Corporate actions on cash indices, which can create gaps that don't look like a normal intraday move.
Those issues don't make the manual math wrong. They just mean the ticket has extra line items the screenshot may not show cleanly.
If your handwritten P&L and the platform disagree, check charges first, then spread, then the exact entry and exit timestamps.
A serious calculator for indices pays for itself. It lets you separate pure price movement from broker adjustments, so you can tell whether the trade worked or the ledger added another layer.
Turning the Formulas Into a Reusable Spreadsheet
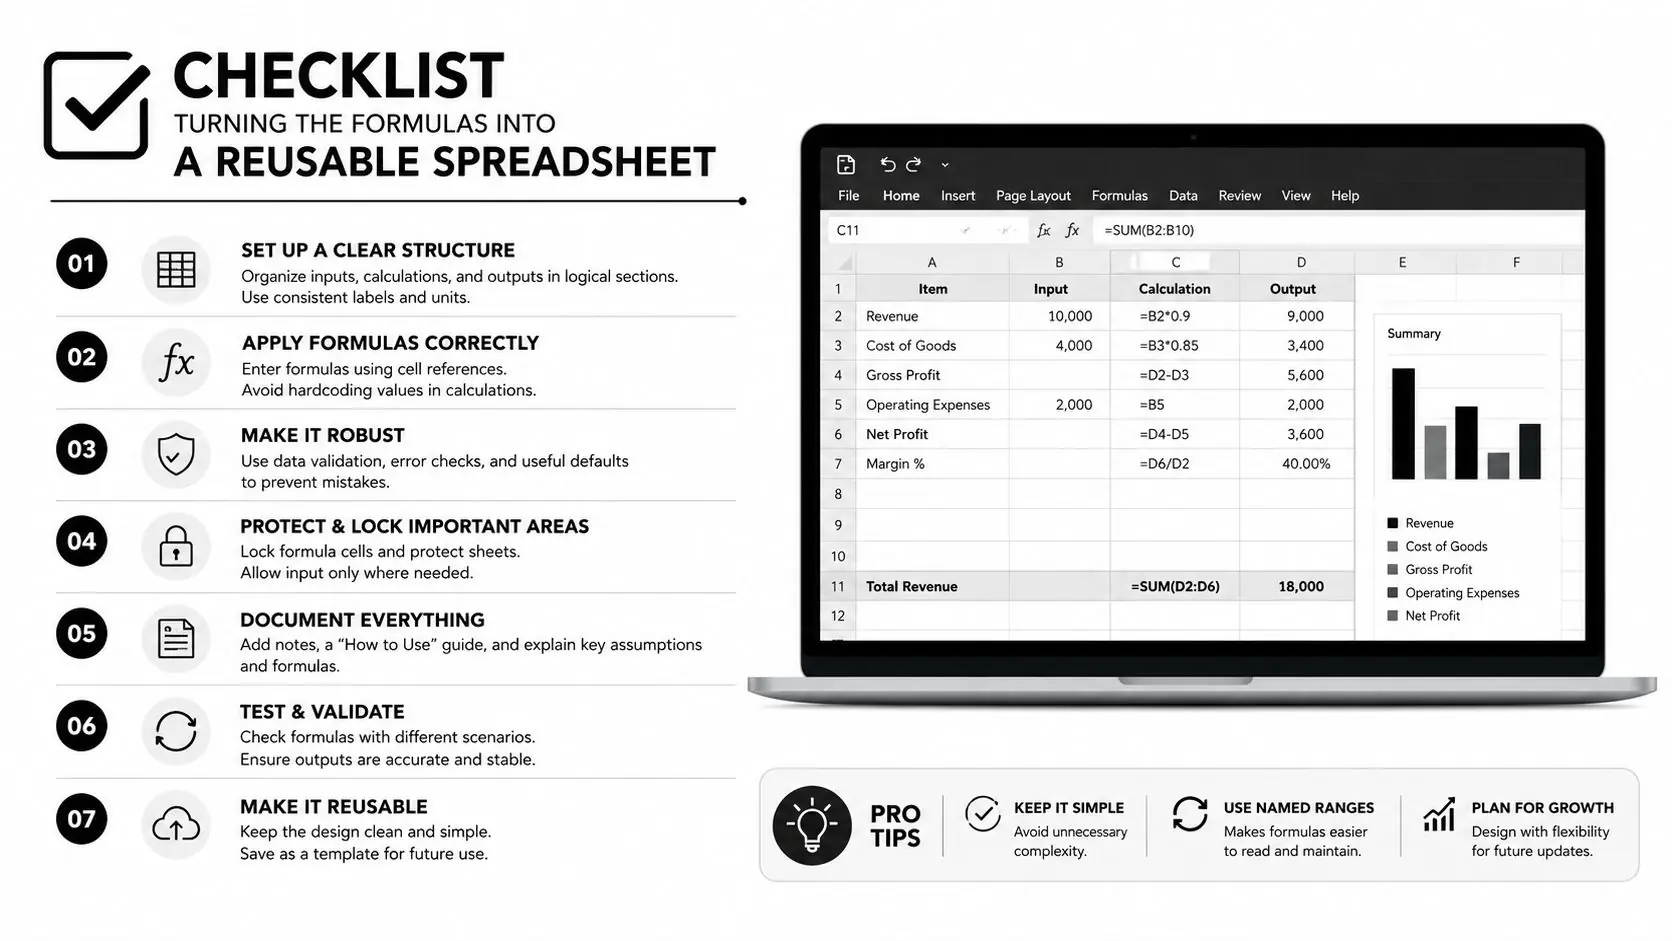
A spreadsheet is still the fastest way to make this repeatable. Keep it simple, name the inputs clearly, and let the formulas do the boring part. You don't need a fancy dashboard, you need a sheet that survives a tired evening session.
A clean layout that actually works
Use these input cells:
- Account size
- Risk %
- Stop distance
- Point value
- FX rate
Then wire the formulas like this:
- Account risk = Account size × Risk %
- Position size = Account risk ÷ (Stop distance × Point value)
- Converted P&L = Gross P&L ÷ or × FX rate, depending on the quote currency and account currency pair direction
The goal is to change one input and have every downstream number refresh instantly. If you alter the stop from 150 points to 120, the position size should update on its own. If the broker re-lists the contract or rolls specifications, your template should still work after a quick edit.
If you're comparing calculator approaches, the Monsa versus spreadsheet analysis is a useful read for deciding when a dedicated tool helps and when a plain sheet is enough. For index trading, I'd still keep the spreadsheet as the source of truth, then test it against the broker ticket and one closed trade before trusting it live.
Print one known example, compare it with the broker's order ticket, then reverse-engineer a closed trade. Save a separate version for US30, NAS100, and GER40, because contract specs can change when a broker relists or rolls a product.
MyFundedCapital offers US100, US500 and US30 on its funded accounts, priced from US ETFs and traded intraday only; if you want to trade them with tighter rule discipline, visit MyFundedCapital and compare the funding paths, account types, and risk limits before you place your next ticket. Their challenge and instant funding options are built for traders who already understand sizing, drawdown, and margin, which makes this a sensible next step if you're ready to apply the math in a prop environment.