A lot of traders first notice divergence the hard way. Price keeps pushing, you trust the trend, then momentum fades, the move stalls, and the reversal takes back a good trade or pushes you into an unnecessary loss.
Trading with divergence helps you read that loss of momentum earlier. Used properly, it can improve timing, filter weak setups, and fit the discipline required to trade inside prop firm rules. This content is educational only, not financial advice, and all trading involves risk of loss.
Free resources: Best Indicators for Prop Traders (the five indicators funded traders use most, with settings).
Why Trading With Divergence Is a Crucial Skill for Modern Traders
You are long EUR/USD after a breakout. Price ticks into a fresh high, but the oscillator rolls over instead of confirming. If you ignore that mismatch and add size anyway, one trade can do more than dent P&L. In a prop evaluation, it can push you closer to the daily loss cap and force defensive trading for the rest of the session.
That is why divergence deserves a place in a modern trader's playbook. It helps spot momentum fatigue before the reversal is obvious to everyone else, which matters most in markets where late entries and poor location get punished fast.
What divergence tells you
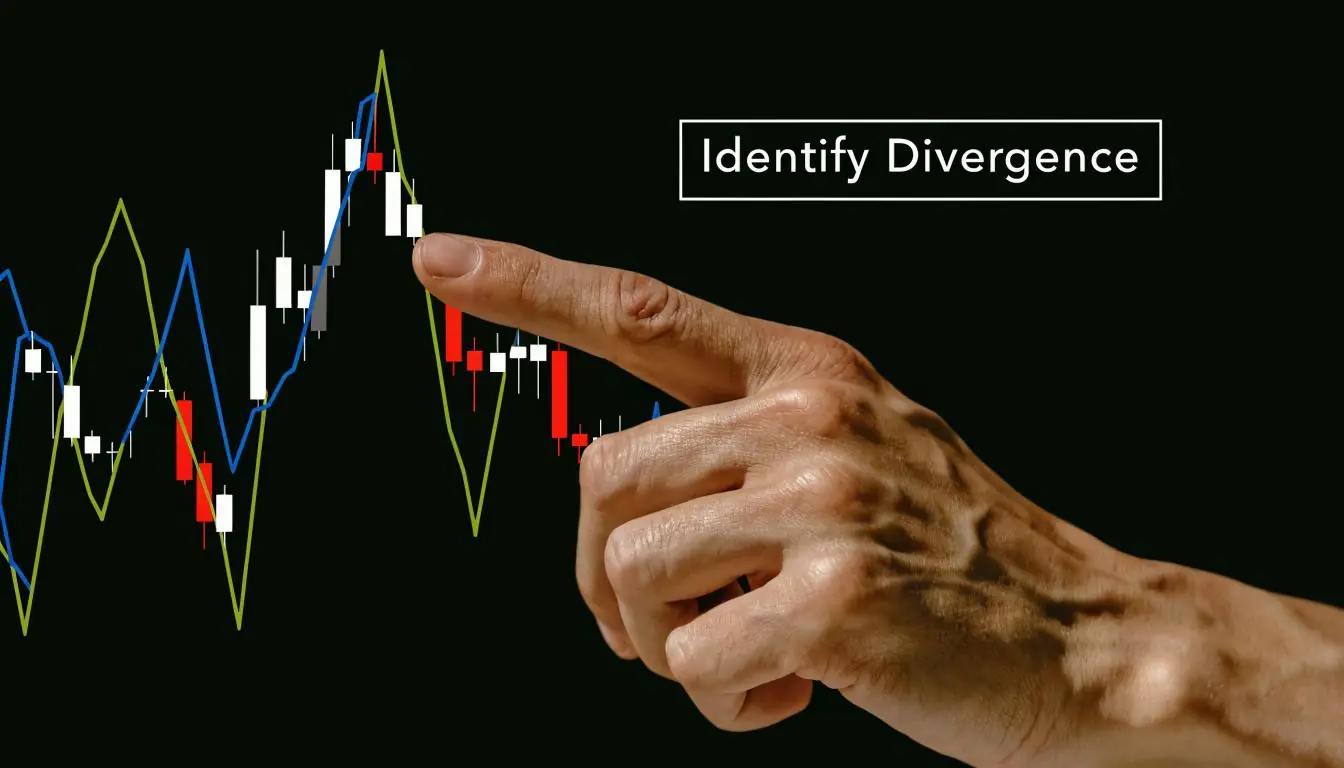
Divergence is a disagreement between price action and momentum. Price stretches to a new swing point, but the indicator fails to confirm the push. Traders usually track it with RSI, MACD, Stochastic, or CCI.
The message is simple, but the application takes discipline.
- Price makes a new high and the indicator does not. Upside momentum may be weakening.
- Price makes a new low and the indicator does not. Downside pressure may be losing force.
- The signal needs context. Structure, liquidity, session timing, and invalidation still decide whether the trade is worth taking.
I learned this the expensive way during challenge accounts. Divergence found good locations, but only when I treated it as an alert to tighten my read, not as permission to hit market order at the first mismatch on the chart.
Practical rule: Divergence is a warning label, not an entry trigger.
Why prop traders pay attention to it
Divergence works well in prop firm conditions because it slows traders down. That matters under rules like a 5% daily drawdown and 10% maximum drawdown, where one revenge trade or one oversized fade can ruin a strong week.
A trader in a personal account can survive a sloppy chase and reset tomorrow. A trader trying to pass a funded challenge has less room for that kind of mistake. The setup has to offer clean structure, defined risk, and enough upside to justify the attempt.
Used properly, divergence helps with that process:
- It filters bad breakout entries when momentum is fading into resistance or support.
- It improves trade location by focusing attention on stretched moves near obvious swing points.
- It supports tighter invalidation around recent highs, lows, or structure levels.
- It fits continuation trading when hidden divergence appears during a pullback in trend.
- It protects drawdown by reducing the number of impulsive trades taken in the middle of nowhere.
The edge is not the indicator by itself. The edge comes from combining momentum disagreement with market structure, then sizing the trade small enough that a failed read stays routine. That approach is what keeps divergence useful in a prop setting, including firms such as MyFundedCapital, where staying inside the rules matters as much as finding the setup.
Decoding Divergence Types Regular vs Hidden
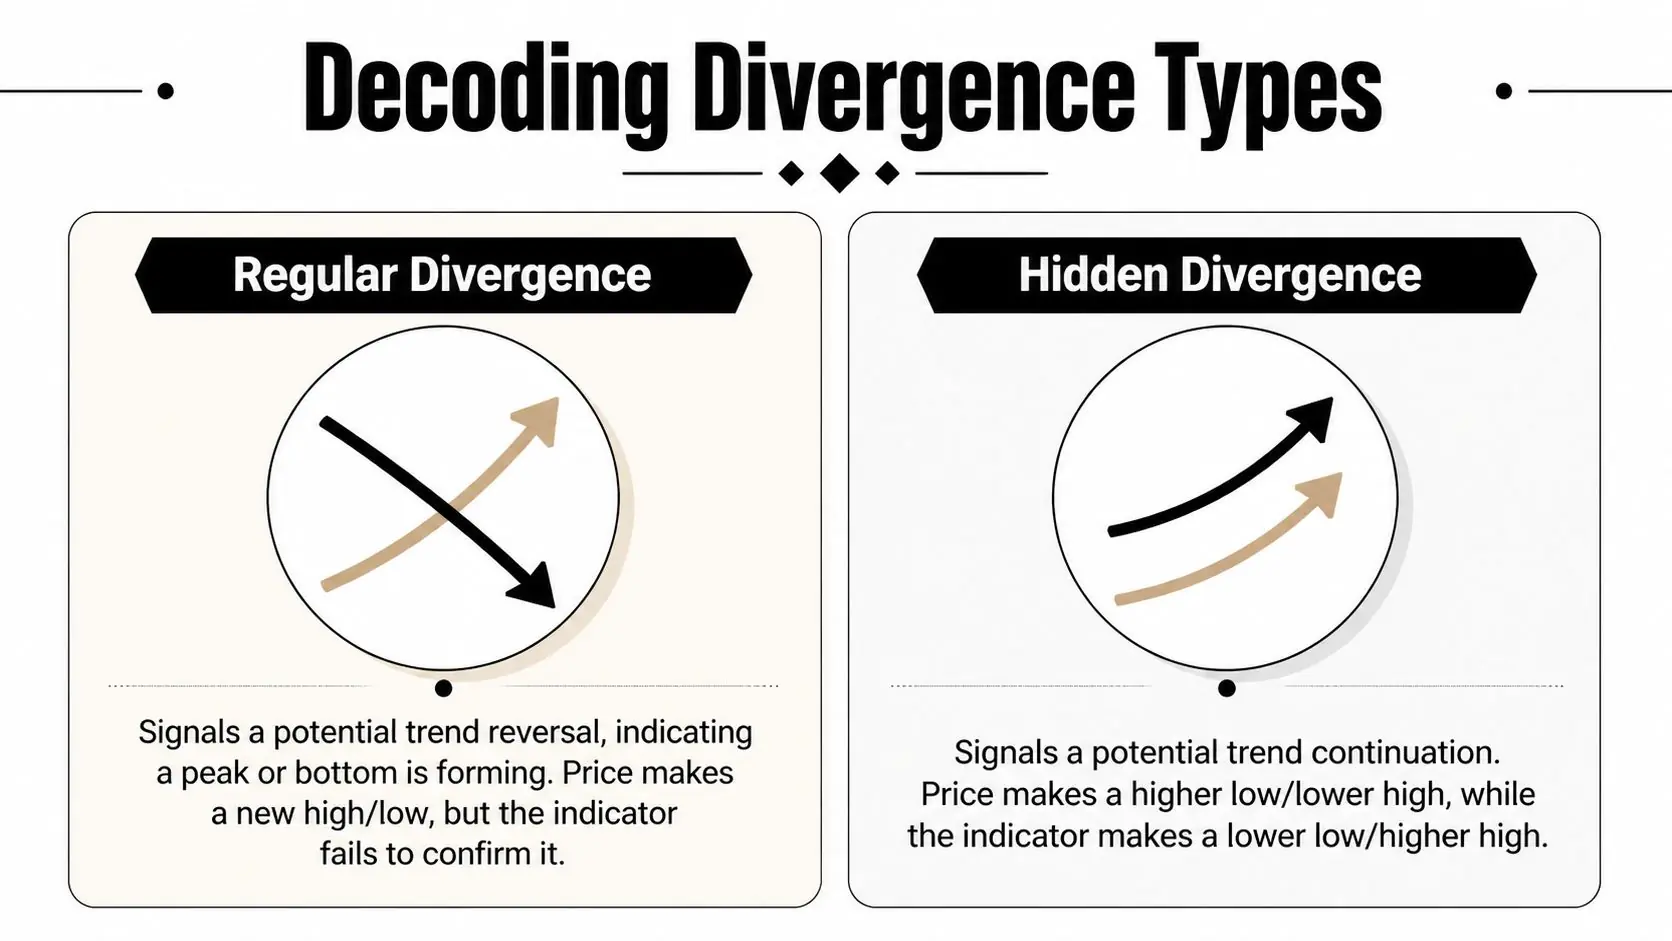
Most traders struggle with divergence because they mix up two very different ideas. Regular divergence is mainly about a possible reversal. Hidden divergence is mainly about continuation inside an existing trend.
That distinction changes everything. If you treat a continuation signal like a reversal signal, you'll short strong uptrends and buy weak downtrends at exactly the wrong time.
Regular divergence
Regular divergence appears when price extends but momentum doesn't confirm the extension. That's why traders use it as an early warning for reversal conditions.
According to Schwab's explanation of chart divergences and the identification process, bearish regular divergence happens when price makes higher highs while the indicator makes lower highs. Bullish regular divergence happens when price makes lower lows while the indicator makes higher lows.
A simple trading example:
- In an uptrend, EUR/USD pushes into a fresh swing high.
- RSI prints a lower high instead of confirming the move.
- Momentum isn't supporting price the way it was before.
- That doesn't mean short immediately. It means start watching for reversal structure.
Schwab also notes a Bitcoin example where price lows decrease while RSI rises. That's a regular bullish divergence, which can signal a possible reversal from bearish pressure.
Hidden divergence
Hidden divergence is different. It usually shows up during a pullback inside an existing trend and suggests the broader trend may continue.
The same Schwab guide explains that hidden divergence works as a trend continuation signal. It also points to the best timeframes for trading hidden divergence as the 1-hour, 4-hour, daily, and weekly charts.
This is the version many funded traders end up relying on more, because continuation entries often align better with cleaner structure than trying to pick tops and bottoms.
For example:
- BTC is in a solid uptrend.
- Price pulls back and forms a higher low.
- Your oscillator forms a lower low.
- Price holds trend structure even though momentum dipped harder during the pullback.
- That can support a continuation long once price confirms.
Regular vs Hidden Divergence At a Glance
| Characteristic | Regular Divergence | Hidden Divergence |
|---|---|---|
| Core message | Potential reversal | Potential continuation |
| Bullish pattern | Price lower low, indicator higher low | Price higher low, indicator lower low |
| Bearish pattern | Price higher high, indicator lower high | Price lower high, indicator higher high |
| Best market context | Sideways or ranging conditions | Established trends |
| Confirmation style | Reversal patterns such as double tops or double bottoms | Trendline holds, support/resistance reaction, continuation candlesticks |
| Trade mindset | Fade exhaustion carefully | Join pullback in trend direction |
The four-step identification method
When traders identify divergence properly, they usually follow a structured process rather than eyeballing random swings.
That process is:
- Confirm the trend by checking whether price is making higher highs or lower lows.
- Apply an oscillator such as RSI or MACD.
- Draw trendlines on price swings and on the indicator swings.
- Compare the slope and alignment between price and indicator.
If the trendlines disagree, pay attention. If price structure confirms it, then you may have a trade.
The biggest mistake here is forcing patterns that aren't clean. If the swing points are messy, the divergence usually is too.
Essential Indicator Setups for Identifying Divergence
A trader trying to pass a prop firm challenge does not need six oscillators and three confirmation scripts. A clean chart, one momentum tool, and clear swing points are enough.
That matters more under firm rules than many traders admit. If the account has a 5% daily drawdown limit and a 10% max drawdown limit, clutter is expensive. Extra indicators do not improve read quality. They usually delay decisions, justify late entries, and push traders into low-quality setups.
RSI for clean visual divergence
RSI is the best place to start because the signal is easy to see and hard to overcomplicate. The standard 14-period setting is enough for most markets and timeframes. It gives a stable momentum read without becoming too reactive.
The basic read is straightforward:
- Bearish divergence price prints a higher high, RSI prints a lower high
- Bullish divergence price prints a lower low, RSI prints a higher low
- Extra context overbought and oversold zones matter, but they do not trigger the trade on their own
I use RSI most often when the structure is clean and the market is approaching a level that already matters. If price is pushing into prior session high, weekly resistance, or a range extreme, RSI divergence helps separate exhaustion from a normal breakout attempt. In a funding challenge, that distinction matters because fading every extended move is a fast way to hit drawdown.
For traders who want a sharper read on momentum shifts, this MACD reading guide from MyFundedCapital is useful for understanding how divergence fits with trend structure.
MACD for momentum progression
MACD is better for traders who care more about swing strength than bounded overbought or oversold readings. It shows whether each push is gaining or losing force, which makes it useful in trends and on higher timeframes.
There are two practical ways to use it. Some traders compare the MACD line at each swing. Others compare histogram peaks and troughs. Both can work. The mistake is switching methods every week.
MACD tends to perform best when:
- The market is already trending
- The swings are wide enough to show real momentum expansion or contraction
- You want to avoid the noise that faster oscillators can create on intraday charts
If price keeps grinding higher but MACD peaks are flattening, momentum is fading even if price has not turned yet. That does not mean short immediately. It means the move deserves tighter selection and cleaner confirmation.
Stochastic for pullbacks and fast markets
Stochastic is more sensitive than RSI. That is useful on lower timeframes, especially when a trend pulls back in stages and you want a quicker momentum read. It is also why many traders misuse it.
In choppy conditions, Stochastic throws off a lot of weak signals. On a prop account, weak signals cost more than they seem to. A few small, impatient entries can do enough damage to ruin the rest of the session.
The best use is specific. Price is trending cleanly, pulls into support or resistance, and Stochastic diverges during that pullback. If price then resumes in the trend direction, the setup often gives a tighter invalidation point than chasing the breakout after the move has already expanded.
CCI as a secondary tool, not a primary decision-maker
CCI can spot momentum shifts well, but it is less intuitive for many traders. I would not use it as the first indicator for learning divergence. It works better as a second opinion when RSI or MACD has already highlighted a setup.
That is the trade-off. CCI can help in volatile instruments, but if you do not read it fluently, it slows execution. Under challenge conditions, slow execution usually means worse entries and wider stops.
A chart layout that holds up under prop firm rules
The setup that works best for most traders is simple:
- Main panel candlestick chart with obvious swing highs and lows marked
- Primary indicator RSI or MACD
- Context layer support and resistance, trendline, or a key moving average
- Optional filter Stochastic or CCI only if it makes the read clearer
This is the standard I keep. If two indicators disagree and price structure is mediocre, I pass. If the divergence only becomes visible after zooming in, redrawing swings, and arguing with the chart, I pass.
Good divergence setups are obvious enough to spot quickly and strict enough to survive risk limits. That is the standard that helps traders stay consistent long enough to get funded.
A Step-by-Step Framework for Entering and Exiting Trades
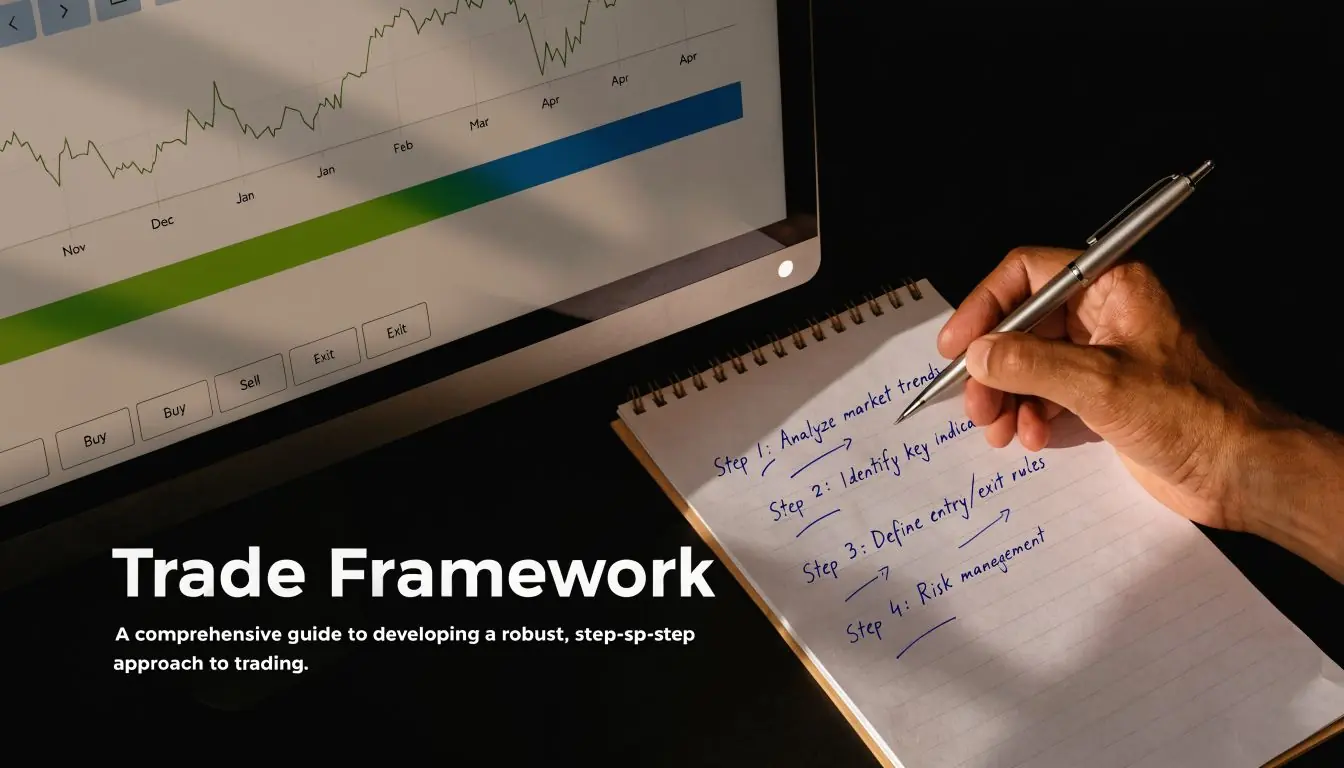
Most divergence losses come from one bad habit. Traders see the signal and enter before price confirms anything.
That's backwards. Divergence should put a setup on your watchlist. Price action should decide whether you take the trade.
Step one, mark the divergence and leave it alone
When you spot a clean divergence, don't rush. Label it correctly first.
Ask:
- Is it regular or hidden
- Is the market trending or ranging
- Is the signal appearing into meaningful structure
- Is the swing obvious, or am I forcing it
This first pause saves a lot of bad trades. The market often prints divergence long before it gives a tradable confirmation.
Step two, wait for a secondary trigger
Professional traders treat divergence as a caution signal, not a trade trigger, and require confirmation such as a support or resistance break, according to QuantInsti's divergence trading framework.
That confirmation can come from:
- A support break after bearish divergence
- A resistance break after bullish divergence
- A reversal candlestick pattern
- A trendline break
- A rejection from a known level
If bearish divergence forms but support never breaks, the short setup isn't ready. If bullish divergence forms but price still can't reclaim a level, the long may still be premature.
Step three, define the invalidation point first
Before you think about profit, decide where the idea is wrong.
For bearish divergence, a common placement is above the swing high of the divergence pattern. For bullish divergence, it's often below the swing low. That aligns the stop with market structure instead of placing it at a random distance.
I learned this the hard way in challenge trading. Tight stops placed for psychological comfort get clipped. Wide stops placed without structure create poor position sizing and unnecessary drawdown pressure.
A good stop should answer one question: what price action would prove this setup failed?
Step four, build the trade around risk-reward
QuantInsti notes that a 1:2 risk-reward ratio with a 60% win rate outperforms higher win rates at 1:1. That matters because divergence won't win every time, and it doesn't need to.
Use structure for targets:
- Nearest opposing support or resistance
- Previous swing point
- Measured move into the next reaction zone
If the chart doesn't offer enough room for a sensible target, the setup may be valid but the trade still isn't attractive.
For traders sharpening reversal timing, this RSI trading strategy guide is useful when paired with divergence confirmation rules.
A practical execution checklist
Before entering, run through this list:
- Signal quality: Is the divergence clear on both price and indicator?
- Market context: Is regular divergence showing in a range, or hidden divergence showing in a trend?
- Location: Is the setup forming at support, resistance, or another important structure?
- Confirmation: Has price broken or reclaimed something important?
- Stop logic: Is the invalidation tied to the swing high or swing low?
- Reward potential: Can the chart realistically offer at least a favorable target relative to risk?
- Rule fit: Does the position size respect your account limits?
A divergence setup without confirmation is analysis. A divergence setup with confirmation, structure, and defined risk is a trade plan.
Managing Divergence Trades Within Prop Firm Rules
Divergence trading makes more sense inside prop rules than a lot of traders realize. The method naturally pushes you toward selectivity, and selectivity is one of the few habits that protects both your account and your psychology.
That matters when you're trading under hard constraints such as a 5% daily loss limit and 10% maximum drawdown, which are common parameters in the prop space and central to evaluation survival.

Why filtering matters more than frequency
A generic trading guide may show divergence as if every signal deserves a trade. That's exactly how traders violate risk rules.
One quantitative example makes the point. Indicator Vault's divergence backtesting discussion states that regular bullish divergence on H4 forex charts from 2023 to 2026 yielded a 42% win rate at 1:2 risk-reward when filtered by support and resistance zones. The same data point is useful because it highlights a hard truth: divergence needs filtering.
If you trade every unfiltered signal, a normal losing streak can feel catastrophic inside a prop account. If you only trade the ones that line up with structure, the strategy becomes much more manageable.
Position sizing for challenge survival
The biggest shift in a prop environment is this: your first job isn't to maximize profit. It's to stay in the game.
That changes how you size divergence trades.
Use these rules:
- Size from the stop, not from conviction. A great-looking setup still needs small enough size that one loss doesn't damage the day.
- Account for clustered losses. Divergence can fail in streaks, especially in aggressive trends.
- Reduce size after low-quality market conditions. Choppy sessions and reactive news periods often make divergence less reliable.
- Avoid revenge entries. Two failed reversals in a row usually mean the market is stronger than your read.
Matching divergence style to prop conditions
Different divergence setups fit different challenge conditions.
| Setup type | Better use case in prop trading | Main risk |
|---|---|---|
| Regular divergence | Slower conditions near clear range edges | Entering before actual reversal confirmation |
| Hidden divergence | Pullbacks within established trends | Misreading a true reversal as continuation |
| Higher timeframe divergence | Cleaner decision-making and fewer forced trades | Wider stops if structure is broad |
| Lower timeframe divergence | Tactical intraday timing | More noise and more false positives |
One practical option for traders who want prop-friendly conditions for manual or system-based execution is MyFundedCapital, which publishes risk management education around controlling loss inside funded-style rules.
Protecting drawdown is part of the strategy, not a separate issue from the strategy.
When traders start treating risk limits as part of setup selection, divergence becomes more useful. They stop asking, "Can I catch this move?" and start asking, "Is this setup worth spending risk on?"
Common Pitfalls and How to Avoid Them
The usual mistake in trading with divergence isn't technical. It's behavioral. Traders want the signal to mean more than it does.
Divergence can be powerful. It can also be early, misleading, or completely irrelevant if the broader market context is wrong.
Mistake one, trading every divergence
Not every divergence deserves capital. In strong trends, price can keep extending long after momentum starts fading.
Traders get trapped trying to call tops and bottoms repeatedly. They see one bearish divergence, short too early, get stopped, then do it again because the indicator still "looks weak."
A better rule:
- Take regular divergence more seriously near range extremes or major structure
- Take hidden divergence more seriously when the trend is already established
- Ignore weak signals in the middle of nowhere
Mistake two, using one indicator as a verdict
A single oscillator isn't enough. Even the better divergence tools can produce false signals, especially when swings are unclear or volatility is erratic.
If your chart analysis sounds like this, the setup is weak:
- "RSI diverged, so I have to short"
- "MACD looks tired, so the uptrend must be over"
- "Stochastic turned, so the pullback is done"
That isn't a process. That's indicator dependency.
Red flags that usually mean pass
Use this quick filter before taking any divergence trade:
- Messy swing points if you can't clearly identify the two price pivots and the two indicator pivots, don't force it
- No structural level nearby divergence in open space is far less useful
- No price confirmation the indicator can't replace a break, reclaim, or rejection
- Strong impulse candles against your idea fading obvious strength is expensive
- Crowded indicator stack if your tools conflict, your read probably isn't clean
The cleanest divergence trades often feel a little boring. The bad ones usually come with a strong urge to act fast.
Mistake three, forgetting the account model
Self-funded traders can sometimes absorb a sloppy week. Challenge traders often can't.
That means the actual danger isn't just being wrong once. It's compounding errors through overtrading, oversized positions, and forced recovery trades after a failed divergence.
The traders who last tend to do three things well:
- They skip more setups than they take
- They treat confirmation as mandatory
- They accept that missing a move is cheaper than violating risk
If you keep those three habits, divergence becomes a decision filter. Without them, it becomes an excuse to trade too often.
Divergence Trading FAQ and Advanced Concepts
A lot of traders ask the same questions once they understand the basic patterns. That's where divergence starts becoming a real method instead of a chart trick.
How reliable are divergence signals really
They're reliable enough to matter and unreliable enough to punish lazy execution.
That sounds blunt, but it's the truth. Divergence works best when it's aligned with market structure, the right market context, and a confirmation trigger. Used alone, it's too easy to take premature reversals or misread trend continuation.
A good mindset is to treat divergence as an alert to investigate, not proof that price must turn.
What timeframes work best for trading with divergence
For hidden divergence, the stronger practical windows are often the 1-hour, 4-hour, daily, and weekly charts, as noted earlier from Schwab's chart divergence guidance. In practice, many traders prefer higher timeframes because the swing structure is cleaner and the signal isn't buried under noise.
Short-term traders can still use divergence on lower timeframes, but they need stricter filtering. If you scalp every oscillator mismatch, you'll mostly trade noise.
Can you automate divergence trading on MT5 or cTrader
Yes, but automation doesn't solve the hard part by itself. The challenge isn't just spotting divergence. The challenge is deciding which divergence is worth acting on.
A useful workflow is to let a scanner flag possible setups, then review:
- Trend context
- Nearby structure
- Session conditions
- Confirmation trigger
- Risk fit
For traders logging setups and testing patterns across pairs, a tool like Excel AI can help organize journals, summarize recurring conditions, and speed up review without turning the process into guesswork.
What about inter-market divergence
Here, things get more advanced and more interesting.
An underused angle is inter-market divergence, such as comparing one correlated market against another instead of only comparing price to an oscillator. According to this discussion of inter-market divergence examples, ES-NQ divergence has shown 65% accuracy in scalping trades during volatility, and pairing correlated assets such as EUR/USD and DXY can improve risk-reward by 52% when combined with volume confirmation and ATR-based stops.
That doesn't mean every correlated mismatch is tradable. It means correlated markets can add another layer of confirmation when you're trading multi-asset products.
Is divergence better for reversals or continuations
For many traders, the answer changes with experience.
Beginners often gravitate to regular divergence because reversal setups are easy to see. Experienced traders often become more selective and start favoring hidden divergence in established trends because continuation entries can be cleaner and less emotional.
Both can work. The key is matching the divergence type to the market condition instead of forcing your preferred setup onto every chart.
Trading with divergence gets better when you stop treating it like a secret signal and start treating it like a structured decision process. That's where consistency starts.
If you're ready to apply this approach inside clear evaluation rules, explore the funding options at MyFundedCapital. You can compare 1-Step and 2-Step Challenges or choose Instant Funding, then use divergence setups within defined risk parameters instead of trading by impulse.