A lot of traders reach for RSI because it looks simple. Then they short a strong rally because RSI is above 70, or they keep buying a falling market because RSI is below 30, and the account takes the hit.
A good rsi trading strategy is less about the indicator itself and more about context, trade selection, and risk control. Used properly, RSI can help you time pullbacks, confirm trend strength, and structure entries on platforms like cTrader and DXtrade without drifting into random decision-making. This article is educational only, not financial advice, and trading involves risk of loss.
Free resources: Best Indicators for Prop Traders (the five indicators funded traders use most, with settings).
Foundations of the RSI Trading Strategy
The Relative Strength Index, or RSI, has been around for a reason. J. Welles Wilder developed it in 1978, and the indicator still matters because it gives traders a quick read on momentum by measuring the speed and magnitude of price changes over a standard 14-period lookback using the formula RSI = 100 – (100 / (1 + RS)), where RS is average gain divided by average loss over the period, according to OANDA's explanation of the Relative Strength Index.
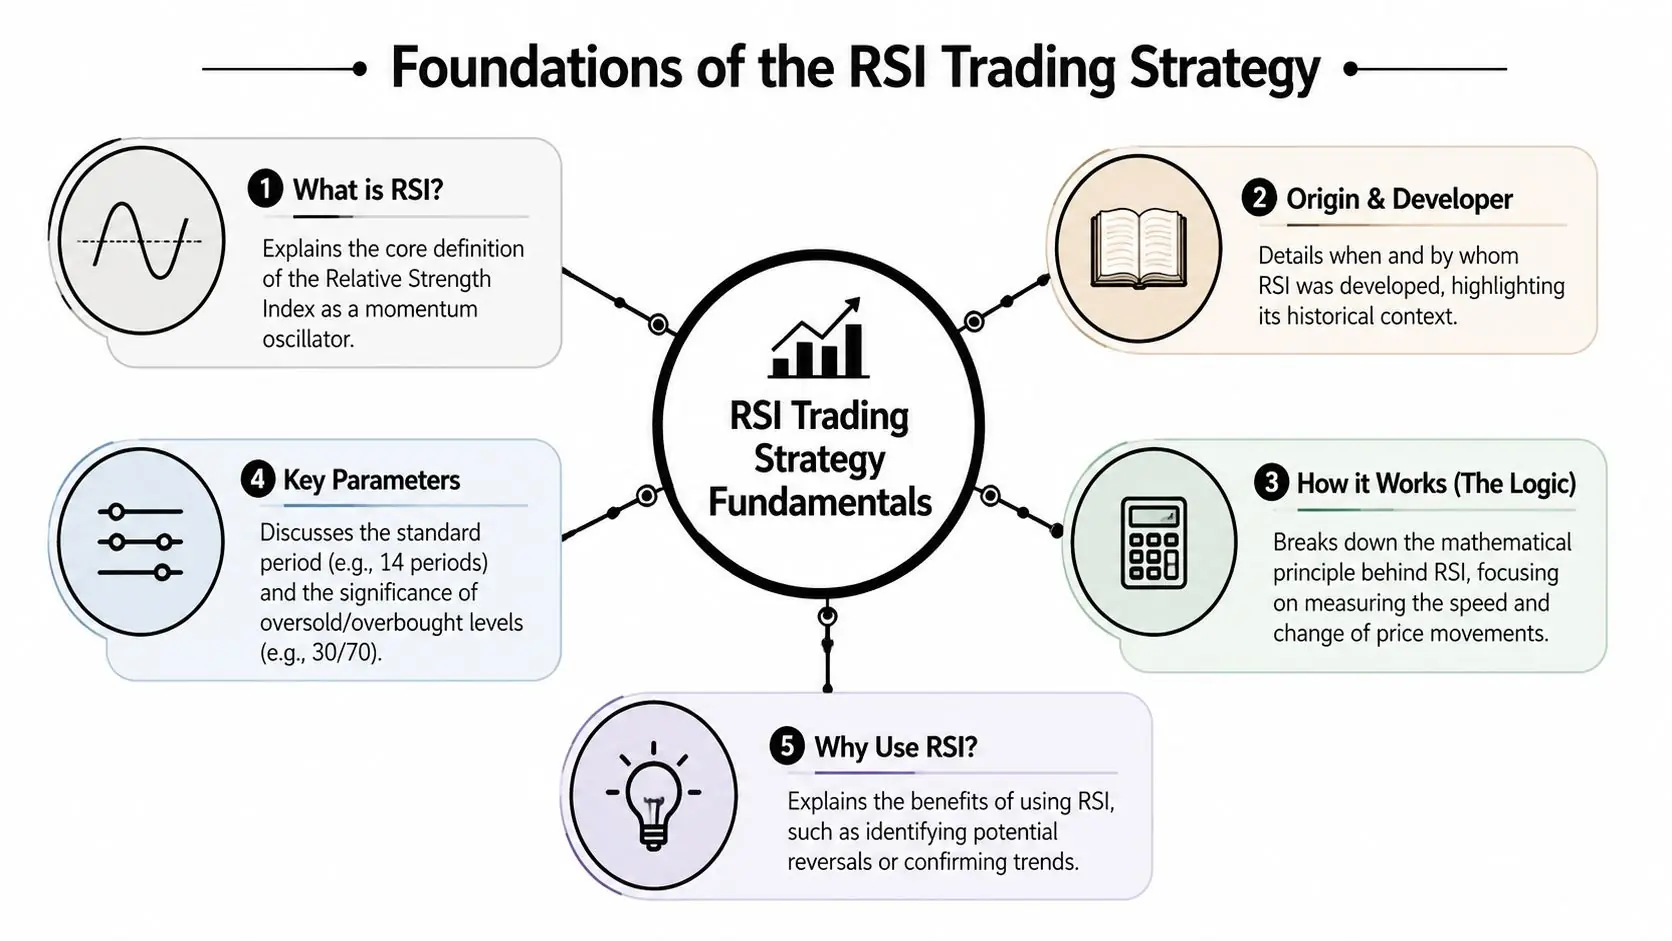
RSI moves between 0 and 100. Most traders learn the basic rule first: above 70 is considered overbought, below 30 is considered oversold. That rule is useful, but only if you stop treating it like a buy and sell button.
What RSI is actually telling you
RSI doesn't tell you price must reverse. It tells you momentum has stretched far enough that you should pay attention.
That distinction matters. In a calm, mean-reverting market, an extreme RSI reading can mark exhaustion. In a strong trend, that same reading can show strength. Price can stay pinned in an extreme zone longer than a trader can stay comfortable if the position is wrong.
Practical rule: Treat 70 and 30 as areas of interest, not automatic entries.
If you're still building your chart-reading foundation, this guide on forex technical analysis basics helps put RSI into the broader context of market structure, trend, and support or resistance.
The beginner mistakes that keep repeating
Most RSI losses come from a handful of habits:
- Fighting trend too early. Traders see RSI above 70 and short immediately, even while price keeps printing higher highs.
- Ignoring price structure. RSI says oversold, but price is still breaking support and closing weak.
- Using one setting for everything. A slower swing chart and a fast intraday chart don't behave the same.
- Forgetting the indicator is derivative. RSI comes from price. It doesn't replace reading the actual chart.
A trader who understands that last point already has an edge. RSI should support a decision, not make it for you.
The mindset that makes RSI useful
Use RSI for one of three jobs only:
- Spot stretched conditions where a pullback or bounce might form.
- Confirm momentum when trading with trend.
- Help time entries after price gives a cleaner trigger.
That keeps you out of the worst trap, which is treating every overbought or oversold reading as a reversal setup.
Strong trends can keep RSI extreme. The trader who survives is the one who waits for alignment between momentum, structure, and risk.
On cTrader and DXtrade, that usually means pairing RSI with clean chart work. Mark prior highs and lows. Note where price last reacted. Decide your invalidation before you enter. If RSI is extreme but the chart gives you no logical stop and no clean trigger, skip it.
A solid rsi trading strategy starts there. Not with settings. With restraint.
The Classic Mean Reversion RSI Strategy
Mean reversion is the setup most traders think of first with RSI. The idea is simple. Price pushes too far, momentum stretches, and the market snaps back enough to create a tradable move.
That can work well in the right conditions. It fails badly in strong directional markets.
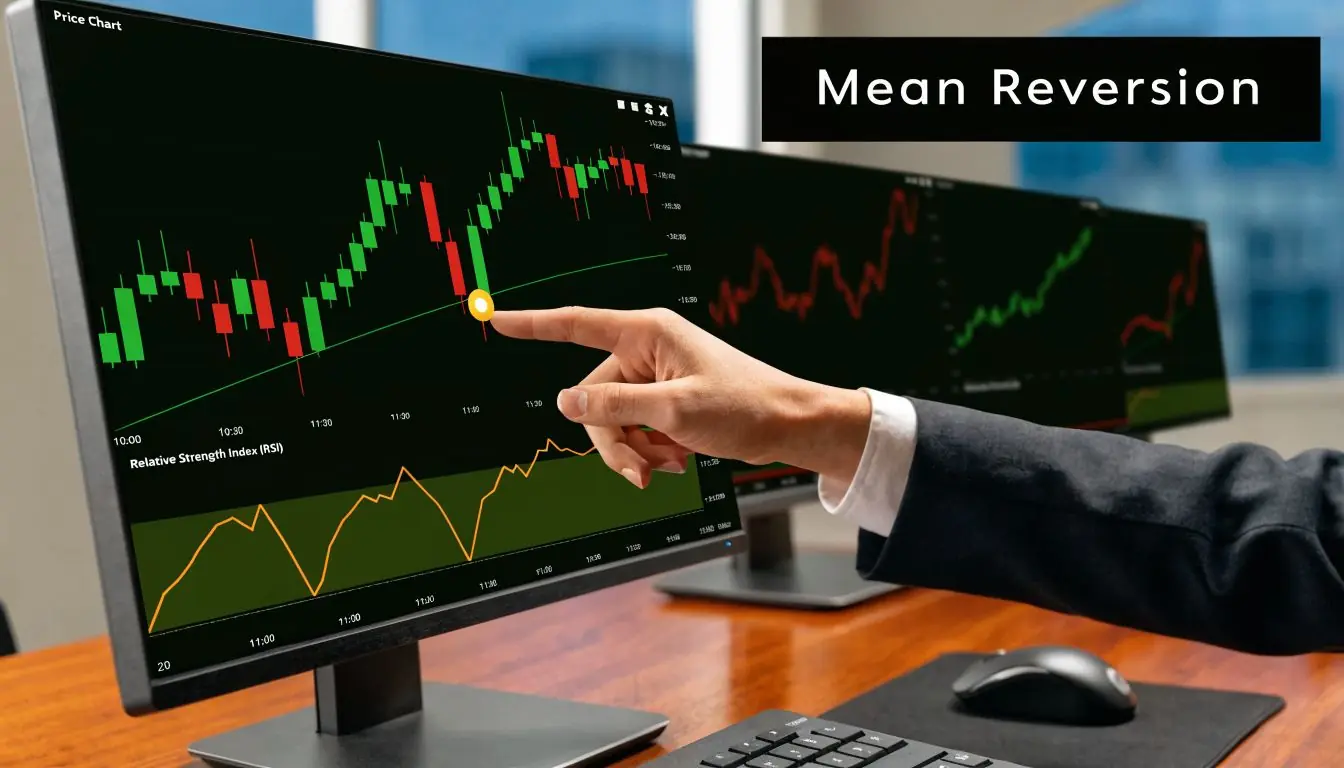
Backtesting gives a useful anchor here. Quantified Strategies' RSI testing notes that a 2 to 6 period RSI on daily charts for mean-reverting stocks achieved a 91% win rate, 0.82% average profit per trade, 42% market exposure, and 33% max drawdown, while longer 10-day RSI versions produced lower returns under similar exposure and drawdown conditions. That's a strong reminder that shorter RSI settings can work well in markets that naturally snap back.
When this strategy deserves your attention
Mean reversion works best when the market is stretched but not trending cleanly. You want a move that looks emotional, not a market that has just started a fresh directional leg.
Good conditions usually include:
- A range or mature move. Price has already traveled and starts looking extended.
- Known reaction zones. Support, resistance, or prior session levels are nearby.
- A quick RSI stretch. The move feels sharp rather than steady and orderly.
Bad conditions are just as important:
- Fresh breakouts with strong momentum
- Session opens with one-way order flow
- Markets trending cleanly after a major catalyst
A practical mean reversion playbook
For a long setup, the logic is straightforward. RSI drops below the oversold zone, price pushes into support, and then the market shows it can stop falling.
A practical sequence looks like this:
- Find the stretch. RSI moves below the lower extreme zone.
- Check location. Price is trading into an area where buyers have reacted before.
- Wait for re-entry or rejection. Don't buy the first touch blindly. Let RSI start recovering and let price stop printing weak closes.
- Enter only if the chart gives you a reason. A higher low, a rejection wick, or a break of a minor intraday structure is enough.
- Place the stop where the idea fails. Usually below the recent swing low for longs, or above the recent swing high for shorts.
- Take profit into normalization. Common management includes scaling out when momentum returns toward the middle of the range or at a preplanned reward target.
For shorts, invert the logic. RSI stretches high, price runs into resistance, and the market starts failing to hold the highs.
If you can't explain where the trade is wrong on the chart, you don't have a trade. You have a guess.
What works and what doesn't
What works:
- Shorter lookbacks in mean-reverting environments. That's where RSI gets more responsive.
- Waiting for price confirmation instead of entering just because RSI is extreme.
- Taking the first clean bounce instead of expecting a full reversal every time.
What doesn't:
- Catching knives in trend. Oversold can become more oversold.
- Averaging into losers because RSI looks "even cheaper."
- Using the same exit on every instrument. Some markets mean-revert quickly. Others bounce once and stall.
Here’s a simple operating checklist.
- Market type first. If the chart is trending hard, skip mean reversion.
- Entry second. Let RSI extreme and price reaction line up.
- Stop fixed before entry. Put it beyond the swing that invalidates the setup.
- Risk small enough to survive a streak. This matters even with a high historical win rate.
- One clean attempt. If the market doesn't bounce properly, get out and reassess.
Why prop traders need extra caution
Mean reversion feels attractive because entries often look precise. That's also why traders overtrade it. On a prop-style account with a firm daily loss rule, a string of forced reversals can do damage quickly.
The solution isn't avoiding the strategy. It's tightening the conditions:
- only take the setup near real chart levels
- avoid trading it against a very clear higher-timeframe push
- don't take multiple correlated reversal trades at once
- reduce size if volatility expands and your stop needs more room
A classic rsi trading strategy for mean reversion can be effective. But it only works when you stop trying to reverse every strong move you see.
Using RSI for Trend Following and Divergence
Most traders use RSI as a reversal tool first. Many do better when they flip that habit and use it to stay aligned with momentum.
A trend-following RSI approach is often safer because you're not trying to stand in front of a moving market. You're looking for momentum to confirm what price is already doing.
The 50 level matters more than most traders think
The centerline is one of the cleanest RSI filters. In practical terms, RSI above 50 supports a bullish momentum read, while RSI below 50 supports a bearish one. That doesn't mean every cross is tradable. It means you now have a simple way to separate pullback entries with trend from countertrend temptation.
When price is trending up and RSI keeps holding above the midpoint, pullbacks tend to be cleaner to buy than to fade. In a downtrend, the opposite applies.
A lot of traders find relief. They stop asking, "Is RSI overbought?" and start asking, "Is momentum still supporting the trend?"
For traders who want another momentum tool beside RSI, this guide on how to read MACD pairs well with trend confirmation work.
Divergence is useful, but only if you keep it in context
Divergence can help, but traders misuse it constantly.
Regular bearish divergence appears when price makes a higher high while RSI makes a lower high. Momentum is weakening even though price has pushed higher.
Regular bullish divergence appears when price makes a lower low while RSI makes a higher low. Selling pressure is losing force.
That sounds simple. The problem is timing. Divergence can appear long before price turns. If you trade it too early, you're just fading trend with extra steps.
A more disciplined use of divergence:
- Use it near a meaningful chart level. Prior high, prior low, session extreme, or major structure zone.
- Wait for price to confirm. A failed breakout, structure break, or rejection is stronger than divergence alone.
- Treat it as a warning first. It often helps with exits and reduced aggression before it helps with reversal entries.
Divergence is a heads-up, not an order.
Mean reversion versus trend following
The choice isn't about which strategy sounds smarter. It's about matching the setup to the market in front of you.
| Criteria | Mean Reversion Strategy | Trend Following Strategy |
|---|---|---|
| Core idea | Fade a stretched move back toward balance | Trade with the dominant directional push |
| Best market type | Range-bound or choppy markets | Clean trending conditions |
| Typical RSI use | Extremes near oversold or overbought zones | Centerline behavior and momentum confirmation |
| Entry style | Buy weakness into support or sell strength into resistance after confirmation | Buy pullbacks in uptrends or sell rallies in downtrends |
| Main danger | Reversing straight into strong trend continuation | Chasing late after the move is extended |
| Best trader fit | Traders comfortable taking quick bounce setups | Traders who prefer patience and structure |
| Management style | Faster profit-taking, tighter expectations | Let winners run if trend structure holds |
A cleaner way to operate day to day
If you trade intraday on cTrader or DXtrade, keep the decision tree simple:
- If the market is balanced, look for mean reversion.
- If the market is directional, use RSI to confirm continuation.
- If divergence appears against your open trade, tighten management and watch for structure failure.
- If RSI and price disagree but price is still strong, trust price first.
That last line matters. Indicators summarize what price has already done. Price itself still leads.
A good rsi trading strategy doesn't lock you into one style. It helps you recognize when to fade extremes and when to stop fading them.
Advanced RSI Techniques for Prop Firm Traders
A retail trader can afford to be messy for a while. A prop trader can't. If your framework includes a 5% daily loss limit and a 10% maximum drawdown, every RSI setup has to earn its place.
That's where multi-layer confirmation helps. Instead of taking a signal from one RSI line, you can ask momentum to agree across short, medium, and slower settings before you commit.

According to StockstoTrade's triple RSI strategy overview, the Triple RSI Alignment Strategy can achieve a 90% win rate in backtests across forex, indices, and crypto on 5 to 15 minute charts when RSI 5, 14, and 21 align in overbought or oversold territory with volume confirmation. That doesn't mean you should expect that result live. It does mean the structure is worth studying because it forces patience.
Why triple confirmation changes trader behavior
Most losing RSI trades come from impatience. One fast RSI line flashes oversold, the trader jumps in, and price keeps moving against the position.
Triple alignment slows that process down.
A practical long setup looks like this:
- Fast momentum is stretched. RSI 5 is very weak.
- Core momentum agrees. RSI 14 also shows oversold conditions.
- Broader short-term pressure matches. RSI 21 confirms the same direction.
- Price gives a trigger. Buyers start defending the area.
- Volume confirms interest. The move isn't just a dead bounce.
For a short setup, reverse the conditions.
This kind of structure is especially useful in fast markets like indices, gold, or crypto where single-indicator signals can fire too often.
How to use it without violating firm risk rules
A strategy is only useful if it fits the account rules. On platforms such as cTrader and DXtrade, I’d treat triple RSI alignment as a filter first and an entry tool second.
Use it like this:
Build the trade around the loss limit
Start from risk, not from the setup.
- Know the maximum loss before the session starts. If your day has a hard limit, define your personal stop before that line.
- Cut size when volatility expands. A setup can still be valid and still be too expensive to trade.
- Avoid revenge entries. Triple alignment loses its edge if you start forcing the next signal after a hit.
Require price structure
Triple RSI alignment by itself still isn't enough. You want one more piece of evidence from the chart:
- reclaim of a minor intraday level
- rejection from support or resistance
- break in short-term market structure
- failure of the previous impulse to continue
That extra layer keeps you out of many low-quality signals.
On a prop account, the best trade is often the one you skip because the stop is too wide for the session risk budget.
Manage around drawdown, not excitement
When traders hear about a high backtested win rate, they usually loosen discipline. That's backwards.
Do the opposite:
- Take partials earlier if the market is choppy
- Reduce exposure after a losing trade
- Stop trading if your execution degrades
- Don't stack similar positions across correlated instruments
The account survives because your worst day stays controlled. That's the essence of it.
Where this setup fits best
Triple RSI alignment tends to be more useful when you want a structured intraday model. It suits traders who like short-term charts, high-liquidity instruments, and clearly defined execution windows.
It's less useful if you:
- enter impulsively off one candle
- don't track volume or structure
- struggle to pass on second-rate setups
- keep changing indicator settings every few sessions
Consistency matters. The strategy loses value if you keep "improving" it based on the last trade.
A note on automation and workflow
If you're algorithmic or semi-systematic, triple RSI logic is one of the easier RSI frameworks to translate into rules. You can define thresholds, require alignment, and add price conditions before a bot places an order.
That's also where outside research can help. If you're exploring rule-based systems, signal filtering, or automation logic, some of the articles about AI from Xholic AI are useful for thinking through how structured decision processes can reduce noise in repetitive trading tasks.
The key is restraint. Build the bot around the same discipline you'd use manually. No strategy becomes prop-safe just because code executes it faster.
How to Backtest and Optimize Your RSI Strategy
A strategy idea isn't worth much until you've tested it. Most RSI traders don't lose because the indicator is broken. They lose because they never proved whether their exact setup works on their instrument, timeframe, and execution style.

That matters even more for algorithmic trading and weekend-hold decisions. OANDA's discussion of mastering RSI strategies notes that post-2025 data showed RSI(14) entries below 30 on gold and crypto produced a 72% win rate when combined with structure breaks, but false signals rose by 45% during high-volatility weekends without adaptive filters. The lesson is simple. The same RSI logic behaves differently across conditions.
If you need a broader primer before building tests, this overview of what backtesting is is a good starting point.
What to test first
Don't optimize everything at once. Start with one idea and define it clearly.
For example:
- Market. Forex, index, crypto, or commodity
- Timeframe. Daily, intraday, or a specific session window
- RSI setting. Standard or shortened
- Trigger. Extreme reading, centerline confirmation, or divergence plus structure
- Exit rule. Opposite signal, target, trailing logic, or structure failure
A lot of traders sabotage the process here. They test a vague idea like "buy oversold RSI." That's not a strategy. That's a loose observation.
A simple backtesting workflow
Use a checklist that forces clarity.
Define one setup in one sentence
Example: Buy when RSI reaches an extreme, price holds a support area, and structure breaks back in the trade direction.Choose one instrument and one timeframe
Don't mix markets in the same first test.Collect enough examples
You want repetition across different conditions, not a handful of pretty screenshots.Log each trade the same way
Entry, stop, exit, chart condition, and why the trade qualified.Review losing clusters
Most useful insights come from where the setup breaks down.Adjust one variable at a time
If you change RSI period, threshold, entry trigger, and exit logic together, you won't know what improved or harmed the system.
Basic pseudocode for a rule-based RSI test
This is intentionally plain so you can adapt it to a spreadsheet, journal, or cTrader automation script.
Testing idea: Keep the logic simple enough that another trader could follow it exactly from your notes.
- If RSI reaches the chosen extreme zone
- And if price is at a predefined structure area
- And if price confirms with a break, reclaim, or rejection rule
- Then mark entry at candle close or next bar open
- Set stop at the invalidation point on the chart
- Exit by target, opposite condition, or structure failure
- Record outcome and market condition
- Repeat across historical data without changing the rules mid-test
That process works whether you're building manual discipline or coding an EA.
How to avoid curve fitting
Curve fitting is what happens when you keep tweaking the strategy until it looks perfect on old data and then falls apart live.
Watch for these warning signs:
- You keep changing thresholds after every losing cluster
- The rules become too specific
- The setup only works on one instrument and one exact period
- You can't explain why a parameter should work logically
A stronger approach is to seek reliability, not perfection. If one RSI variation works only under very narrow conditions, that's fragile. If a setup works reasonably across related markets and still makes sense visually, that's more trustworthy.
What to optimize for prop-style trading
If you're trading under external rules, test for more than raw signal quality.
Focus on:
- Drawdown behavior. Can the strategy survive a rough patch without breaking account rules?
- Session discipline. Does it overfire in noisy periods?
- Weekend behavior. Relevant for crypto and commodities if holding is allowed.
- Execution realism. Could you follow the entries on cTrader or DXtrade without hesitation?
Your best RSI strategy might not be the one with the highest backtest return. It may be the one you can execute cleanly while staying inside risk parameters.
The trader who tests rigorously improves faster than the trader who keeps hunting for a magic setting.
Frequently Asked RSI Trading Questions
Which RSI setting should beginners start with
Start with the standard setting first. It gives you a stable baseline and helps you learn how RSI behaves before you move to faster settings.
Shorter periods can be more responsive, but they also produce more noise. If you're still learning, it's better to understand one setting well than to keep changing inputs every week.
Should I buy every time RSI goes below 30
No. An RSI reading below the lower extreme only tells you momentum is stretched. It doesn't prove price is ready to reverse.
Wait for context. Check whether price is hitting support, whether the market is ranging or trending, and whether price action confirms the bounce. Without that, you're often buying weakness just because it looks cheap.
Is RSI better for day trading or swing trading
It can work in both. The difference is how you apply it.
For swing trading, RSI often helps identify broader pullbacks or momentum shifts. For day trading, it can help with timing, but you need tighter structure, cleaner execution, and more discipline because intraday noise creates more false signals.
What should I combine with RSI
Keep it simple. The most useful companions are usually:
- Price structure such as highs, lows, and break or reclaim zones
- Support and resistance so RSI extremes happen in meaningful locations
- Volume or participation clues when available
- A trend filter such as the RSI midpoint or another momentum tool
You don't need a screen full of indicators. You need one momentum tool and a clear chart.
How do I know if my RSI strategy is good enough to trade live
You should be able to answer four questions clearly:
- What conditions does it need
- What invalidates the setup
- How will you manage losses
- Have you tested it enough to trust the process
If any of those answers are vague, keep testing. Live trading punishes unclear rules fast.
If you're ready to apply a disciplined rsi trading strategy in a prop environment, explore the funding options at MyFundedCapital. Compare challenge models, account types, and platform choices like cTrader and DXtrade, then choose a path that fits your trading style and risk control.