Trying to make sense of a price chart can feel like staring into chaos, with the constant up-and-down ticks creating "noise" that makes it tough to see the underlying trend. This guide explains how the Moving Average (MA) indicator helps you cut through that clutter and build practical, risk-managed trading strategies. You will learn the core types of MAs, how to interpret their signals, and how to apply them with actionable steps.
What Is the Moving Average Indicator?
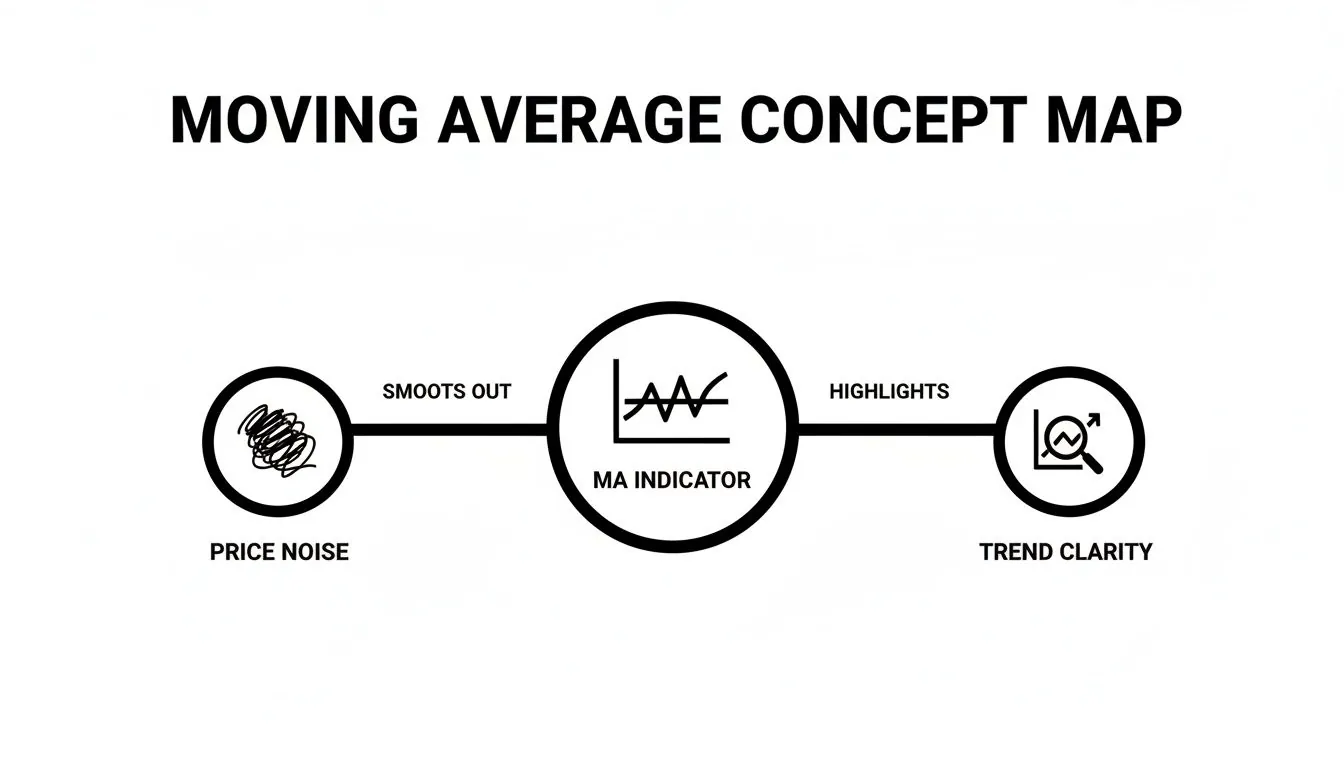
At its core, a moving average smooths out price action by calculating an average price over a set number of periods. The result is a single, flowing line on your chart that cuts through short-term volatility. This helps you answer the most fundamental question in trading: which way is the market heading?
- If the price is consistently above the moving average, you're likely in an uptrend.
- If it’s consistently below, you're probably in a downtrend.
It’s a straightforward way to get a clearer picture of market direction. However, remember that all trading involves risk of loss, and this indicator is an educational tool, not financial advice.
The Core Types of Moving Averages Explained
While there are many variations, most moving averages balance two key traits: smoothness and responsiveness. Understanding the two most common types is a crucial first step for any trader.
Simple Moving Average (SMA)
The Simple Moving Average (SMA) is the most basic type. It's calculated by adding up the closing prices over a specific number of periods and then dividing by that number. For a 20-period SMA, the price from 20 days ago has the same weight as yesterday's price.
This equal weighting makes the SMA very smooth, which is great for identifying long-term, established trends. Its main drawback is that it's slow to react to new price changes, making it a lagging indicator.
Exponential Moving Average (EMA)
The Exponential Moving Average (EMA) was designed to solve the SMA's lag problem by giving more weight to the most recent prices. This makes it "hug" the price action more closely.
- Pro: It provides earlier signals for entries and exits, which is a major benefit for day traders and swing traders.
- Con: It’s more susceptible to "whipsaws"—false signals that can generate losses in choppy or sideways markets.
SMA vs. EMA: A Quick Comparison
Choosing between an SMA and an EMA depends on your trading style and goals.
| Characteristic | Simple Moving Average (SMA) | Exponential Moving Average (EMA) |
|---|---|---|
| Calculation | Equal weight to all data points | More weight on recent data |
| Responsiveness | Slower to react to price changes | Faster to react to price changes |
| Smoothness | Very smooth, less noise | Less smooth, tracks price closely |
| Best For | Long-term trend identification | Short-term signals, early entries |
| Main Drawback | Significant lag | Prone to whipsaws/false signals |
For a deeper dive into trend analysis, check out our guide on how technical analysis helps in charting trends.
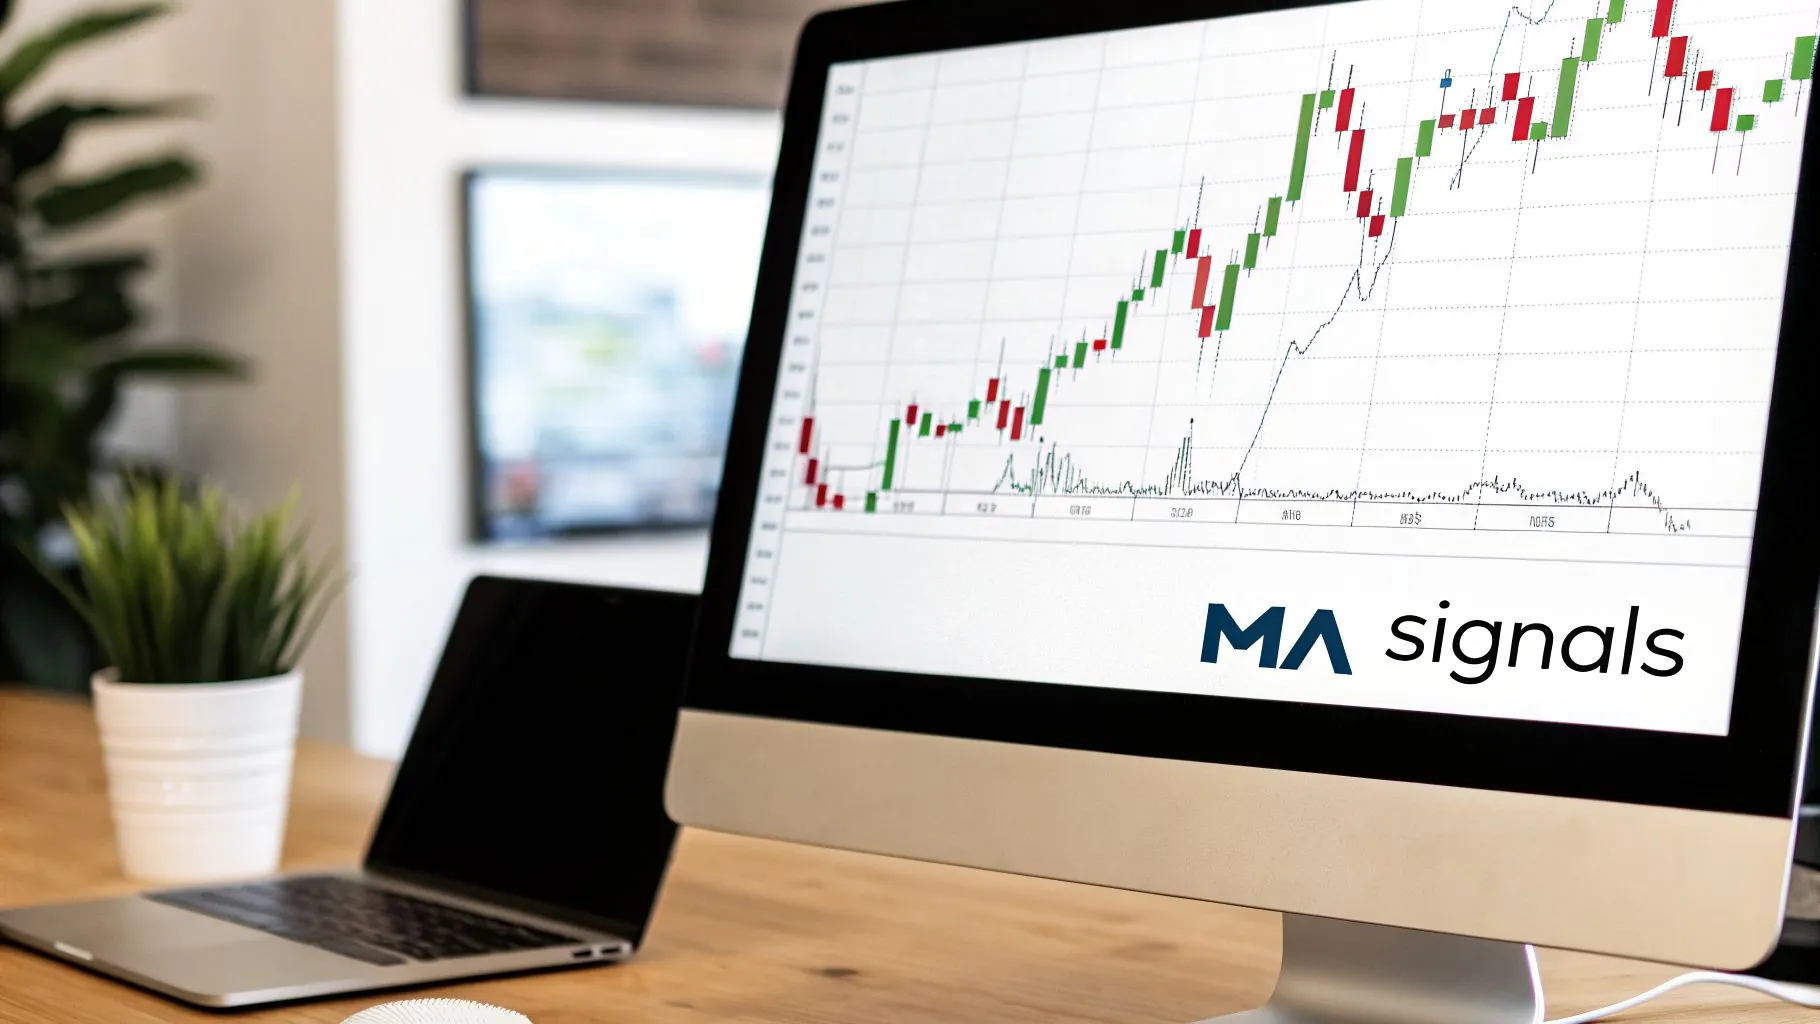
How to Read a Moving Average Indicator
An indicator is useless if you can't translate its signals into actionable information. These are the core techniques for using the moving average indicator in your analysis. Remember, no signal is a guarantee, and trading always carries a significant risk of loss.
Identifying the Trend Direction
The most fundamental use of a moving average is as a quick visual guide to the market's trend.
- Uptrend: Price stays consistently above the moving average.
- Downtrend: Price trades consistently below the moving average.
- Ranging Market: Price chops back and forth across a flat moving average, signaling sideways conditions where MAs are unreliable.
Using MAs as Dynamic Support and Resistance
A moving average can act as a dynamic level where the market might react. In a healthy trend, the price often pulls back to a key moving average, tests it, and then bounces off to continue the trend.
For example, a trader might watch for price to retrace to the 50-period EMA in an uptrend, look for a bullish candlestick pattern as confirmation of a bounce, and then consider a long entry. The MA acts as a flexible floor or ceiling.
Interpreting Moving Average Crossovers
Crossovers provide more explicit entry and exit signals. This happens when a shorter-term (fast) MA crosses over a longer-term (slow) MA, signaling a potential change in momentum.
- Golden Cross (Bullish): A short-term MA (e.g., 50-period) crosses above a long-term MA (e.g., 200-period). This suggests a new major uptrend could be starting.
- Death Cross (Bearish): A short-term MA crosses below a long-term MA, signaling a potential downtrend.
Crossovers are lagging signals—they only confirm a trend after it's already started. In choppy markets, they can also generate a frustrating series of false signals. Many traders combine crossovers with other tools, like the one in our guide on how to read the MACD indicator, for better confirmation.
How to Choose the Right Moving Average Length
There is no single "best" setting for a moving average. The ideal length depends entirely on your trading style, the asset you're trading, and what you want to achieve. A short length (e.g., 10-period) is responsive but noisy, while a long length (e.g., 200-period) is smooth but slow.
Aligning MA Length with Your Trading Style
- Short-Term (5-20 periods): Used by scalpers and day traders on lower timeframes (e.g., 5-minute, 15-minute) to spot quick momentum shifts. The 9 EMA and 20 EMA are common choices.
- Medium-Term (20-60 periods): Favored by swing traders holding positions for days or weeks. The 50 EMA is a classic on the 4-hour or daily chart for gauging the main trend and identifying pullback entries.
- Long-Term (100-200 periods): Watched by position traders and investors to identify major market cycles. The 200-period MA on a daily chart is widely seen as the line between a bull and bear market.
The only way to find what works for your system is through deliberate testing. You can learn how to systematically test your strategies with the right software to build confidence in your settings before risking real capital.
Actionable Moving Average Trading Strategies
Knowing the theory is one thing, but building a repeatable trading plan is another. Here are two practical strategy blueprints. These are educational examples, not financial advice. Always practice strict risk management, as trading is inherently risky.

The 20 & 50 EMA Crossover Strategy
This is a clear, mechanical strategy for day and swing traders, using a fast 20 EMA and a slower 50 EMA to define the trend.
Here’s a step-by-step example for a potential long trade on the 1-hour chart:
| Step | Action | Concrete Example |
|---|---|---|
| 1. Signal | Wait for the 20 EMA to cross above the 50 EMA. | The crossover signals a potential shift to bullish momentum. |
| 2. Entry | Enter long after the crossover candle closes. | For instance, enter near the open of the next candle at 1.0850. |
| 3. Stop-Loss | Place the stop-loss below the recent swing low or the 50 EMA. | If the recent low is 1.0820, set your stop-loss at 1.0815 (35 pips). |
| 4. Take-Profit | Target a minimum 1:1.5 risk-to-reward ratio. | With a 35-pip risk, your first profit target would be at least 52.5 pips away, at 1.09025. |
The 50 EMA Trend-Following Pullback Strategy
This approach uses the 50 EMA as a dynamic support/resistance zone to enter an established trend.
Here's a checklist for a long trade:
- Confirm the Trend: Is the price consistently trading above the 50 EMA?
- Wait for a Pullback: Patiently wait for the price to retrace and touch the 50 EMA.
- Find a Confirmation Signal: Look for a bullish candlestick pattern (e.g., a pin bar or engulfing candle) that rejects the 50 EMA.
- Enter the Trade: Place a buy order after the confirmation candle closes.
- Set Your Stop-Loss: Place your stop just below the low of the confirmation candle.
- Plan Your Exit: Set a take-profit at the next resistance level or use a trailing stop to ride the trend.
This method requires patience but can yield high-probability entries. Always adhere to strict risk rules, like risking only 1-2% of your account per trade.
Common Moving Average Pitfalls to Avoid
Moving averages have built-in flaws. Understanding them is key to protecting your capital.
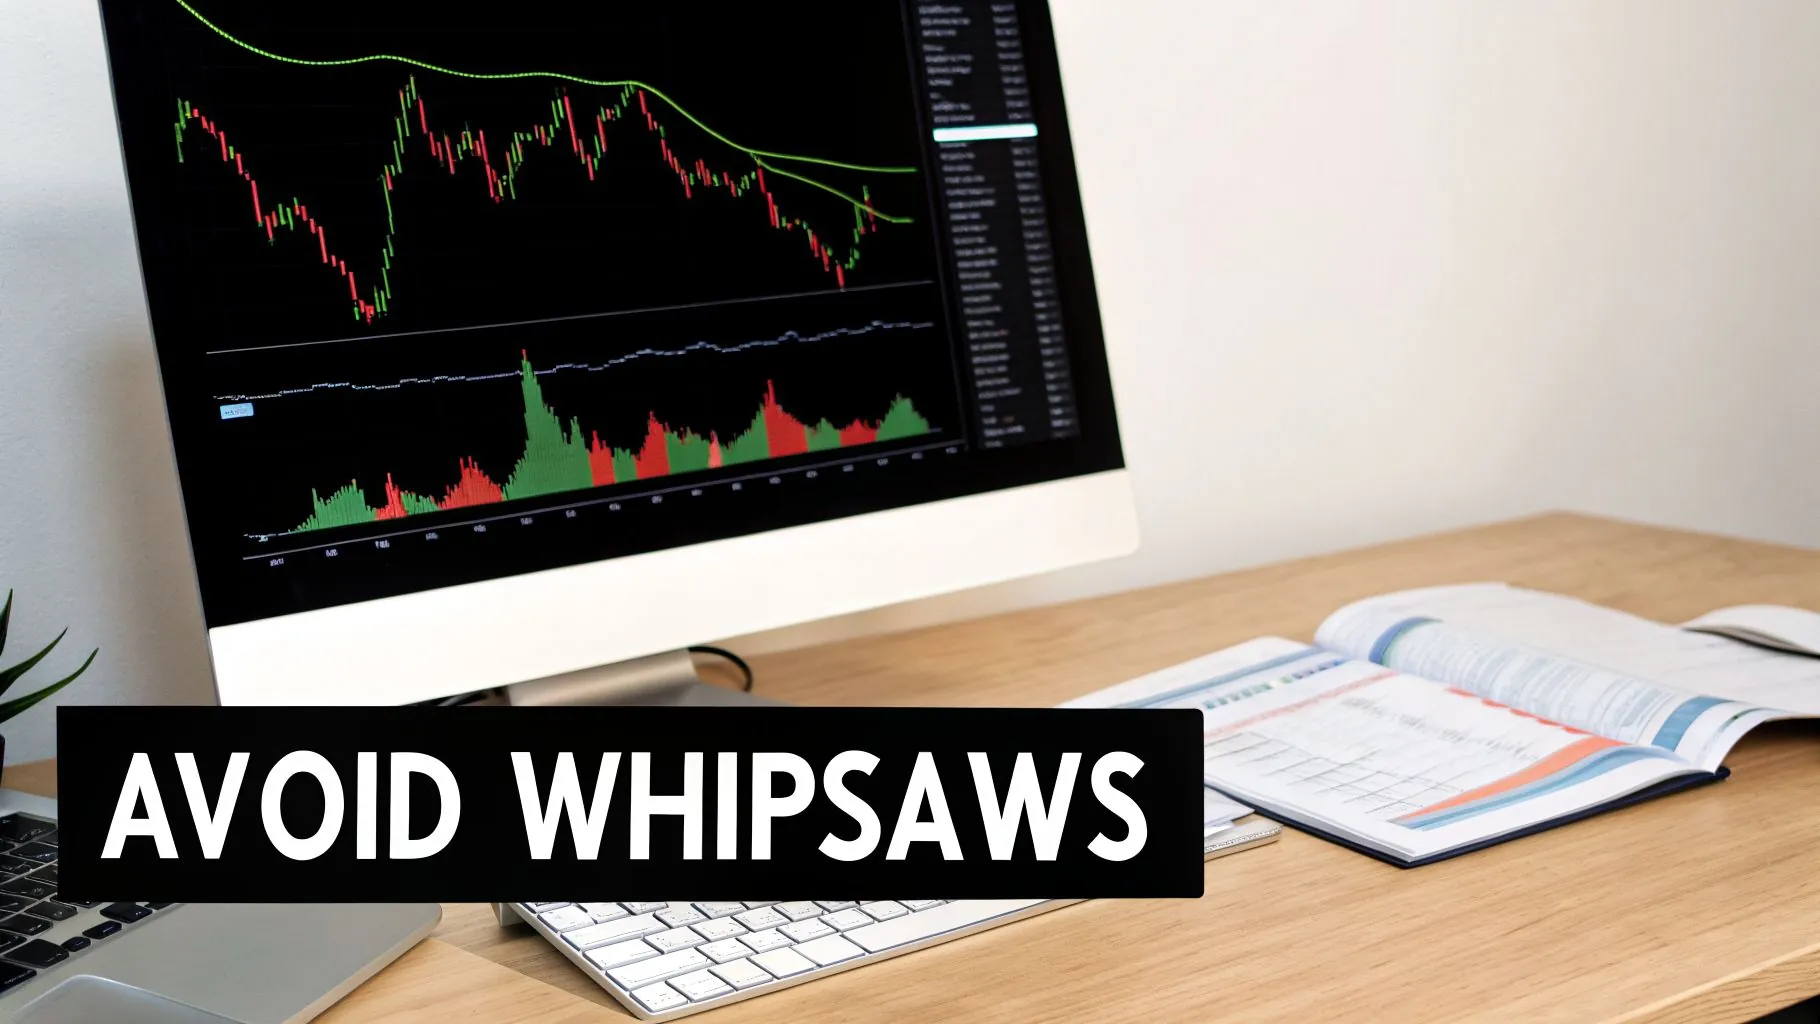
Getting "Whipsawed" in Ranging Markets
When a market has no clear direction, the price will chop back and forth across your moving average, triggering a series of false signals and small losses. This is the biggest trap for MA traders.
- How to Avoid It: Stay out of directionless markets. A flat, horizontal moving average is a clear warning sign. For better confirmation, pair your MA with a trend-strength indicator like the Average Directional Index (ADX). Many traders only take MA signals when the ADX is above 25, which suggests a trending market.
The Problem of Lag
Because MAs are based on past prices, they are always lagging indicators. They will never get you in at the absolute bottom or out at the absolute top. Your goal isn't to eliminate lag but to manage it.
Pre-Trade Checklist for MA Signals
Before taking any trade, run through this quick checklist:
- Is there a clear trend? Check the MA's slope and confirm with a higher timeframe or the ADX. If it's flat, stay out.
- Where is the market structure? Are you about to trade directly into a major support or resistance level?
- What is price action telling you? Does a strong bullish candle support your buy signal, or are the candles weak and indecisive?
This disciplined approach ensures you are using the moving average indicator as a tool, not a crutch.
FAQ: Common Questions About the Moving Average Indicator
Which moving average is best for day trading?
Most day traders prefer the Exponential Moving Average (EMA) because it reacts faster to price changes. Common settings include the 9 EMA for aggressive entries and the 20 or 21 EMA as a short-term trend filter. However, there's no single "best" setting; you must test to see what works for your specific strategy and the asset you trade on platforms like cTrader, DXtrade, or Match-Trader.
Can you trade profitably with only a moving average?
Relying solely on a moving average is not recommended. As a lagging indicator, it is prone to false signals ("whipsaws") in non-trending markets. Profitable trading often relies on confluence—getting confirmation from multiple, non-correlated tools (e.g., price action, support/resistance levels, oscillators) before entering a trade.
How do I add a moving average to my chart?
On any standard trading platform, you can add an MA by following these simple steps:
- Open the 'Indicators' library from your chart's menu or toolbar.
- Search for 'Moving Average' and select it.
- In the settings window, choose the type (e.g., Exponential), set the period (e.g., 50), and customize the color and style.
What is the difference between a golden cross and a death cross?
A golden cross is a bullish signal that occurs when a short-term moving average (like the 50-day) crosses above a long-term moving average (like the 200-day), suggesting a potential major uptrend. A death cross is the opposite—a bearish signal where the short-term MA crosses below the long-term MA, indicating a potential major downtrend. Both are lagging signals and are most significant on higher timeframes.
Ready to apply what you've learned and prove your trading skills? MyFundedCapital offers the capital and support you need to take your trading to the next level.
Compare our funding programs and find the right fit for your strategy.