You're probably staring at a chart right now, watching Stochastic bounce above 80 or below 20, and wondering why the “easy” signals keep turning into bad entries. That's the trap. Used casually, this indicator can burn through a challenge account fast. Used with context and risk control, it becomes a useful timing tool instead of a false sense of certainty.
Free resources: Best Indicators for Prop Traders (the five indicators funded traders use most, with settings).
What Is the Stochastic Oscillator and Why It Fails Most Traders
A new trader usually learns Stochastic the same way. If it's below 20, buy. If it's above 80, sell. Then price keeps trending, the entry goes underwater, and the trader blames the indicator.
The indicator wasn't built to predict tops and bottoms on command. It was built to measure momentum relative to a recent range. George Lane developed the Stochastic Oscillator in the late 1950s, and the standard 14-period setting is still the default on platforms such as cTrader and DXtrade. Its core formula is %K = [(C – L14) / (H14 – L14)] × 100, and readings above 80 are treated as overbought while readings below 20 are treated as oversold, as outlined by StockCharts' explanation of George Lane's stochastic framework.
What the indicator is actually telling you
Stochastic asks a simple question: where did price close relative to its recent high-low range?
That matters because strong trends tend to close near the top or bottom of their range. So an overbought reading doesn't automatically mean “sell now.” It can mean buyers still control the move. The same applies in reverse for oversold readings during a hard selloff.
Practical rule: Treat 80 and 20 as alert zones, not action buttons.
If you want to understand how to use Stochastic Oscillator properly, stop treating it like a standalone trigger. It works best as a timing layer on top of trend, price structure, and risk limits.
Why the basic approach fails
Most traders lose with Stochastic for three reasons:
- They trade against trend They short a strong bullish move just because the oscillator sits above 80.
- They enter too early They react to the line touching an extreme instead of waiting for momentum to shift.
- They ignore account risk One bad countertrend trade often turns into revenge trading.
A prop-style mindset changes the way you read this tool.
Instead of asking, “Is it overbought?” ask:
- Where is the higher-timeframe trend?
- Is price pulling back into a logical area?
- Is momentum turning, or just stretched?
- If this fails, is the loss small enough to keep me in the game?
That last point matters most. Trading involves risk of loss. A clean-looking oscillator signal means nothing if the trade idea forces you into sloppy risk placement or emotional management. This article is educational only, not financial advice.
Decoding Stochastic Signals Beyond Overbought and Oversold
Most traders only notice the zones. Professionals watch the relationship between the two lines.
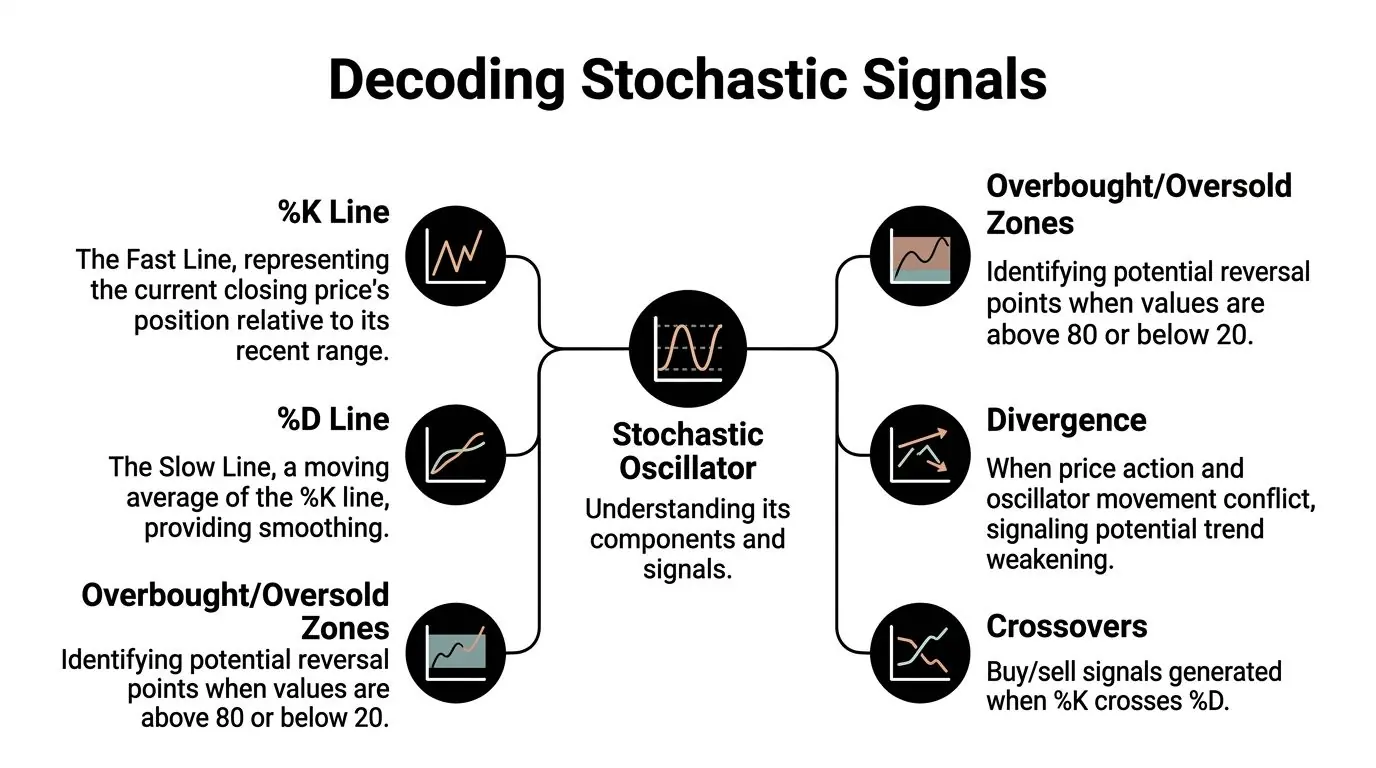
The Stochastic Oscillator has:
- %K, the faster line
- %D, the slower line, calculated as a 3-period SMA of %K
What matters isn't just where the lines are. It's how they interact inside those zones.
The signals that matter most
The cleanest Stochastic signals come from two crossover patterns. An oversold cross happens when %K crosses above %D while both are below 20. An overbought cross happens when %K crosses below %D while both are above 80. The 50 level also matters because it acts as a midline pivot that helps define directional bias, as explained in this breakdown of oversold crosses, overbought crosses, and the 50 pivot.
Think of %K as the impatient trader and %D as the calmer trader. When the fast line turns first and crosses the slower line in an extreme zone, that's your first sign momentum may be rotating.
How to read the 50 level properly
The 50 line doesn't get enough attention.
If Stochastic is above 50, price is trading in the upper half of its recent range. If it's below 50, it's trading in the lower half. That doesn't replace trend analysis, but it gives you a useful directional bias.
Use it like this:
- Above 50 Favor long setups, especially if price structure also supports continuation.
- Below 50 Be more selective with longs and look harder at bearish continuation.
- Whipsaw around 50 Stand down. Momentum is mixed.
When Stochastic keeps flipping around 50, the chart is usually telling you to trade less, not more.
There's another useful layer that many traders overlook: divergence. If price pushes to a new swing high or low while momentum doesn't confirm, that can hint at weakening pressure. If you want to study that concept in more detail, this guide on trading with divergence is worth reviewing.
A simple way to avoid bad reads
Don't trade every crossover. Filter them.
A better checklist:
- Location first Is the cross happening in an extreme zone or around the midline?
- Market context second Is price ranging, trending, or compressing?
- Structure third Did price react from support, resistance, or a pullback area?
That's the shift from indicator worship to actual trade reading.
A High-Probability Stochastic Strategy for Any Market
The safest way to use Stochastic isn't to call reversals. It's to time pullbacks inside the dominant trend. That approach is more aligned with disciplined trading because it keeps you from fighting momentum.

A practical three-layer method works well here. First, identify the dominant trend on the daily chart. Second, drop to a lower timeframe and only consider Stochastic signals that agree with that trend. Third, wait for the %K line to cross %D while the oscillator is in an extreme zone, which helps filter weak reversal attempts, as described in OANDA's stochastic strategy guide.
The three-layer checklist
Daily chart trend
Start with the higher timeframe.
Use a 100-period SMA on the daily chart:
- Price above the SMA bullish environment
- Price below the SMA bearish environment
This step keeps you from taking every shiny signal on the lower timeframe.
Lower timeframe setup
Move down to a 2-hour chart and wait for a pullback.
In an uptrend:
- Let price retrace
- Wait for Stochastic to move toward oversold
- Ignore the temptation to short overbought readings
In a downtrend, flip the logic:
- Wait for a rally
- Watch for Stochastic to move toward overbought
- Ignore bullish reversal urges unless the broader trend has changed
Trigger
The actual trigger is specific:
- In a bullish trend, wait for %K to cross above %D within the oversold zone
- In a bearish trend, wait for %K to cross below %D within the overbought zone
That trigger isn't exciting. That's the point. Boring rules usually protect capital better than dramatic instincts.
What this looks like in practice
A clean long setup might look like this:
- Daily chart is above the 100 SMA.
- Price pulls back on the 2-hour chart instead of breaking trend.
- Stochastic drops below 20.
- %K crosses above %D.
- Entry goes in only if price action supports the turn.
For many traders, the missing piece is patience. They see the market dip, guess the turn, and enter before the crossover happens.
Desk rule: If the trend filter and trigger don't align, there is no trade.
Why this works better than reversal hunting
Countertrend trades feel clever. Trend pullback trades tend to be more survivable.
That matters if you're trying to build consistency. One of the fastest ways to damage an account is to keep fading strong directional moves because an oscillator looks stretched. A structured Stochastic process gives you fewer trades, but those trades usually make more sense from both a chart and risk perspective.
Avoiding Common Stochastic Traps and Managing Risk
The most expensive Stochastic mistake is believing overbought means “must fall now” and oversold means “must bounce now.” In a strong trend, the indicator can stay stretched for much longer than a trader expects.
That's where people start averaging in, widening stops, and losing control.
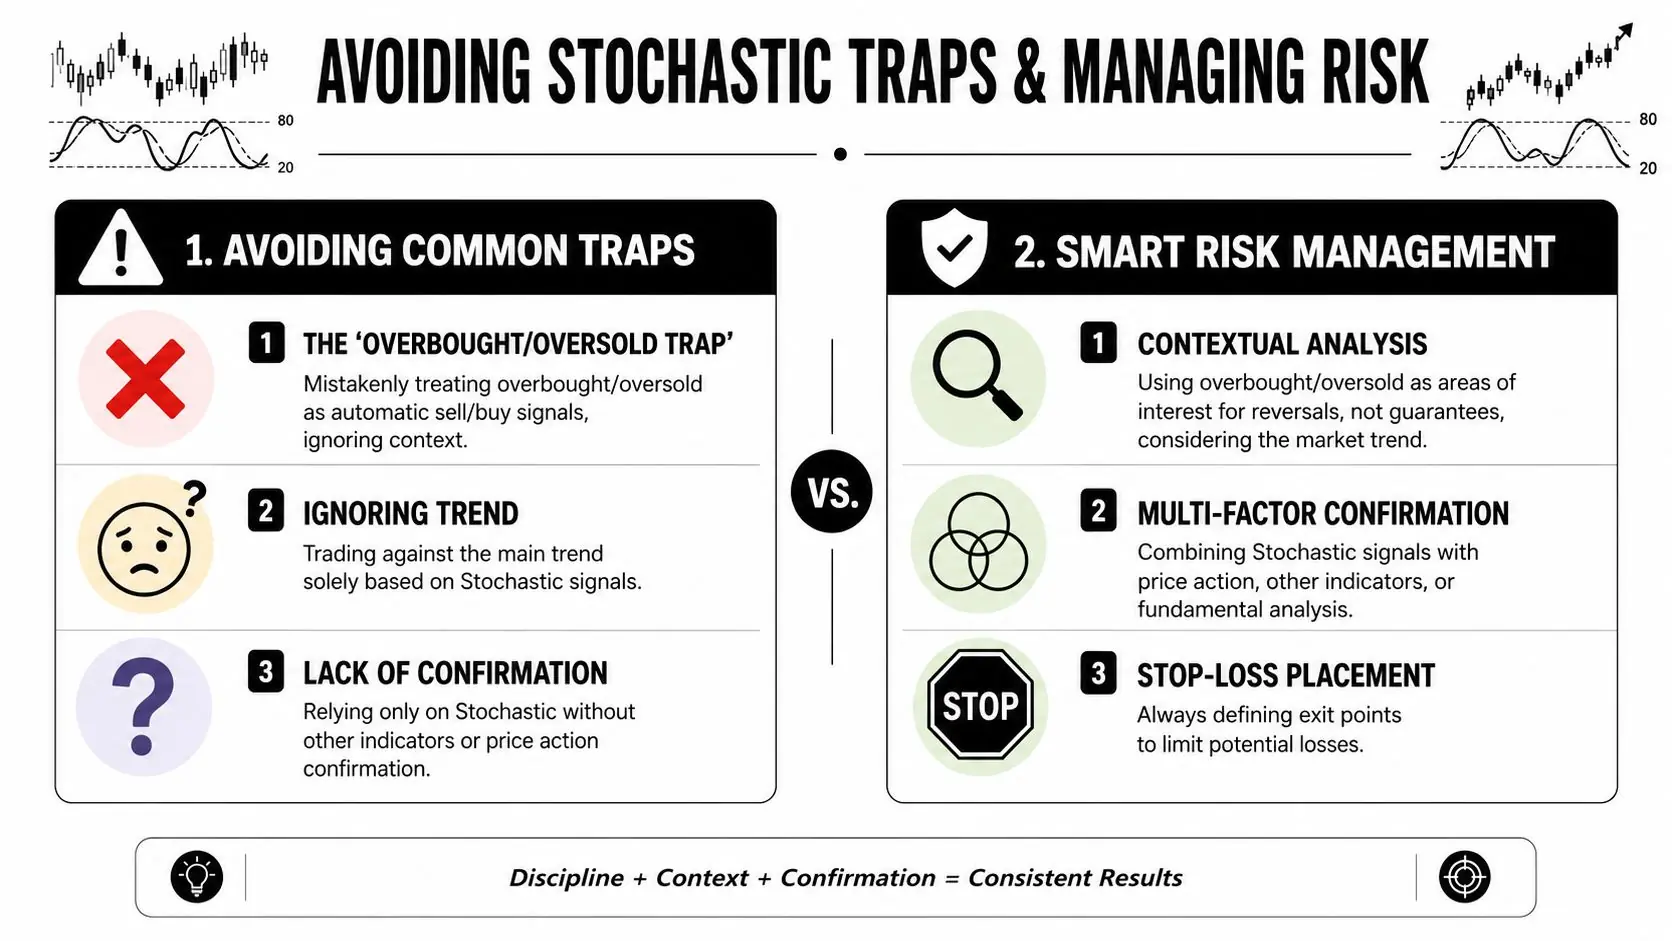
The trap is well known. Using overbought and oversold readings without trend confirmation has a documented failure rate of over 60%, and one practical fix is requiring price to pull back into the area between the 21 EMA and 50 EMA before taking the signal, according to this discussion of the overbought and oversold trap and EMA value zones.
What a bad Stochastic trade looks like
A common bad short setup looks like this:
- Price is trending up cleanly
- Stochastic pushes above 80
- Trader sells immediately
- Price pauses briefly, then continues higher
- Trader adds to the loser because it's “still overbought”
That's not a Stochastic problem. That's a context problem.
The professional filter
A better method is to require three things before acting:
- Trend agreement Trade with the higher-timeframe direction.
- Value-zone pullback Wait for price to retrace into the band between the 21 EMA and 50 EMA.
- Confirmation Let the Stochastic signal line cross happen after that pullback, not in the middle of an extended impulse.
This changes the role of the indicator. Instead of chasing exhaustion, you're using it to time re-entry into trend.
Add one more layer of confirmation
Stochastic alone is too thin for many setups.
Better filters include:
- Candlestick confirmation A clear rejection or continuation candle
- MACD agreement If momentum on MACD supports the same direction, weak entries are easier to avoid
- Market structure A higher low in an uptrend or lower high in a downtrend
If you're still learning to control losses, keep your process tight and repetitive. A strong framework for risk management in forex trading matters more than squeezing extra trades out of an indicator.
Don't use Stochastic to predict. Use it to narrow your timing after the market has already shown its hand.
Risk-first habits that keep you alive
Here's the part traders skip:
- Predefine the invalidation If the setup fails, know where the idea is wrong.
- Skip crowded signals If the move is already extended, let it go.
- Avoid emotional re-entry A missed trade is cheaper than a forced trade.
- Journal the failures Stochastic mistakes repeat in patterns. Your notes will expose them.
Trading involves risk of loss. This article is educational only and not financial advice.
Practical Setup on cTrader, DXtrade, and MT5
Theory is useless if you can't set the tool up cleanly on your platform.
The standard Stochastic calculation uses %K = [(C – L14) / (H14 – L14)] × 100, with 14 periods as the default lookback you'll typically find in cTrader and DXtrade, as shown in Admiral Markets' formula breakdown for the Stochastic Oscillator.

cTrader
- Open the indicator menu Search for Stochastic.
- Apply it to the chart It will appear in a separate panel below price.
- Use the standard values Set the lookback to 14 and keep the signal line aligned with the standard Stochastic structure you're testing.
- Save the layout If you use this daily, save it as a template.
DXtrade
- Choose your market and timeframe Open the chart first.
- Add Stochastic Oscillator Use the built-in indicator library.
- Check the default values DXtrade normally starts with the standard configuration, so verify rather than guess.
- Add moving averages too If you're using trend and value-zone filters, place them on the same chart.
MT5
- Insert the indicator from the navigator or insert menu
- Review parameters before clicking OK
- Keep the chart clean Price, your moving averages, and Stochastic are enough for most traders
- Test on demo first Don't change settings randomly because one losing trade annoyed you
If you want to practice the setup environment before going live, an MT5 demo account guide can help you get comfortable with the workflow.
Stochastic Oscillator FAQ and Your Next Step
Can I use Stochastic Oscillator on its own
You can, but that doesn't mean you should. Stochastic works better as a timing tool inside a broader process that includes trend direction, price structure, and risk control. Used alone, it often encourages premature entries.
Is overbought always a sell signal
No. Overbought means price is trading near the top of its recent range. In a strong uptrend, that can reflect strength rather than immediate reversal. The same logic applies to oversold conditions in a downtrend.
What's the best way to learn how to use Stochastic Oscillator
Use one market, one or two timeframes, and one repeatable checklist. Don't keep changing settings every week. Review screenshots of both good and bad signals and focus on whether the trade aligned with trend and location.
Is this indicator suitable for prop-style trading
Yes, if you use it conservatively. The best use case is filtering for selective pullback entries instead of firing at every extreme reading. That approach fits a discipline-first mindset much better than constant reversal trading.
A trader doesn't pass challenges by finding a magic indicator. They pass by combining a workable signal with patience, clean execution, and controlled downside. That's the right way to think about Stochastic.
If you're ready to apply this with structured risk limits and platform flexibility, explore the funding options at MyFundedCapital. Compare account types, review the challenge models, and choose the path that fits your trading style best.