Most traders don't blow up because they can't read a chart. They blow up because they enter before they've done the math. A good Day Trade Calculator turns a trade idea into a risk decision, and that matters even more when you're trading inside firm rules that don't forgive sloppy execution.
Free resources: Daily Trading Checklist (a pre-market routine, in-session rules and a post-market review), and the free Position Size Calculator.
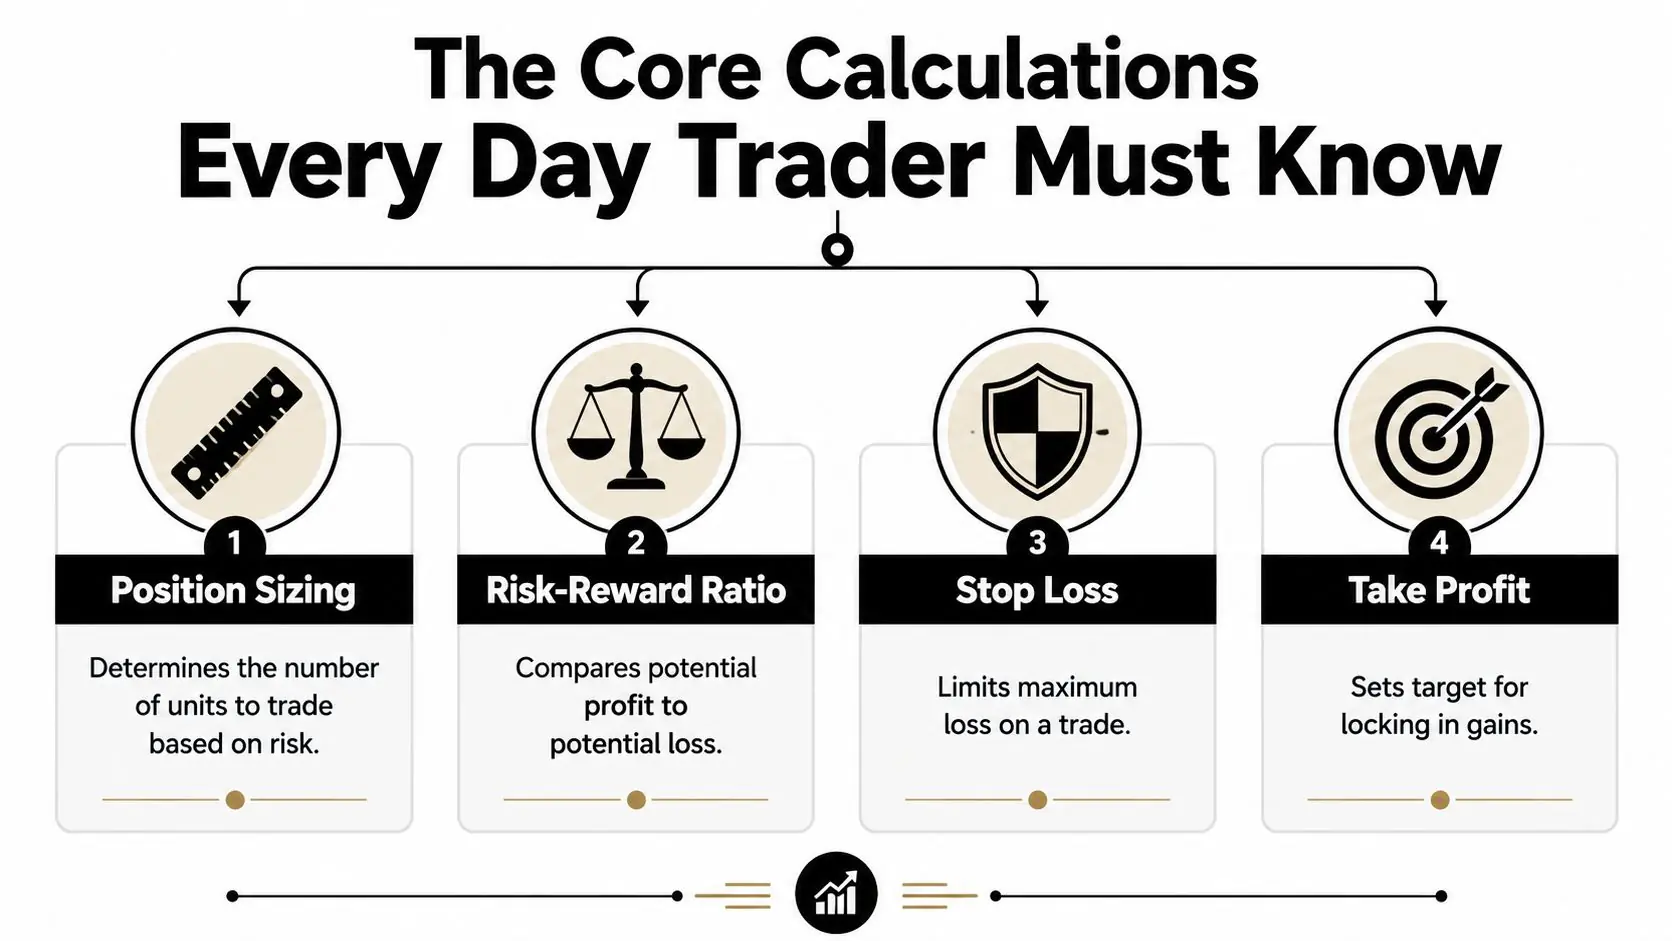
The Core Calculations Every Day Trader Must Know
Trading off gut feel is expensive. The whole point of a Day Trade Calculator is to force discipline before you place the order.
At minimum, your calculator needs to answer four questions:
- How much am I risking on this trade
- How large can the position be
- What is the reward relative to the risk
- Does this strategy have positive expectancy over time
Start with expectancy, not excitement
A functional day trade calculator is built on the expectancy formula. Expectancy = (Win% × Avg Win) – (Loss% × Avg Loss), which is what tells you whether a strategy is mathematically worth trading over the long run, as explained in this trading expectancy breakdown.
That formula matters because a setup can look clean on the chart and still be a losing business model.
Practical rule: If you can't estimate your win rate, average win, and average loss from actual trading data, your calculator output is just a fantasy with better formatting.
The four calculations that actually matter
Here's the core framework I'd use before any intraday entry:
| Calculation | What it tells you | Core formula |
|---|---|---|
| Position sizing | How much you can trade without breaking your risk cap | Position size = Risk per trade ÷ Stop distance |
| Risk-reward ratio | Whether the trade pays enough when right | Reward ÷ Risk |
| Profit and loss | Net result of the trade after price movement | PL = (XP – EP) × TS – CF |
| Expectancy | Whether the system works over many trades | (Win% × Avg Win) – (Loss% × Avg Loss) |
The profit and loss formula above is standard calculator logic. PL = (XP – EP) × TS – CF, where PL is profit or loss, XP is exit price, EP is entry price, TS is trade size, and CF is commission fees, as laid out in this trading calculator reference.
Position size comes from the stop, not from confidence
Newer traders usually reverse the process. They choose a big size first, then place a stop where the loss happens to fit. That's backward.
The correct order is:
- Define the invalidation point
- Measure the stop distance
- Set the dollar risk
- Calculate the position size from that risk
If your stop needs to be wider because the market is moving fast, your size must get smaller. The calculator keeps your risk stable even when volatility changes.
A lot of traders also need to tighten up their risk-reward thinking. If that part still feels loose, review how to calculate risk reward ratio before building trade plans around target projections.
Margin matters, but survival matters more
Margin tells you whether you can open the trade. Risk tells you whether you should.
That distinction matters because enhanced buying capacity can make a position look affordable while still making it reckless. A calculator should show both:
- Notional exposure
- Margin used
- Dollar risk to stop
- Target profit at take profit
Your broker platform may approve the order. That doesn't mean the trade fits your plan.
A quick checklist before every order
- Risk first Decide the maximum acceptable loss before looking at profit.
- Size second Let stop distance determine your quantity.
- Costs included Commissions belong in the math, not in the post-trade excuse.
- Expectancy tested One winning trade proves nothing. A sample of trades tells the truth.
That's the foundation. Without it, a day trade calculator is just a P/L toy.
Calculating Your Forex and Indices Trade
The formulas get real when you apply them to an actual setup. Forex and indices both use the same decision logic, but the contract behavior and price movement feel different in practice.
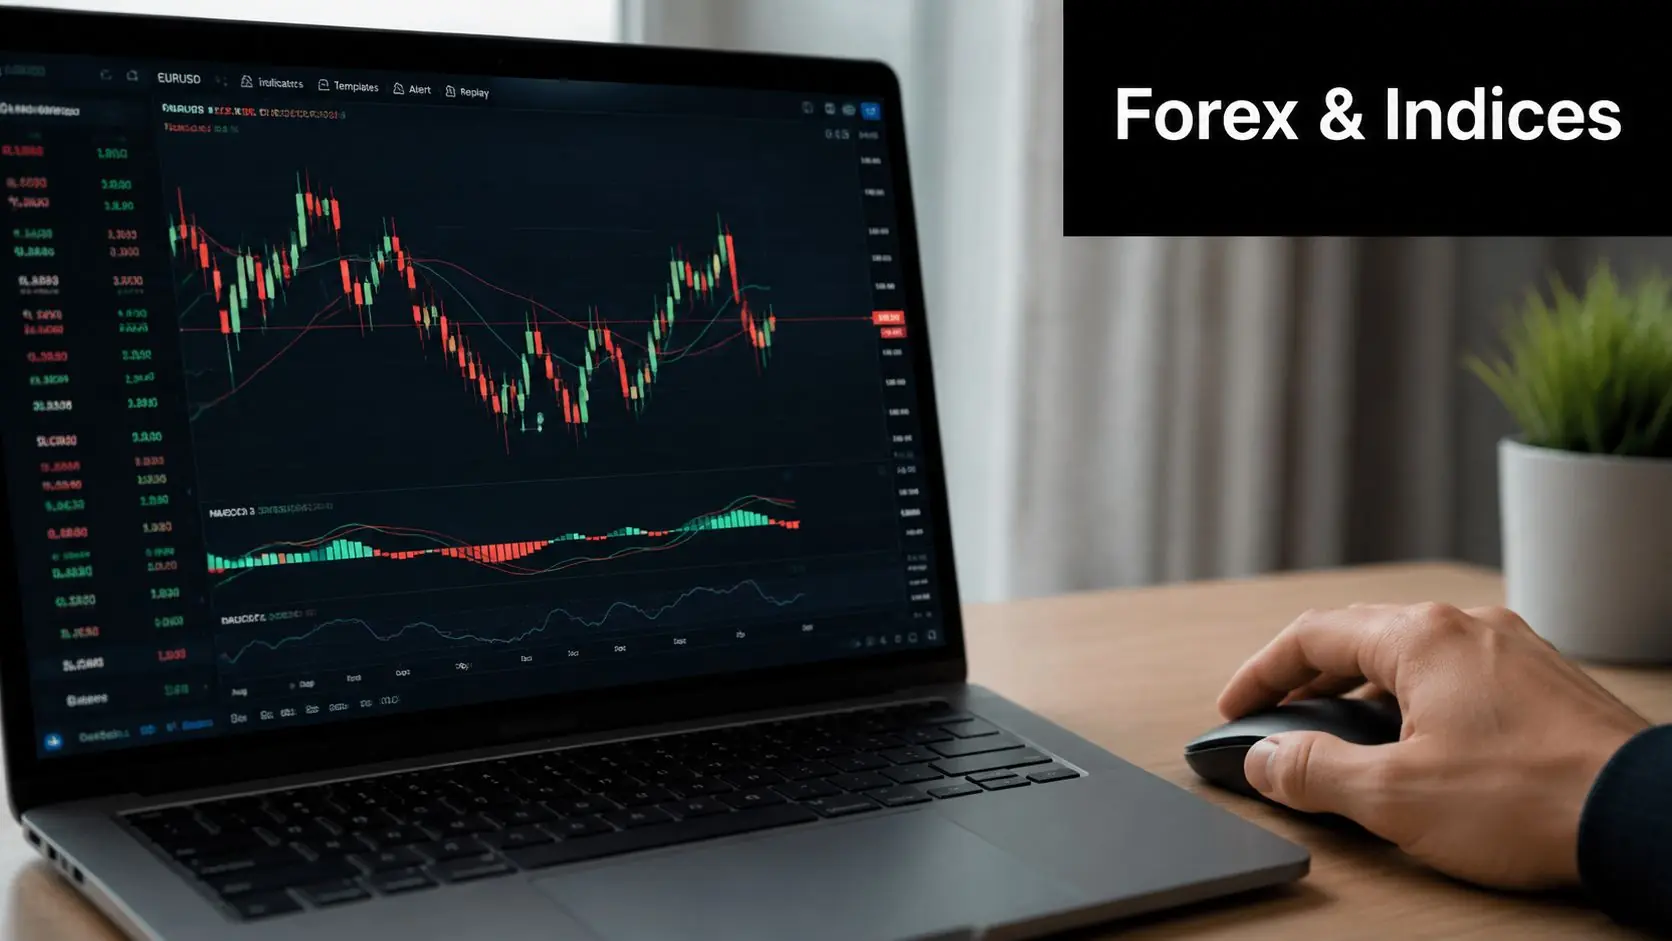
A forex example on EURUSD
Say you've marked out a clean intraday level on EURUSD. Before you even think about entry, your calculator should ask for the standard inputs.
Core inputs for a day trading profit/loss calculator are risk per trade in dollars, risk-reward ratio, expected hit-rate, and number of trades. Day traders commonly target RRRs from 1:1 to 1:3, as summarized in this day trading calculator guide.
A simple workflow looks like this:
- Pick the entry
- Place the stop where the setup fails
- Measure the distance between entry and stop
- Set the dollar risk
- Project the take-profit using your chosen risk-reward ratio
That's where a dedicated lot size calculator for trade sizing helps. You enter the stop distance and risk amount, then let the calculator translate that into a usable position size.
What the calculator is really doing
For forex, the position size adjusts around the stop distance. If the stop is tight, the size can be larger. If the stop is wide, the size has to shrink to keep risk constant.
That matters more than being “right” on direction. A trader who sizes correctly can survive a string of losers. A trader who sizes on emotion can't.
A clean chart setup doesn't justify oversized risk. The stop location and the risk budget decide size. Nothing else should.
An index example on US30
Indices usually force traders to pay more attention to contract value and tick movement. The process is the same, but the instrument feels faster because a small chart move can represent a meaningful P/L swing.
With US30, I'd still use the same sequence:
| Step | Forex trade | Index trade |
|---|---|---|
| Entry | At planned price level | At planned price level |
| Stop | Based on invalidation | Based on invalidation |
| Risk | Fixed dollar amount | Fixed dollar amount |
| Target | Set by RRR | Set by RRR |
| Size | Adjusted from stop distance | Adjusted from stop distance and contract behavior |
The trap with indices is psychological. Traders see fast movement and start moving the stop, widening the loss, or taking profit too early. The calculator doesn't stop you from doing that, but it exposes the original plan clearly enough that breaking it becomes a conscious mistake.
What works and what doesn't
What works:
- Pre-calculating the stop and target before entry
- Using the same risk process across instruments
- Reducing size when volatility expands
What doesn't:
- Sizing larger because the setup “looks strong”
- Using the same size across every market
- Ignoring how many trades you plan to take in the session
Forex and indices reward the same habit. Consistent pre-trade math.
A Crypto Day Trading Calculator Example
Crypto traders usually learn one lesson fast. Volatility changes everything.
A crypto setup can move enough in a short period to make a normal-looking stop completely unrealistic. That means the calculator isn't just helping with position size. It's helping you avoid using a stop that has no relationship to actual market movement.
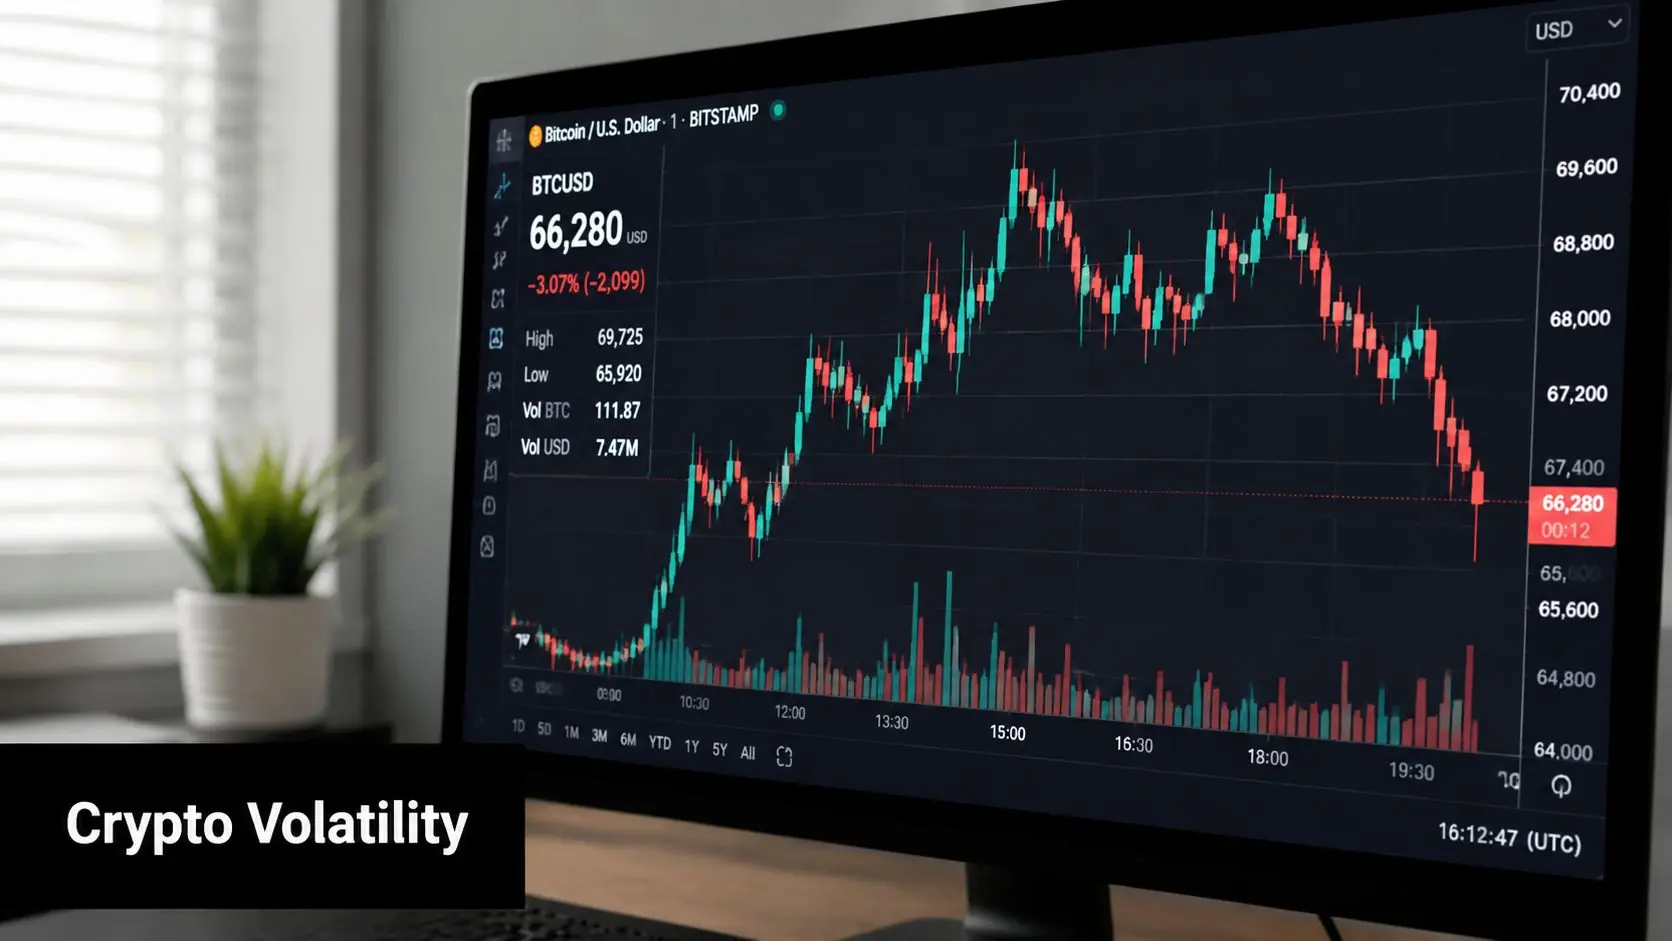
A practical BTCUSD workflow
Take a BTCUSD intraday trade plan. You identify an entry area, define where the idea is invalid, and then measure the distance to the stop.
From there, the calculator should help you answer:
- How much capital am I willing to risk
- How much BTC exposure fits that risk
- Where does the take-profit sit if I want a sensible reward relative to the stop
- Do fees or funding make this plan worse if I hold longer than intended
Crypto traders often make the same mistake forex traders make, but faster. They keep the size too large while widening the stop to account for volatility. That combination destroys consistency.
Why crypto needs extra caution
The setup may look great on the chart and still be poor in execution terms if the market is moving erratically. In crypto, I'd rather reduce size aggressively than force a tight stop into a noisy tape.
A good routine is:
- Scan for the cleanest structure first
- Choose the invalidation point
- Calculate size only after the stop is fixed
- Review whether the trade still makes sense after fees and spread
- Skip the trade if the required size becomes too small to justify the complexity
If you're trying to improve the quality of the setups entering your calculator in the first place, it helps to optimize your crypto screener workflow so you're filtering for cleaner instruments and better structure before the risk math starts.
What a calculator won't do for you
A calculator won't solve poor trade selection. It won't tell you whether Bitcoin is about to trend or chop. It only tells you whether the trade fits your rules once you've defined the idea.
Crypto volatility punishes lazy sizing. If the stop has to be wider, the position has to get smaller. There isn't a workaround for that.
The traders who last in crypto tend to use a day trade calculator as a filter. If the numbers don't fit, they don't force the trade.
Factoring In Leverage Fees and Slippage
A trade can look clean in the calculator and still be a bad trade once real execution hits. The spread is wider than expected, the fill comes late, the commission is higher than you penciled in, and a setup that looked acceptable on paper no longer clears your minimum reward.
That gap matters even more in a prop environment. On a personal account, sloppy execution just hurts performance. On a funded account, it also burns through limited daily loss room.
The cost problem traders misprice
Research summarized in this review of day trading studies notes that 97% of day traders lose money, with transaction costs and market frictions playing a major role. In live trading, those frictions add up fast. The same review of day trading studies also cites evidence that ignoring slippage and spread can materially reduce a strategy's theoretical edge.
The practical takeaway is simple. If your calculator only works with perfect fills, the trade idea is weaker than it looks.
I treat every planned trade as two numbers. The chart-based idea, and the executable idea. The second number is the one that matters.
Using borrowed capital changes exposure, not risk discipline
Using borrowed capital lets traders control a larger position with less margin posted. That creates a common mistake. The position feels small because the margin requirement is small, even though the dollar loss at the stop is still too large.
That is how traders break rules without realizing it.
Separate these two questions before every order:
| Question | What it checks |
|---|---|
| Can I open this position | Available margin |
| Should I open this position | Dollar risk at stop, plus trading costs |
If your process still assumes ideal fills, review how slippage affects trade execution in live markets before trusting a backtest or a basic P/L tool.
What to subtract before the trade is valid
A usable day trade calculator should include more than entry, stop, and target. It should also account for the costs that decide whether the setup still makes sense after the order is sent.
Subtract these before approving the trade:
- Commission Reduces net reward and shifts your real break-even level.
- Spread Creates immediate friction on entry and exit.
- Slippage In fast conditions, your actual fill can be worse than the planned price.
- Holding costs If the trade runs longer than planned, financing or rollover charges may matter depending on the instrument.
Newer funded traders often get caught. They risk the correct amount in theory, but then lose more than planned in practice because the fill and spread were worse than the calculator assumed.
A quick survival check
I use a simple filter before sending size:
- Start with the gross setup. Is the reward attractive before costs?
- Subtract execution friction. Does the trade still clear your minimum reward after spread, commission, and likely fill quality?
- Check market conditions. News, low liquidity, and fast tape increase execution error.
- Measure the rule impact. If the extra friction turns a normal loss into a larger hit on your daily limit, size down or pass.
A generic calculator asks, "What do I make if this works?" A trader trying to stay funded asks, "What does this cost me if execution is worse than planned?" That second question keeps accounts alive.
Applying Calculations to Prop Firm Rules
The trader is down two trades before lunch, still likes the next setup, and has no clear answer to one question: can this account absorb another full loss without breaking the firm's daily rule? That is the calculation that matters in a funded account.
A generic P/L calculator helps with trade planning. A prop firm calculator has a different job. It has to convert the firm's rules into hard limits you can act on before the first order goes out.
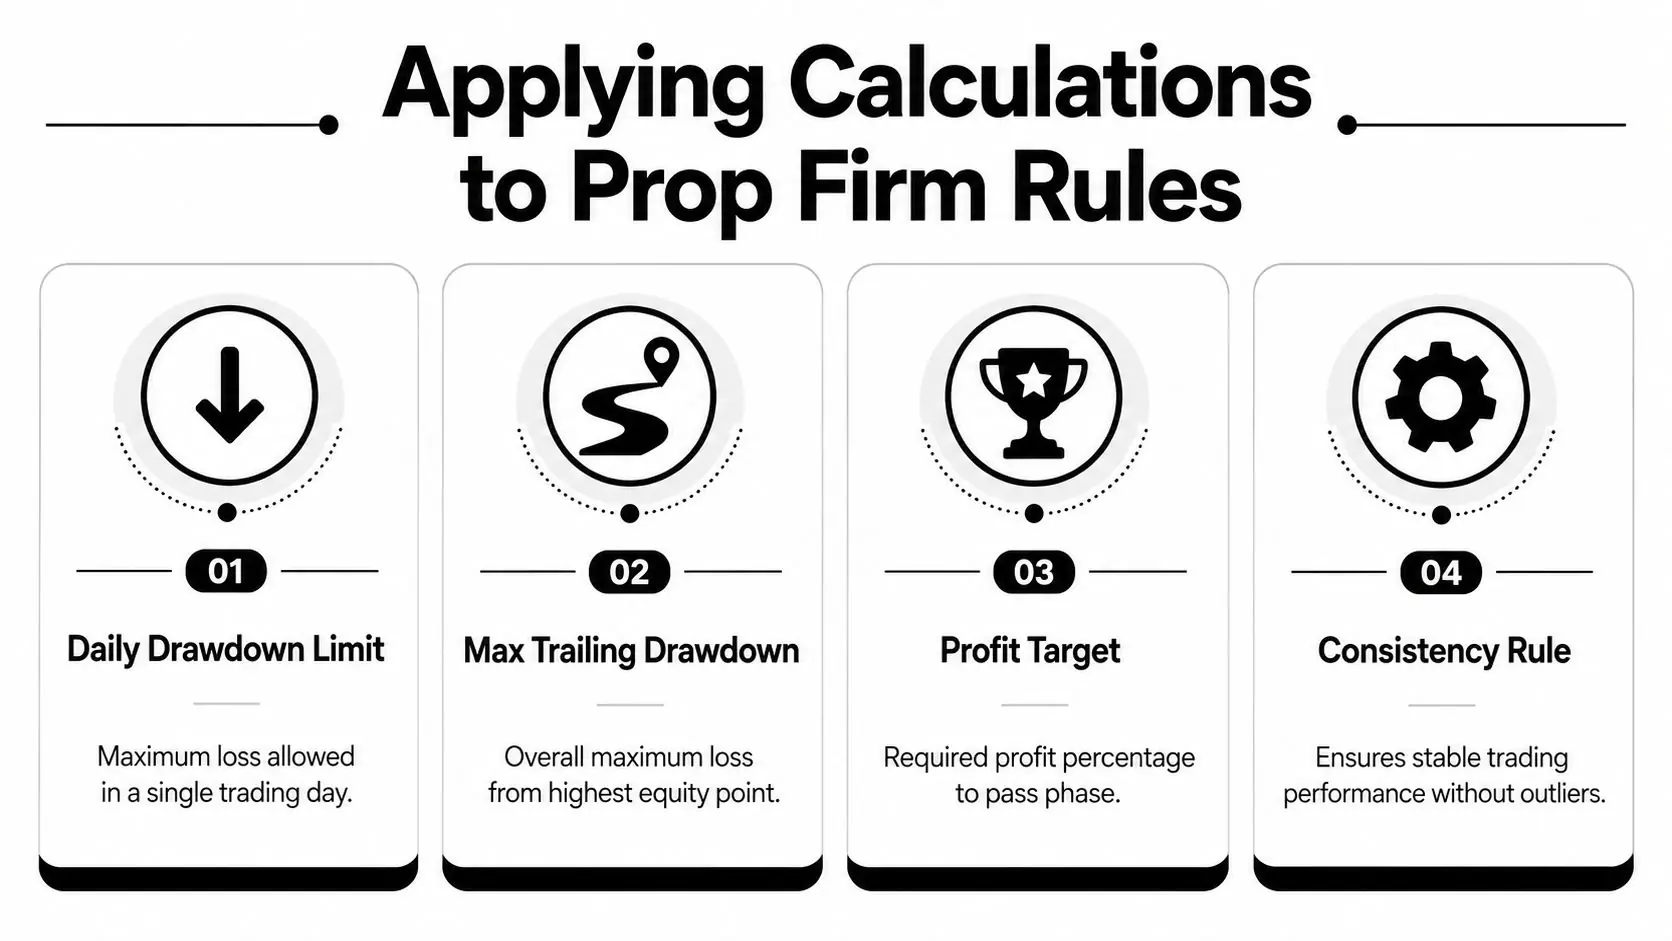
Turn firm rules into hard numbers
Before the session starts, the calculator should give you three numbers:
- Hard dollar stop for the day
- Maximum number of full-risk losses
- A profit cutoff where you stop pressing and protect the session
The formulas are simple. Daily Max Loss ($) = Account Size × Daily Risk %, Max Position Count = Daily Max Loss ($) ÷ Per-Trade Risk ($), and Daily Profit Target = Account Size × Target %, as shown in this trading plan calculator explanation.
Those numbers turn vague discipline into a rule set.
A concrete example of hard-stop thinking
Take a $25,000 account with a 2% daily loss limit. The hard stop for the session is $500. If your standard risk is $125 per trade, you have room for four full losses. If you risk $250 per trade, you only get two.
That trade-off matters more than the reward target on any single setup.
New funded traders often focus on finding a high-R trade and ignore loss capacity. In a prop environment, loss capacity decides whether you stay in the game long enough for your edge to show up. If your model regularly starts with one or two losses before catching a winner, oversized risk can violate the rule before the good trades arrive.
Why this matters more in funded trading
A self-funded trader can choose to absorb a rough day and keep trading tomorrow. A funded trader still has to be right on the risk math today.
That changes how the calculator should be used.
| Priority | Self-funded mindset | Prop-style mindset |
|---|---|---|
| Primary focus | Grow account | Stay within rules while growing account |
| Bad day response | Keep trading, then review later | Stop at the hard daily limit |
| Trade count | Flexible | Capped by daily loss budget |
| Winning day behavior | Keep hunting setups | Protect gains once discipline starts to slip |
The practical point is simple. The account is not asking whether the setup looked good. The account is asking whether the next loss still fits inside the rules.
What works in practice
I treat the daily loss limit like inventory. Every trade uses part of it. Once too much of that inventory is gone, the only smart choices are to cut size or stop.
These are the pre-session checks that hold up in real trading:
- Write down the hard daily stop in dollars
- Calculate how many full-risk losses the account can take
- Decide in advance when size gets cut after early losses
- Set a point where a solid green day is protected instead of given back
That is the difference between calculator math and prop survival math. One measures possible profit. The other tells you how many mistakes the account can survive before the firm makes the decision for you.
FAQ About Day Trading Calculations
What's the best risk percentage per trade
The best per-trade risk is the one that keeps you trading after a normal losing streak.
For a funded account, that number is usually smaller than what a self-funded trader might choose. The math starts with the account rules, not your profit target. If your daily loss cap is tight, the question is simple: how many full-stop losses can you take before the platform locks you out for the day? Once you know that number, you can set risk per trade so one sloppy stretch does not end the session early.
I prefer a size that leaves room for error. If two losses in a row put the account under pressure, size is too big.
How should I adjust my calculations during volatile news
Handle news like a separate trading condition. The spread often widens, fills get worse, and the stop distance that worked an hour earlier may no longer match the market.
Two responses make sense:
- Cut position size
- Widen the stop only if the smaller size still fits your daily loss budget
- Skip the trade and wait for cleaner conditions
What fails in funded trading is using normal size in abnormal conditions. A calculator only helps if the inputs match the market you are trading.
Can a day trade calculator guarantee profits
No.
A calculator helps you plan entry, stop, target, and size. It does not predict direction, improve discipline, or prevent a bad fill. Good math can still be ruined by late entries, hesitation, revenge trading, or ignoring the daily stop.
Why do many calculators still fall short for funded traders
Most of them only estimate profit or loss on a single trade. That is incomplete for prop firm trading.
A funded trader needs survival math. How many losses at full size can the account absorb today? How much size needs to come off after the first red trade? At what point should you stop trading to avoid clipping the daily limit? Generic calculators rarely answer those questions.
As noted in this overview of day trade calculator limitations, many calculators stop at basic P/L estimates and do not account for prop-style drawdown rules. That gap matters because a funded account is judged by rule compliance as much as trade quality.
Trading involves risk of loss. This content is educational only and isn't financial advice.
If you want to apply this math inside a real prop-style environment, explore MyFundedCapital to compare funding programs, review account types, and start a challenge with clear risk parameters built around disciplined trading.