

You're up on the week, but your account is sitting well below the high it printed on Tuesday, and you're not sure which number decides whether you're close to a limit. You'll learn how to calculate drawdown in dollars and percent, how running drawdown differs from maximum drawdown, and which base a daily or trailing rule uses.
Drawdown Formulas You Can Use Today
Profit on the week can still hide a drop from the account high. An account can be above its deposit and still be deep in drawdown from its peak, so you need four separate numbers, and each one starts from a named base.
Drawdown is the decline from a previous peak to a later trough. It isn't measured from your original deposit.
The Two Basic Formulas
Absolute drawdown = Peak − Trough
Percentage drawdown = ((Peak Value − Trough Value) ÷ Peak Value) × 100
The Straits Financial drawdown management guide uses an account that rises to $100,000 and later falls to $80,000, giving (($100,000 − $80,000) ÷ $100,000) × 100 = 20%. The dollar result is $20,000.
Name the base before you divide. In that example, the base is $100,000, the highest recorded value before the decline. If you'd started with $90,000, grown to $100,000, then fallen to $80,000, you don't divide by $90,000. That would give you a different percentage and hide the loss from the actual peak.
| Metric | Formula | Example result |
|---|---|---|
| Absolute drawdown | Peak − Trough | $100,000 − $80,000 = $20,000 |
| Percentage drawdown | ((Peak − Trough) ÷ Peak) × 100 | 20% |
| Maximum drawdown | Largest peak-to-trough percent in the stated window | 12%, not the sum of separate 6%, 4%, and 12% drops |
| Running drawdown | (Current high-water mark − latest value) ÷ current high-water mark | Updates at every new equity reading |
Running drawdown answers a live question, how far are you below the current high-water mark right now. Maximum drawdown answers a historical question, what's the single largest peak-to-trough decline in the window you named. They aren't interchangeable, and the window matters because changing the start or end date can change which decline is largest.
What the Number Can't Tell You
There's no universal percentage that's acceptable for every strategy. Liquidity, asset mix, investment horizon, and your risk capacity all change what you can tolerate, and a historical drawdown doesn't set a limit on future loss.
Treat drawdown as a control you check before you trade, not as a forecast that future losses will stop at the same level.
Trading involves risk of loss, and this material is educational only, not financial advice. For the companion formulas you'll use alongside drawdown, see our risk management formulas reference. Before you move on, take one equity series from your own journal and compute both the dollar and percent result for its worst peak-to-trough drop.
How to Calculate Drawdown From an Equity Curve
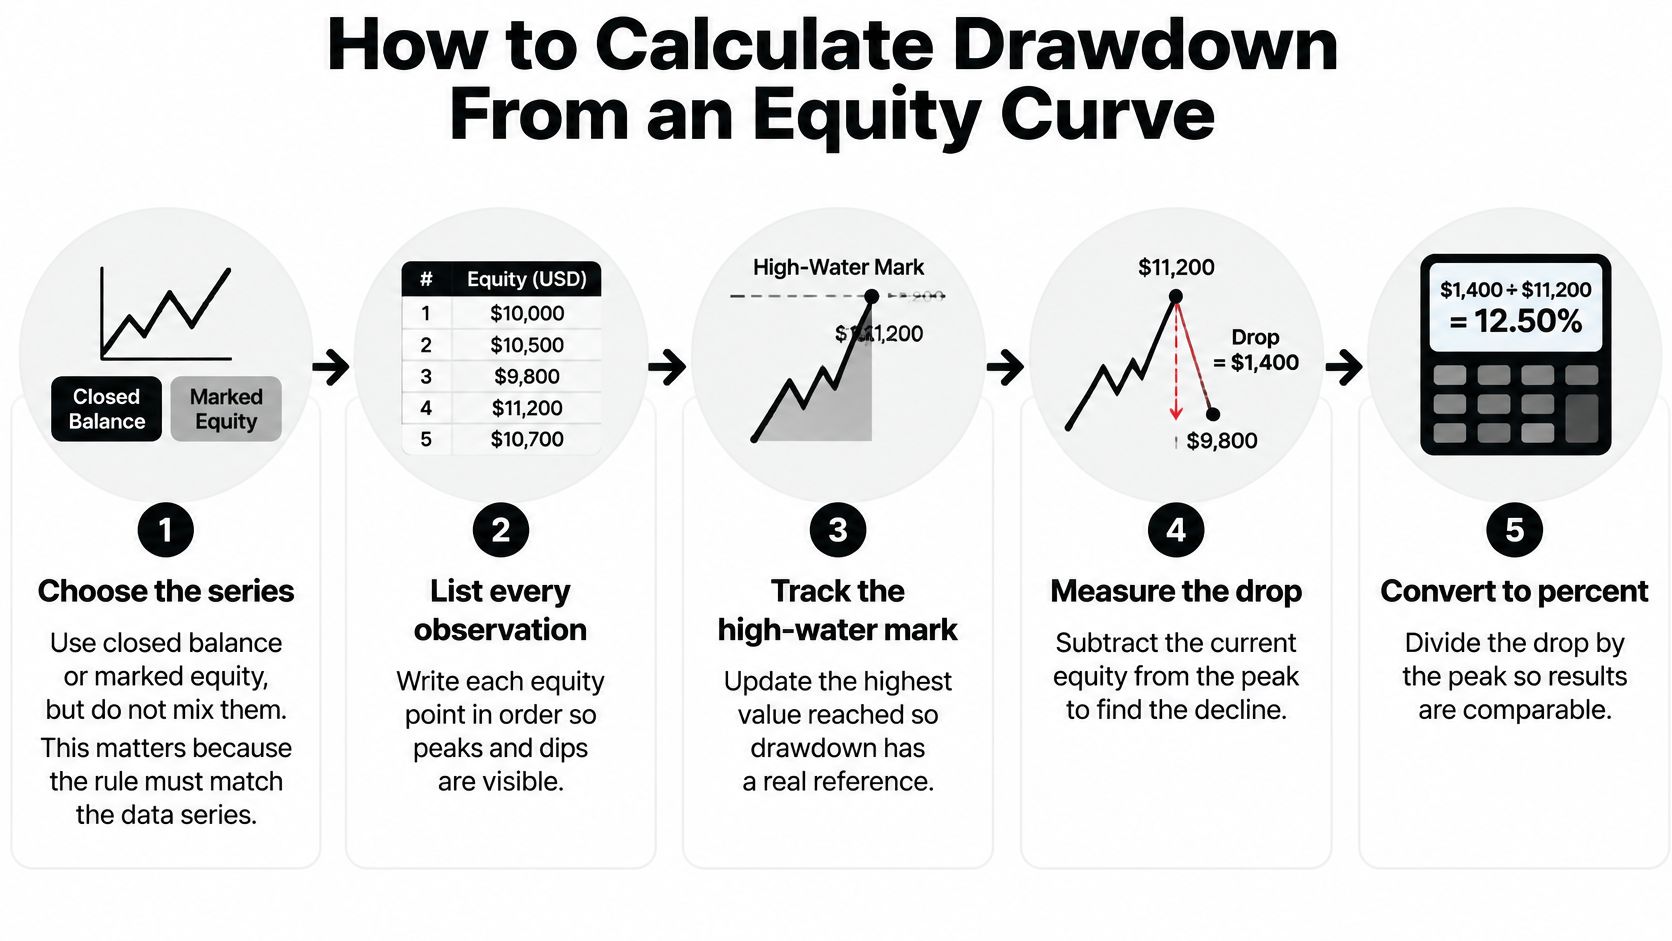
Suppose your account starts at $100,000, rises to $112,000, then falls to $107,520. The drawdown is measured from the peak of $112,000, not from the starting balance or the previous day's close. Keeping those bases separate makes the equity-curve calculation clear.
The Seven-Step Workflow
- Choose the series the rule uses: Use closed balance or marked equity, and keep the choice consistent. Marked equity includes open positions, while closed balance does not, so the two series can show different drawdowns.
- List every observation in time order: Record each value with its date. This keeps peaks, troughs, and recoveries in sequence.
- Set the high-water mark: Begin with the first value. Replace it only when a later value is higher; that running peak becomes the base for subsequent calculations.
- Compute the dollar drop at each row: Subtract the current value from the high-water mark. At a new high, record zero.
- Convert dollars to percent: Divide the dollar drop by the same high-water mark, then multiply by 100. For example, a $4,480 decline from $112,000 is 4%.
- Read running drawdown from the latest row: The latest percentage shows the current distance below the high-water mark. It can shrink during a recovery, even though the earlier trough remains in the record.
- Find maximum drawdown from the whole column: Select the largest peak-to-trough percentage in the chosen window. Do not add separate declines together.
The calculation depends on the series you choose and the order of its values. You can use an equity curve simulator to explore how different sequences of gains and losses affect the curve.
Why the Maximum Isn't a Sum
Say an equity curve falls 6% from one peak, recovers, later falls 4%, and then declines 12% from a newer peak. The CFA Institute discussion of maximum drawdown describes the measure as the decline from a local high to a subsequent local low over the period being analyzed. In this example, maximum drawdown is 12%, the largest single peak-to-trough decline, not 22%.
Record the start and end dates alongside the result. Changing the measurement window can change which peak-to-trough decline is largest.
Write down three details: running drawdown now, maximum drawdown in the named window, and the dates of that maximum's peak and trough.
Together, these details distinguish a current decline from the worst decline in the selected history, including one that has already recovered.
A Spreadsheet Example With Real Numbers
Build this seven-row sheet once and you can paste any account history into it. The columns are day, equity, high-water mark, drawdown in dollars, and drawdown in percent.
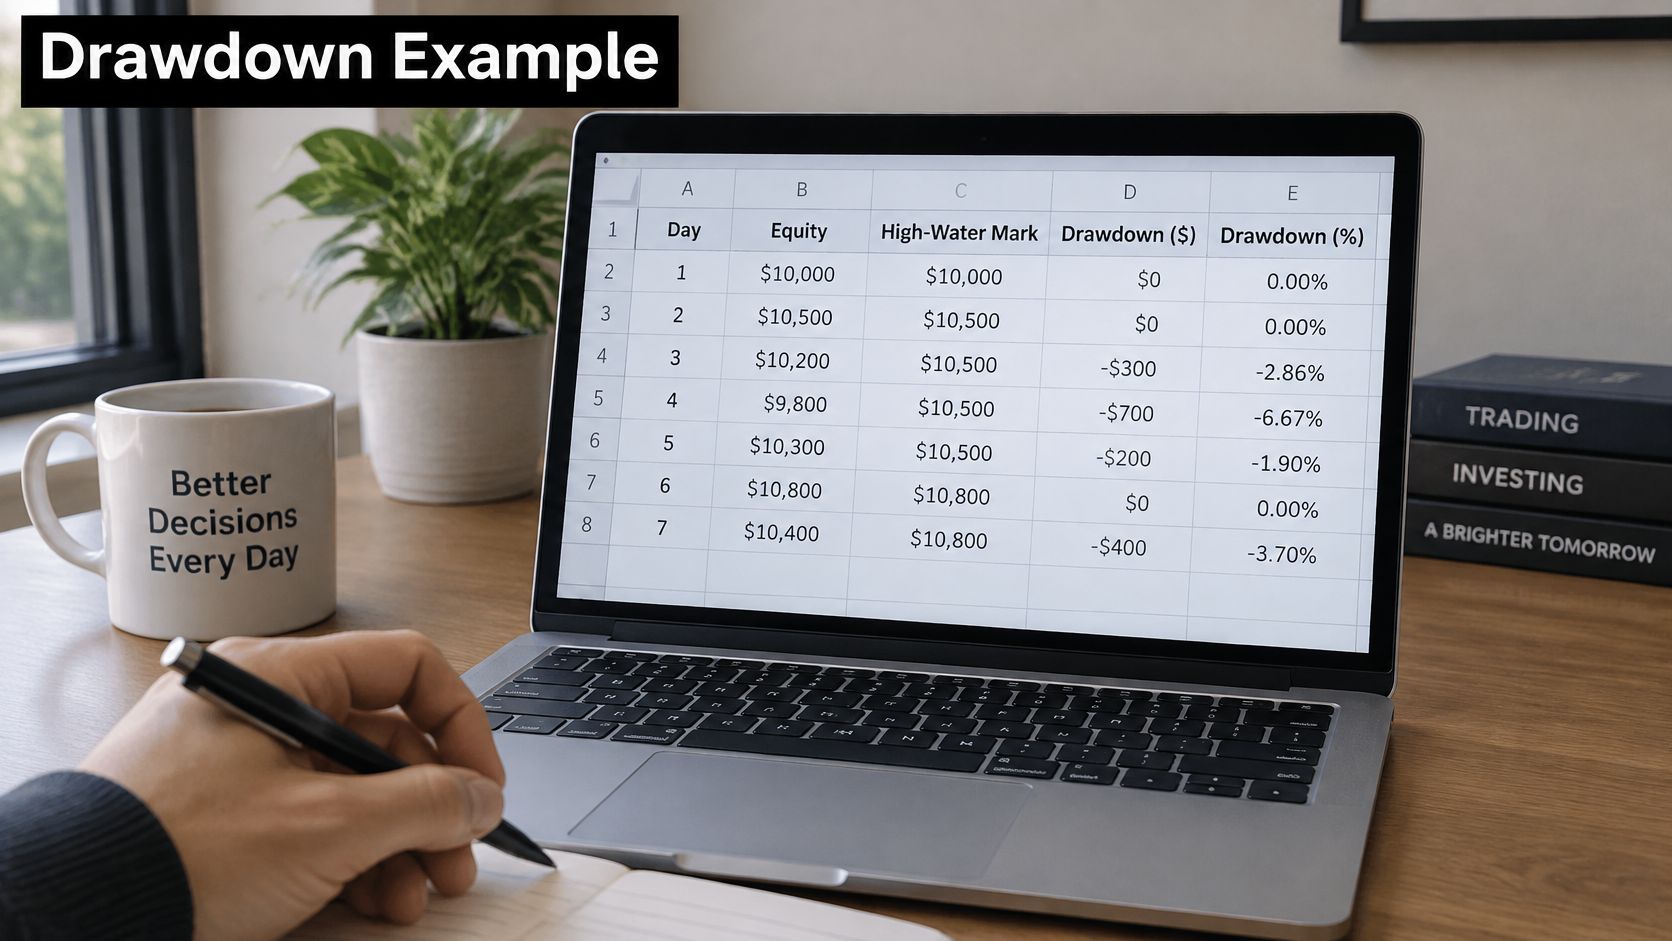
| Day | Equity | High-water mark | Drawdown $ | Drawdown % |
|---|---|---|---|---|
| 1 | $100,000 | $100,000 | $0 | 0% |
| 2 | $108,000 | $108,000 | $0 | 0% |
| 3 | $101,520 | $108,000 | $6,480 | 6% |
| 4 | $112,000 | $112,000 | $0 | 0% |
| 5 | $107,520 | $112,000 | $4,480 | 4% |
| 6 | $125,000 | $125,000 | $0 | 0% |
| 7 | $110,000 | $125,000 | $15,000 | 12% |
Reading the Seven Rows
Day 2 sets a new high at $108,000. Day 3 falls to $101,520, so the drop is $108,000 − $101,520 = $6,480, and $6,480 ÷ $108,000 = 6%.
Day 4 reaches $112,000. Running drawdown returns to zero, but that earlier 6% episode stays in your history and still counts when you look for the maximum over the whole window.
Day 5 falls to $107,520 from the $112,000 peak. That's $4,480, or 4%, measured from $112,000, not from the $100,000 you started with. Day 6 then prints $125,000, and day 7 falls to $110,000, which is $15,000 and 12% from $125,000.
The maximum in this window is 12% on day 7. It isn't 22%, because you don't add 6, 4, and 12. Each of those declines started from a different peak and two of them fully recovered in between.
The Three Spreadsheet Formulas
- High-water mark The maximum of equity from the first row through the current row, so the mark can stay flat or rise, but it never falls.
- Dollar drawdown That high-water mark minus the current equity, which gives you the size of the decline in account currency.
- Percent drawdown Dollar drawdown divided by the high-water mark, keeping the peak as the base on every row.
Add a MAX of the percent column to get the period maximum, 12% here. Read the last row for running drawdown, also 12% in this example because the day 7 drop is still open.
If you also track closed balance, add a second pair of columns rather than averaging the two series. Averaging equity and balance produces a number that matches neither rule.
Check the sheet before you trust it. The percent column shouldn't be negative in this sign convention, the high-water mark should never fall, and shortening the window to days 1 to 5 should change the maximum to 6% instead of 12%. If that window check doesn't change the answer, your MAX formula is reading the wrong range.
How Long a Drawdown Lasts
Depth tells you how much capital you lost from the peak. Duration tells you how long that capital stayed impaired, and those are different risks.
Two strategies can both show a 10% maximum drawdown and still behave very differently if one recovers in two weeks and the other remains below its prior peak for a year. The CFA Institute refresher reading on active equity portfolio construction identifies drawdown duration alongside maximum drawdown as a performance-evaluation measure, while drawdown itself is a portfolio loss from its high point until recovery begins.
Counting Duration Consistently
- Record the start The date equity first falls below the previous high-water mark.
- Record the trough The trough date and the percent at that lowest point.
- Record recovery The first date equity returns to that same high-water mark, not to the starting balance or to a round number.
- Count one way Use calendar days or trading days and keep that convention for every episode, so durations stay comparable.
On the seven-day path, the day 3 drop below $108,000 ends when day 4 prints $112,000, so that episode closes quickly. The day 7 drop below $125,000 hasn't recovered by the end of the sample, so its duration is ongoing, not zero. Calling an open drawdown zero days makes it look resolved when it isn't.
Depth and time are separate risks. A shallow loss that lasts for months can be a worse fit for a short-horizon trader than a deeper loss that recovers quickly.
Store six fields for every episode, peak equity, trough equity, percent, start date, trough date, and recovery date. That record lets you separate how far the account fell from how long it stayed down, and it shows whether the strategy's recovery pattern fits the horizon you're trading. Don't set a universal maximum number of days that's supposed to be safe for every strategy, because a swing system and a day trading system don't recover on the same clock.
Daily and Trailing Limits in Prop Firm Rules
A $100,000 account can be within its overall limit and still breach its daily limit. The reason is that each rule uses a different base: the daily limit starts from the previous day's close, while an overall limit may use the starting balance or a moving peak.
Daily drawdown Starts From the Prior Close
MyFundedCapital's maximum daily drawdown is 5% on the 1-Step and 2-Step programs, and 3% on Instant Funded and Prediction Markets. It is measured from where the account closed the previous day and resets at 17:00 New York time.
If a $100,000 account closes at $100,000 and has a 5% daily limit, the loss allowance is $5,000. The daily floor is therefore $95,000. If the account rises to $103,000 during the session, that peak does not move the floor: the base remains the previous close.
After the reset, the next day's daily calculation uses the latest previous close. A higher close can raise the next session's floor.
Overall Drawdown and the Trailing Floor
The maximum overall drawdown is 10% on the 1-Step and 2-Step, and 6% on Instant Funded and Prediction Markets. On Instant Funded and the 1-Step, the overall limit follows the best balance until it locks at the starting balance. The 2-Step limit is static.
For a $100,000 1-Step account with a 10% trailing limit, the initial floor is $90,000. If the best balance reaches $110,000, the drawdown allowance is $11,000, putting the floor at $99,000. The floor rises with new best balances until it locks at the $100,000 starting balance. A 6% trailing limit uses the same type of calculation, with a smaller percentage distance from its applicable peak.
On a $100,000 2-Step account, the 10% overall limit is static, so its floor is $90,000. It does not trail the best balance. The static and trailing drawdown rules show why these two bases produce different floors.
| Rule | Limit | Measured from | What happens next |
|---|---|---|---|
| 1-Step and 2-Step daily | 5% | Previous day close | Resets at 17:00 New York time |
| Instant Funded and Prediction Markets daily | 3% | Previous day close | Resets at 17:00 New York time |
| 1-Step overall | 10% | Best balance until it locks at the starting balance | Floor trails, then stops at the start |
| Instant Funded overall | 6% | Best balance until it locks at the starting balance | Floor trails, then stops at the start |
| 2-Step overall | 10% | Starting balance | Static floor, with no trailing adjustment |
| Prediction Markets overall | 6% | Trailing, follows the equity high | Floor follows the equity high |
A daily breach and an overall breach are separate tests. You can exceed the daily allowance while remaining above the overall floor, or breach the overall floor without exceeding that day's allowance. Treat each limit as its own boundary, calculated from its stated base.
Mistakes That Change the Drawdown Number
Five errors change your result without changing a single trade. Each one comes from picking the wrong base, the wrong series, or the wrong window.
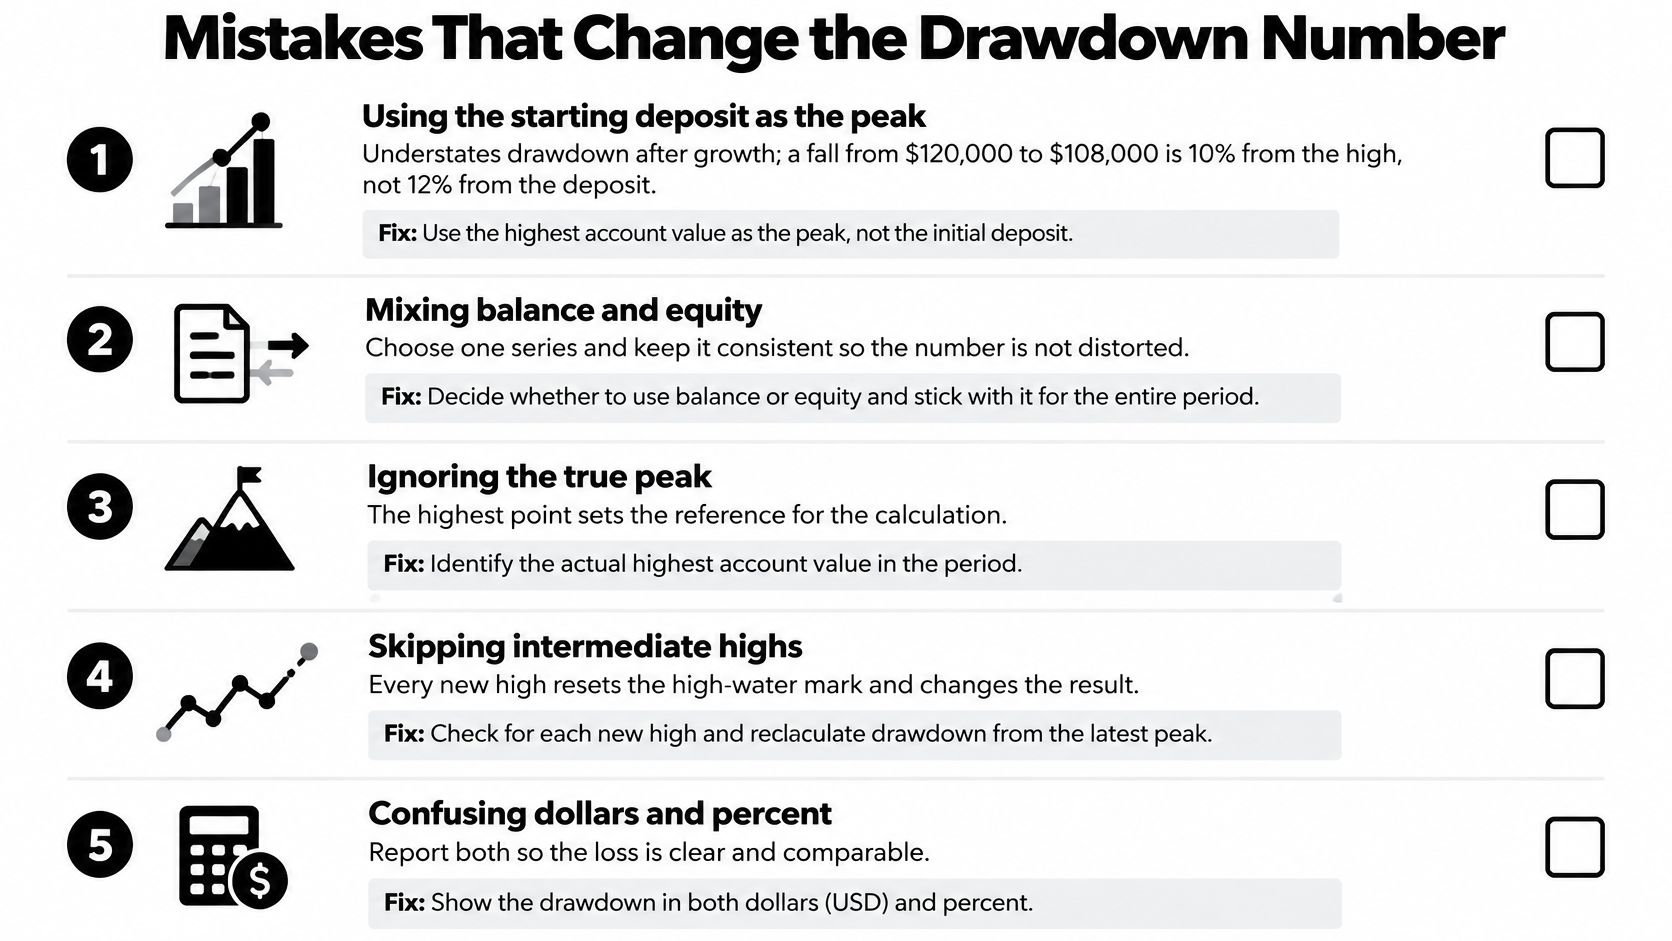
- Using the starting deposit as the peak A fall from $120,000 to $108,000 is 10% from the high, not 0% because the account is still above a $100,000 start. Fix it by dividing by the actual peak before that decline.
- Adding separate dips together Summing every decline overstates the result, since only the single worst peak-to-trough decline in your window is the maximum. Fix it by taking the largest percent, not the total.
- Mixing equity and closed balance If a rule marks open trades, closed balance hides floating loss, and if a rule uses closed balance only, equity invents a breach. Fix it by matching your series to the rule and keeping it consistent.
- Carrying yesterday's intraday low forward A daily check doesn't stay alive after the 17:00 New York time reset, so don't test today against yesterday's low. Fix it by restarting the daily test from the official prior close.
- Calling an unrecovered drop zero duration The strategy looks repaired while capital is still impaired. Fix it by reporting that episode as ongoing until equity gets back to the high-water mark.
The correction behind all five is the same. Name the base before you calculate, and write the window dates next to any maximum. If you can't name the base, the calculation isn't finished.
These checks reduce surprises, but they don't guarantee profits. Trading still involves risk of loss.
Frequently Asked Questions About Drawdown
Is Drawdown the Same as Loss From the Deposit
No. Percentage drawdown uses the peak before the drop as its base. Distance from your deposit only becomes the right measure when a rule says so, such as a static overall limit or a trail that has locked at the starting balance. Confusing those two bases is the most common reason a trader thinks they have more room than the rule allows.
Should Open Losses Count
Only if the rule marks equity. If the firm uses closed balance, floating loss doesn't count until the trade closes. You can still calculate equity drawdown privately, which is worth doing so a later close doesn't surprise you. Our Terminal shows the daily and overall loss room before a trader clicks Buy, so you can check both lines against a planned stop before you enter.
Does Maximum Drawdown Reset After a New High
No. The old maximum stays the result for that window, running drawdown returns to zero at the new high, and a trailing firm limit may move up with the new best balance. Those are three different events, and treating a new high as a clean slate erases the history you need to judge the strategy.
Compare the 1-Step, 2-Step, and Instant Funded daily and overall limits before you pay any challenge fee, and confirm each base in the published program terms. For context, the 1-Step Challenge requires a 10% profit target with no time limit and 3 minimum trading days, with account sizes from $5,000 to $100,000, and the path from sign-up to payout runs in four steps, choose a program and account size, trade to reach the program's targets, get funded and paid, then scale and keep earning. Trading involves risk of loss, and this article is educational only, not financial advice.
Now that you can work out the peak, prior close, and trailing floor on any account, put the numbers against a real program before you risk a fee. Visit MyFundedCapital to compare the 1-Step, 2-Step, and Instant Funded daily and overall limits side by side, check which base each one measures from, and pick the challenge whose lines your own drawdown history can respect.
