The most popular advice about algorithmic trading methods is to find the strategy with the strongest backtest, but that skips the harder question: can you trade it under realistic costs and account limits? The best method is the one you can test, including its signal, position sizing, execution, and failure conditions. These nine approaches solve different problems, from identifying trends to controlling order execution, while trading automation insights from Yield Seeker provide additional background on turning trading rules into automated instructions.
1. Moving Average Crossover Trend Following
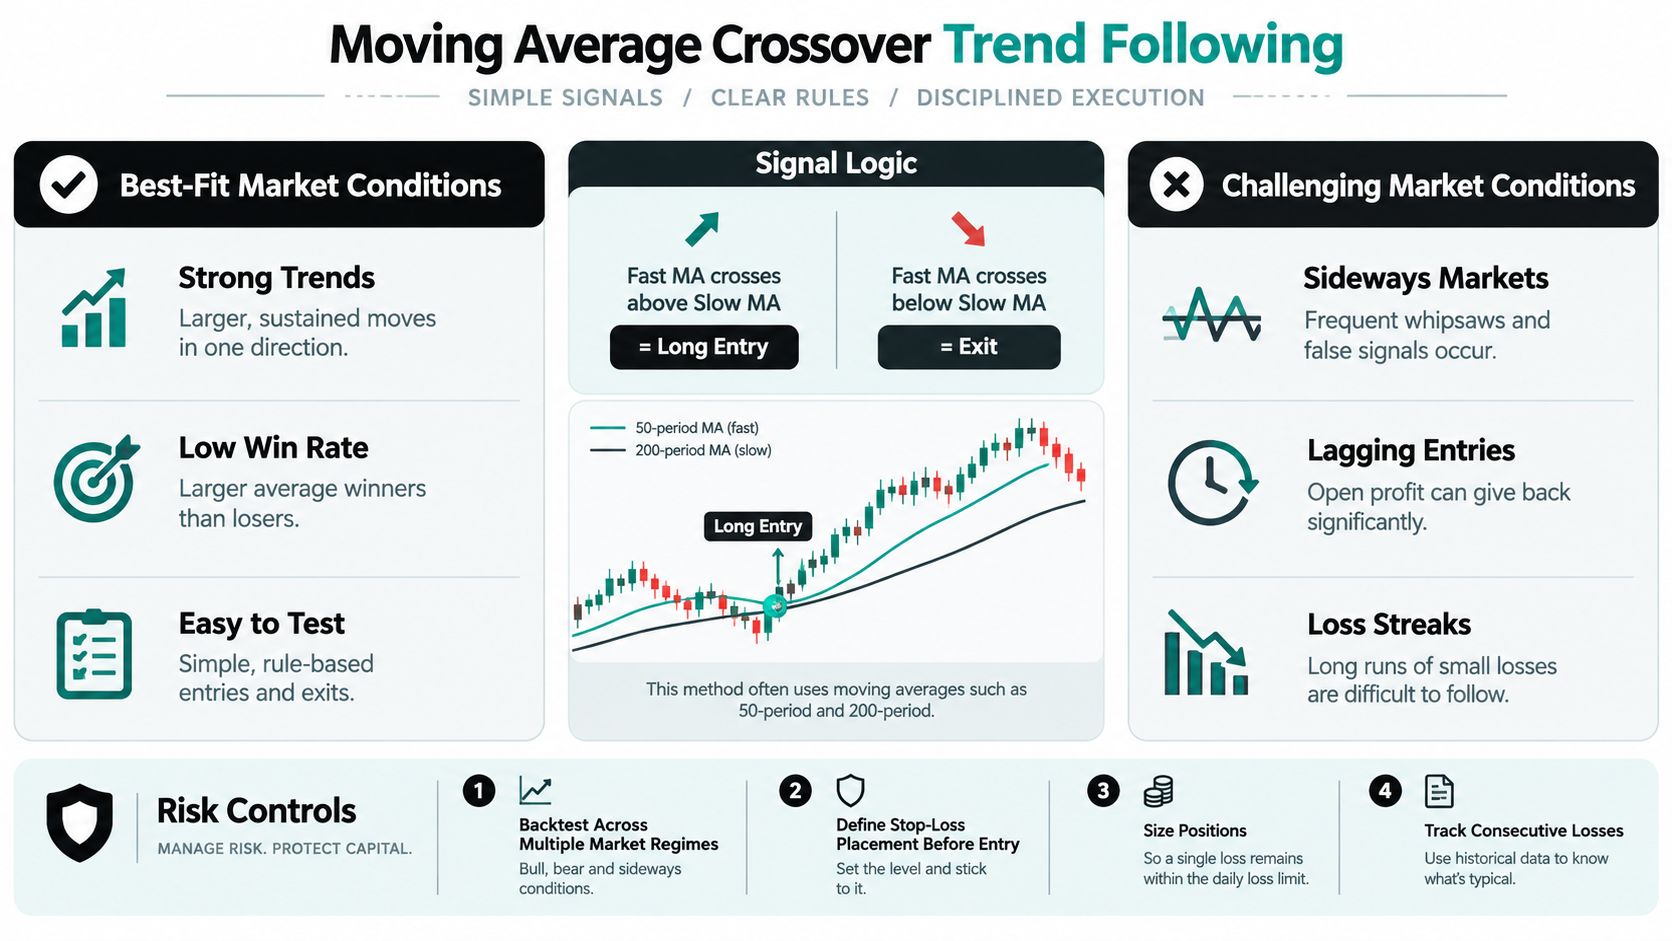
Moving average crossovers solve a direction problem. Instead of predicting the next turning point, the system waits for evidence that price is moving persistently in one direction. A faster moving average crossing above a slower average generates a long signal, while the reverse crossover can trigger an exit or short position.
For example, an EURUSD daily system could evaluate crossovers only after the daily candle closes. That distinction matters: using an unfinished candle in live trading while testing completed candles creates different strategies.
Make the Loss Rules as Clear as the Entry
The trade-off is straightforward. Waiting for confirmation means entering after a move has started, and sideways price action can produce repeated reversals without enough follow-through to cover costs.
- Define the stop first. Test a volatility-based stop or a price level that invalidates the trade, then calculate position size from that distance.
- Separate exits from reversals. Closing a long position doesn't automatically justify opening a short position.
- Budget for losing streaks. Leave room within your account limits for repeated stopped trades and worse-than-expected fills.
- Test parameter stability. Prefer a broad range of workable settings over an isolated historical optimum.
Keep this method simple enough to audit. FINRA's algorithmic-trading guidance emphasizes testing during development, before deployment, and after implementation, rather than relying solely on a historical backtest.
For a prop account, also test the path between entry and exit. A trade that eventually recovers may still breach an equity-based loss limit while it's open.
2. Mean Reversion Strategies Using Bollinger Bands and RSI
A price closing outside a Bollinger Band isn't automatically cheap or expensive. Mean reversion requires an explicit assumption that a stretched move will reverse, rather than continue into a stronger trend.
Bollinger Bands describe price relative to a moving average and recent volatility. The Relative Strength Index, or RSI, adds a momentum condition, but combining the indicators doesn't remove the need to test the underlying reversal hypothesis.

For an intraday EURUSD prototype, you might require a close below the lower band, a weak RSI reading, and then a recovery back inside the band before buying. The middle band could provide an exit reference, with a separate stop defining when the reversal assumption has failed.
Don't Confuse a High Win Rate With Controlled Risk
A reversal system can produce frequent modest gains while retaining exposure to a much larger loss. Evaluate average wins, average losses, holding time, and adverse price movement together, rather than optimizing win rate alone.
Practical rule: A mean-reversion entry needs an invalidation point. Being farther from the average isn't, by itself, a reason to increase exposure.
Test a trend filter, but measure what it removes as well as what it saves. A filter may reduce damaging countertrend entries while also excluding profitable reversals.
Transaction costs deserve particular attention when the target is close to entry. Compare results by session and spread conditions, and don't average down unless the entire position basket has a predefined exposure ceiling and stop. For a funded account, an uncontrolled basket can turn an ordinary losing idea into an account-rule breach.
3. Opening Range Breakout (ORB) Algorithms
Opening range breakout algorithms solve a timing problem: they restrict trading decisions to a defined session and price range. The system records the opening high and low, then looks for a breakout after the observation window ends.
An S&P index-futures prototype might buy above the opening high and place its initial stop near the opposite boundary. A GBPUSD version could use the London session instead, with a separate deadline for closing positions.
The exact opening window is a parameter to investigate, not a universal setting. Broker server time, exchange time, daylight-saving changes, and holidays must all resolve to the intended session.
Treat the Breakout as an Execution Test
The difficult part isn't identifying the range. It's determining whether the breakout remains attractive after the order reaches the market.
- Filter unsuitable ranges. An exceptionally narrow range can create oversized positions if sizing depends only on stop distance.
- Cap order size independently. A technically valid stop shouldn't override maximum exposure.
- Limit repeat attempts. Define whether the system may re-enter after a failed breakout.
- Record entry slippage. Keep breakout fills separate from ordinary fills when reviewing execution quality.
Research on realistic market-microstructure validation identifies changing spreads, order-book dynamics, price impact, and episodic liquidity shortages as material testing challenges. Those frictions are especially relevant when your entry depends on crossing a price level during a fast move.
For prop-account use, add an account-wide daily stop rather than relying only on individual trade stops. Include open losses and pending orders when deciding whether another breakout attempt is permitted.
4. Time-Series Momentum Strategies
Time-series momentum asks whether an instrument's own past return supports taking directional exposure. It differs from cross-sectional momentum, which ranks instruments against one another.
A simple index strategy could hold long exposure when its trailing return is positive and move flat when that return becomes negative. Allowing short positions introduces another decision that should be tested separately, rather than assumed to improve the system.
This approach overlaps with moving-average trend following, but the signal is expressed through past returns rather than a crossover. Keep that distinction clear when comparing methods: different-looking indicators can still produce substantially similar positions.
Size the Portfolio, Not Just the Signal
A practical prototype should specify its lookback, rebalance schedule, volatility estimate, and maximum exposure. The algorithmic trading strategy guide provides further context for connecting these rules into a complete trading process.
- Use volatility-aware sizing. Reduce exposure when estimated volatility rises, while imposing a separate position size limit.
- Rebalance deliberately. Avoid changing position size on every minor movement in the risk estimate.
- Measure shared exposure. Several index positions may express much the same directional view.
- Use an honest benchmark. Compare the strategy with passive exposure over the same dates and with comparable costs.
The central trade-off is holding through reversals versus reacting quickly enough to reduce losses. A faster signal can exit sooner, but it can also increase turnover and repeated entries.
For a prop account, check whether the expected holding period fits financing costs, weekend permissions, and drawdown rules. A longer-horizon strategy isn't suitable merely because its final historical return looks attractive; its interim equity declines must also fit the account.
5. Statistical Arbitrage and Pairs Trading
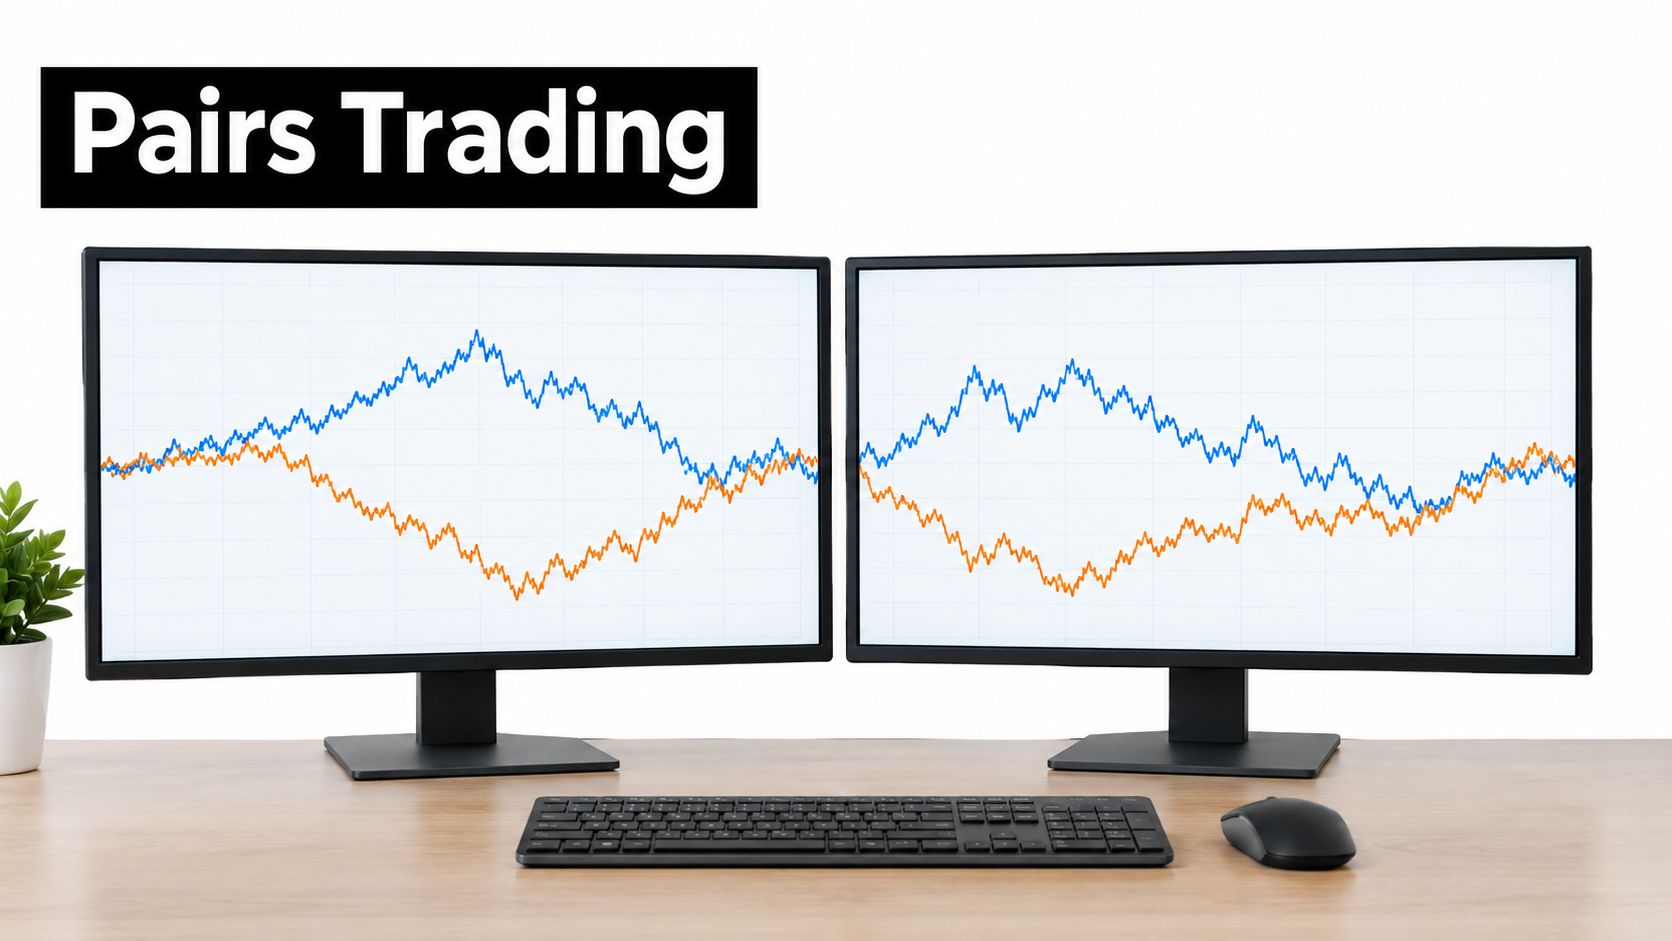
Buying an underperformer and shorting an outperformer doesn't create a risk-free position. Pairs trading depends on a relationship remaining economically and statistically useful after entry.
For an AUDUSD and NZDUSD research scenario, you could estimate a hedge ratio, construct a spread, and trade unusually large deviations from its historical center. Correlation alone isn't enough: prices can move in similar directions without their spread reliably returning to a stable level.
Validate the Relationship Outside the Selection Sample
Use separate periods for selecting the pair, estimating the hedge, and evaluating the trading rule. Examine cointegration where appropriate, but don't treat a statistical test as proof that convergence will continue.
Define a maximum holding time and a spread-based invalidation rule before placing either leg. Otherwise, a failed convergence trade can become an indefinite financing commitment.
- Model both legs. Include spreads, commissions, financing, and potentially different trading hours.
- Handle incomplete execution. Specify what happens if one leg fills and the other is rejected or delayed.
- Control gross exposure. A small net directional position can still contain substantial exposure on each side.
- Schedule hedge updates. Continually refitting the hedge during a losing trade can obscure whether the original idea failed.
Market-neutral is a construction objective, not a guarantee that the account has little risk.
For prop-account validation, stress the legs separately as well as together. A temporary mismatch, financing debit, or unfavorable fill can affect account equity even when the intended spread trade appears well hedged. Stop the system when the relationship fails your predefined tests, not only when the cash loss becomes uncomfortable.
6. Grid Trading Algorithms
Grid trading monetizes repeated movement within a range by placing orders at predetermined price intervals. The critical question is what happens when price doesn't return through the grid.
Consider a EURUSD grid that adds buy orders as price falls and closes individual positions after rebounds. The account may show regular realized gains while retaining increasingly large unrealized losses below the starting price.
That distinction makes a closed-trade equity chart inadequate. Review total account equity, margin use, open inventory, and the cost of liquidating every position together.
Calculate the Basket Before Activating It
A MetaTrader Expert Advisor or another automated grid implementation needs explicit limits on its entire order sequence. Platform convenience doesn't replace exposure analysis.
- Bound the inventory. Set a maximum number of active levels and a maximum aggregate position.
- Define a basket stop. Specify when the system closes everything, including how it handles failed exits.
- Reject lot doubling. Increasing size after losses can rapidly undermine the original risk budget.
- Stress a persistent move. Model price continuing against the grid without the recovery needed to close positions profitably.
For exposure calculations, sum the loss on each potential fill at the stress price, then add costs and a slippage allowance. A shortcut based only on spacing and order count can miss different entry prices and instrument-specific contract values.
The SEC's market-access risk-control guidance concerns broker-dealers, not a blanket obligation for retail FX traders, but its emphasis on order-size, price, and access controls provides a useful design reference.
For a prop account, reject any grid whose survival depends on holding losses beyond the account's permitted drawdown. No parameter optimization fixes that mismatch.
7. Machine Learning Classification Models
A machine-learning classifier should answer a precise question, such as whether an instrument's return over a defined future interval is likely to exceed its trading costs. Predicting direction alone isn't the same as identifying a trade worth taking.
Logistic regression, random forests, and gradient-boosted trees offer different ways to combine features. An hourly EURUSD prototype could use lagged returns, recent volatility, spread conditions, and session information, provided every feature was available at the decision time.

Validate the Trading Decision, Not Just the Prediction
Use chronological walk-forward testing and preserve a final untouched test period. Fit preprocessing within each training window, and prevent overlapping labels from leaking future information across the training boundary.
Compare the classifier with a simple rule-based baseline under identical costs and sizing. Better classification accuracy doesn't necessarily produce better net returns if the model gets the expensive or large-move trades wrong.
- Check calibration. A probability score shouldn't automatically determine position size.
- Include a no-trade decision. Weak predictions needn't become orders.
- Define retirement conditions. Monitor changes in features, costs, and realized outcomes.
- Version every model. Record the training data, features, settings, and deployment approval.
Reporting on AI-driven trading risks highlights overfitting and the possibility of similar automated reactions during extreme volatility. Don't assume a model will adapt safely because it uses machine learning.
For funded trading, keep daily-loss controls outside the prediction model. A confident forecast must never override an account-level stop or authorize uncontrolled exposure.
8. Execution Algorithms VWAP, TWAP, and POV
Execution algorithms solve an order-placement problem, not a forecasting problem. Once you've decided what to buy or sell, they determine how to distribute the order.
TWAP, or time-weighted average price execution, spreads orders over time. VWAP, or volume-weighted average price execution, follows a volume profile, while POV, or percentage-of-volume execution, targets a share of observed market activity.
For example, a trader could split a larger index order into scheduled slices instead of submitting the full amount immediately. That reduces dependence on a single fill, but leaves part of the order unexecuted while price can move away.
Match the Benchmark to the Trade's Purpose
A large comparative transaction-cost study estimated approximately 4 basis points of average algorithmic outperformance after adjusting for order difficulty. That result concerns the study's execution sample, not an expected advantage for a retail FX or CFD strategy.
For urgent orders, measure execution against the arrival or decision price. For scheduled passive orders, volume and participation benchmarks can be useful, but the benchmark must reflect what the trader was trying to accomplish.
- Log the full sequence. Record decision price, submissions, acknowledgments, fills, cancellations, and rejections.
- Verify volume data. Don't assume a platform's FX or CFD feed represents consolidated market volume.
- Control participation. Cap slice size and define when the execution schedule may pause.
A Bayesian transaction-cost framework distinguishes implementation-shortfall and reversion measures from VWAP benchmarking. Use the VWAP trading strategy guide for related context, while keeping execution benchmarking separate from directional signals.
Also confirm platform message limits and order-splitting support. Better scheduling can't compensate for orders your account or platform doesn't permit.
9. News-Event Trading Algorithms
Sometimes the most useful news algorithm is the one that prevents trading. An event filter can cancel entries, reduce exposure, or pause a strategy without attempting to predict the announcement.
A EURUSD prototype around an ECB rate decision could suspend new entries before the release and resume only after spreads and price behavior meet predefined conditions. A breakout version would need separate rules for entry, maximum acceptable spread, stop placement, and failed execution.
The news trading forex strategy guide provides additional context, but account permissions must be checked before implementing either approach.
Make Resumption Conditional
A fixed waiting period is simple, but it doesn't establish that execution conditions have normalized. Combine the event schedule with observable checks, and define what happens when the calendar feed is unavailable or stale.
- Use a maximum spread threshold. Skip entries when the current spread exceeds the tested allowance.
- Reduce exposure before uncertainty. Don't assume an exit submitted near the release will fill at the displayed price.
- Separate event statistics. Review announcement-related slippage and rejected orders independently.
- Check account permissions. Confirm restrictions on entries, exits, holding positions, and any required add-ons.
Operational safeguard: After an abnormal rejection or connectivity failure, reconcile actual positions before sending another order.
FINRA's guidance on high-frequency trading controls identifies duplicative orders, excessive messaging, and erroneous orders as risks requiring controls. An event-driven system should therefore limit retries and order frequency, not repeatedly submit instructions until something fills.
For a prop account, test an event shock across all open strategies. Several individually acceptable positions can still create an unacceptable combined loss.
Algorithmic Trading Methods: 9-Strategy Comparison
| Strategy | 🔄 Implementation Complexity | ⚡ Resource Requirements | 📊 Expected Outcome Profile | ⭐ Ideal Use Case | 💡 Key Advantage |
|---|---|---|---|---|---|
| Moving Average Crossover Trend Following | Low; rule-based signals are straightforward to code and test | Price data; two moving averages; risk controls | Low win rate with larger winners; whipsaws and losing streaks in sideways markets | Strong, sustained trends | Simple, transparent, and well studied |
| Mean Reversion with Bollinger Bands and RSI | Low to moderate; indicator rules are clear, but filters and stops need testing | Price and volatility data; Bollinger Bands; RSI; strict stops | Often many small wins, with risk of larger losses during sustained trends | Ranging, lower-trend markets | Frequent opportunities with measurable entry and exit rules |
| Opening Range Breakout (ORB) | Low to moderate; session timing and order logic require careful setup | Intraday data; session schedule; breakout orders; slippage assumptions | Breakout gains are possible, but false breaks and wide ranges can cause losses | Liquid markets around major session opens | Clearly defined range and trade rules |
| Time-Series Momentum | Moderate; requires lookback, rebalancing, and portfolio-sizing rules | Historical data across multiple markets; volatility-based sizing | Lower trading frequency; drawdowns may last months | Longer-horizon, diversified portfolios | Research-backed approach with potential diversification benefits |
| Statistical Arbitrage and Pairs Trading | High; requires pair selection, statistical testing, and hedge-ratio updates | Synchronized data for multiple instruments; statistical tools; two-leg execution | Spread convergence may generate returns; relationship breaks can cause sustained losses | Related instruments with tested, stable relationships | Can reduce exposure to broad market direction |
| Grid Trading | Low to set up; risk management becomes complex as positions accumulate | Automated order management; substantial margin capacity; exposure limits | May produce frequent small gains in ranges; strong trends can cause large drawdowns | Ranging markets, only with strict basket limits | Simple to automate and configure |
| Machine Learning Classification Models | High; requires feature design, validation, and ongoing monitoring | Clean time-stamped data; computing tools; separate training, validation, and test periods | Can detect nonlinear patterns, but overfitting and model decay may weaken live results | Data-rich workflows with rigorous validation | Combines multiple inputs and can provide probability estimates |
| Execution Algorithms: VWAP, TWAP, and POV | Moderate; scheduling and execution rules depend on the algorithm | Order-splitting support; liquidity and volume data; broker or platform access | May improve execution quality for larger orders; does not generate trade signals | Executing larger orders while managing market impact | Provides structured execution and measurable benchmarks |
| News-Event Trading Algorithms | High; timing, spread, and slippage controls are critical | Economic calendar; fast data and execution; event-specific risk limits | May capture rapid moves, but slippage, gaps, and spreads can exceed expectations | Carefully selected scheduled releases where rules permit | Calendar-based activity with clearly defined event windows |
Build a Method You Can Survive
Every method in this article answers a different problem. Trend systems answer price persistence. Mean reversion answers temporary deviation. Pairs trading answers a stable relationship between instruments. Execution algorithms answer how an existing decision reaches the market. Pick the one whose assumption you can explain plainly, because that assumption is what you will test, size, and eventually abandon if the data turns against it.
Test the assumption before touching a single parameter. Run it through trending, ranging, high-volatility, and low-liquidity periods, and charge every simulated trade its real cost: spread, commission, financing, slippage, and execution delay. Position sizing belongs inside the simulation, since a method that only survives at aggressive size after costs is a method that does not work.
Make Deployment a Separate Decision
An attractive backtest earns you a closer look, nothing more. Scaling requires its own evidence: an untouched out-of-sample period, a demo run, and an honest comparison between live behavior and your documented assumptions. Most strategies I have reviewed fail at this stage rather than in the backtest, because live spreads and partial fills expose what historical bars hide.
- Test operational failures. Stale data, interrupted connections, partial fills, duplicate submissions, and rejected exits all happen in production.
- Define stop conditions. Set hard limits for account losses, abnormal spreads, slippage, and unexpected exposure.
- Reconcile positions. After a restart, the system must recover the account's actual state before it trades again.
- Review account compatibility. Confirm automation permissions, drawdown calculations, session restrictions, and instrument availability before funding anything.
For MyFundedCapital, test against the published 5% daily loss limit and the applicable maximum drawdown of up to 10%, confirming the terms for your chosen program in the published account rules. Keep an operating buffer below those boundaries rather than treating them as target losses.
Frequently Asked Questions
Which algorithmic trading method is best for beginners?
A moving-average crossover is a useful starting point because its decisions are easy to inspect and reproduce. That builds testing and execution discipline. Whether it earns profits depends on the edge, and many beginner edges disappear once realistic costs enter the simulation.
How should I test the same strategy across FX, CFDs, crypto, and indices?
Keep the signal definition consistent where appropriate, but model each instrument's trading hours, contract specifications, spreads, financing, and execution conditions separately. Use walk-forward testing and adverse-slippage scenarios, with distinct results for normal and stressed liquidity.
When should an algorithm stop trading?
Pause when predefined account or operational limits are reached, or when the system can't establish reliable prices and positions. Restart only after reconciliation and review, not because another signal appears.
Can algorithmic strategies work in a prop account?
They can be compatible when the program permits automation and the strategy fits its risk rules. Compatibility says nothing about profitability, and a simulated trading environment does not remove execution assumptions or account constraints.
This content is educational only and isn't financial advice. Trading involves risk of loss, and automation can repeat a flawed decision faster than a trader can intervene.
MyFundedCapital offers simulated-capital trading programs through Instant Funding and challenge-based paths, with support for algorithmic trading. Once you've validated your strategy and shutdown controls, visit MyFundedCapital to compare account types and confirm which program's rules fit your method.