ES
ES
 DE
DE
 FR
FR
 AR
AR
 IT
IT
 NL
NL
 PL
PL
 SV
SV

A displayed quote is only as useful as your ability to execute at that price, even in a market processing approximately $9.6 trillion in foreign-exchange turnover each day. The bid, ask, spread, and latency determine whether the price on your screen becomes a fill or merely a number that disappeared when you clicked.
You've seen the setup: a clean entry appears on the chart, you press buy, and the order fills somewhere worse, or doesn't fill at all. That isn't always bad luck. It's the quote-to-fill gap, created by changing liquidity, data delays, spread expansion, and slippage. This guide shows how to read quotes for traders, test the quality of your feed, and audit whether your platform delivers what it displays.
Why Market Quotes Are Not Just Numbers
A market quote is a time-sensitive indication of executable interest, not a fixed valuation. The price you see reflects a particular moment, a particular liquidity pool, and a particular side of the market. By the time your order reaches the venue or liquidity provider, buyers and sellers may have changed their prices or withdrawn available size.
That distinction matters most during fast markets. A chart may show a candle closing at a level that looks ideal, while the order ticket already displays a different ask. The chart is useful for analysis, but the order ticket is closer to the price you must pay. Treating the chart price as guaranteed encourages traders to measure performance against a price they never could have bought or sold.
The observer versus the executor
A passive observer asks, “Where is price?” An executor asks, “What can I buy or sell now, at what cost, and with what probability of getting filled?”
That second question changes the workflow:
- Check the executable side A long entry normally interacts with the ask, while a short entry normally interacts with the bid.
- Check the timestamp A quote without a time reference can't tell you whether the displayed price is current, delayed, or indicative.
- Check the spread A favorable mid-price can hide an expensive distance between the bid and ask.
- Check the order type A market order prioritizes execution, while a limit order prioritizes price control and may remain unfilled.
The Bank for International Settlements' FX market overview describes foreign-exchange prices as forming across a decentralized network of banks, dealers, institutions, corporations, and other participants. There's no single central exchange producing one universal quote for every trader. Your platform shows a price from its available market data and liquidity arrangements, which may differ from another platform's price at the same instant.
Practical rule: Judge a strategy by the price it could realistically execute, not by the cleanest price visible on a historical chart.
This mindset also prevents a common testing error. A strategy that looks profitable using candle-close prices may fail once realistic bid, ask, spread, latency, rejected orders, and slippage enter the record. Trading involves risk of loss, and borrowed capital can magnify the financial impact of even small quote changes.
Decoding the Anatomy of a Trade Quote
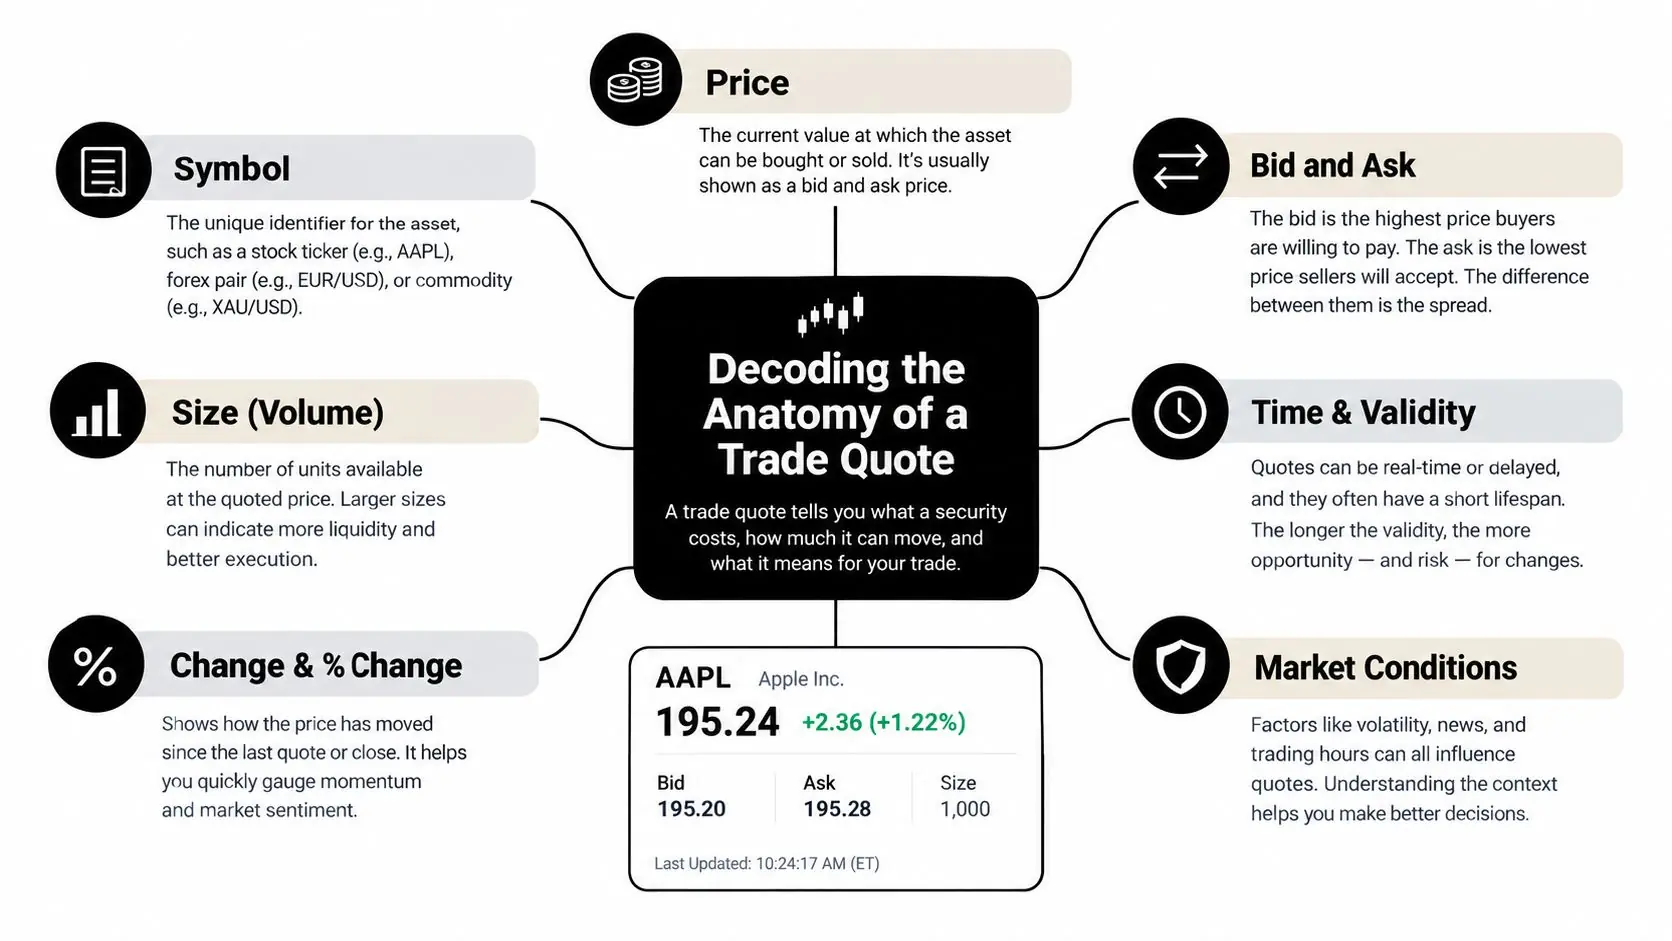
A quote consists of two prices sitting side by side, the bid and the ask, with a gap between them that represents your immediate cost of entry. Those numbers describe available prices, not a guaranteed fill. By the time an order reaches the venue, either side may have changed.
The bid is the best displayed buying price. The ask is the best displayed selling price. If a platform shows a bid of 1.1000 and an ask of 1.1002, the spread is Ask minus Bid, producing 0.0002, or 2 pips in a standard four-decimal FX quotation. The BIS research on foreign-exchange liquidity explains the bid, ask, and spread as core parts of a two-sided market and indicators of transaction cost and liquidity.
What each field tells you
- Bid The price available for an immediate sale. It applies when closing a long position or opening a short position.
- Ask The price available for an immediate purchase. It applies when opening a long position or closing a short position.
- Spread The gap between bid and ask. A wider gap increases the cost of immediate execution.
- Last price The most recently reported transaction price. It can differ from the current bid and ask during fast markets.
- Volume The amount traded or reported by the relevant venue or feed. It provides activity context, but does not guarantee your order will receive the displayed price or size.
The quote-to-fill gap often starts with a field traders overlook. A last price may look favorable on a chart while the executable ask or bid has already moved. Volume can look active while the feed provides no assurance that your order can trade at the displayed level.
Short-horizon traders feel the spread most sharply because a round trip generally crosses it twice. A long entry at the ask followed by an exit at the bid needs enough price movement to cover that gap before breakeven, excluding fees and financing. Record the spread in pips or basis points at entry, then compare it with the expected target size. A small target can leave little room for latency or slippage.
The quote also needs instrument and market context. Pair, session, order size, and prevailing conditions affect what the numbers mean. A competitive quote for a heavily traded major pair is not directly comparable with one for an exotic currency, index contract, or crypto instrument.
For a practical explanation, review the difference between bid and ask. Before clicking, identify the side your order will cross and record the displayed spread. After execution, compare that quote with the fill price to test whether the feed reflects actual trading conditions.
How Market Depth Shapes Your Entry and Exit
A tight quote doesn't automatically mean there's enough liquidity behind it for your order. The first displayed bid or ask may represent only part of the available interest. If your order is larger than the liquidity at that level, the remaining quantity may execute at progressively worse prices.
The global FX market provides scale, but scale doesn't create uniform execution conditions. The BIS 2025 Triennial Central Bank Survey commentary reported approximately $9.6 trillion of average daily OTC FX turnover in April 2025, compared with $7.5 trillion in April 2022, an increase of 28%. Spot transactions represented about $3 trillion per day, or 31%, while FX swaps were the largest instrument at roughly $4 trillion per day.
Liquidity is local, not universal
The same BIS data reported that emerging-market currencies represented 29% of global FX turnover, with combined activity averaging about $2.8 trillion per day. Those figures show how large the market is, but they don't promise narrow spreads for every pair or every session. Liquidity can still thin around economic releases, market openings, rollovers, and periods of stress.
The instrument also matters. The survey recorded outright forward turnover at approximately $1.25 trillion per day in 2025, up from $1.2 trillion per day in 2022, while FX swaps rose from roughly $3.8 trillion to $4 trillion per day. A displayed quote depends on whether you're looking at spot, a forward, a swap, or another instrument, and each can have different liquidity and execution characteristics.
The United Kingdom recorded $4.745 trillion in average daily FX turnover in April 2025, equivalent to 37.8% of global activity, according to the same BIS commentary. UK spot turnover increased from $981 billion to $1.420 trillion per day, while forward turnover rose from $555 billion to $1.081 trillion. These numbers help explain why a major dealing center can show deep activity while a particular pair, product, or time window still behaves poorly.
A depth check before entry
Use order-flow analysis to add context, but don't confuse visible activity with guaranteed execution. Before placing an order, ask:
- Is the spread normal for this instrument and session?
- Does the available size support the order I want to place?
- Am I trading spot, forward, swap, option, CFD, or another product?
- Could a scheduled release change the quote before the order reaches the market?
- Would a limit order protect me from an expensive fill, or would non-execution be worse?
A market order can be appropriate when execution matters more than price certainty. A limit order can be appropriate when price discipline matters more than immediate participation. Neither removes risk.
Real-Time vs Delayed Feeds and the Latency Reality
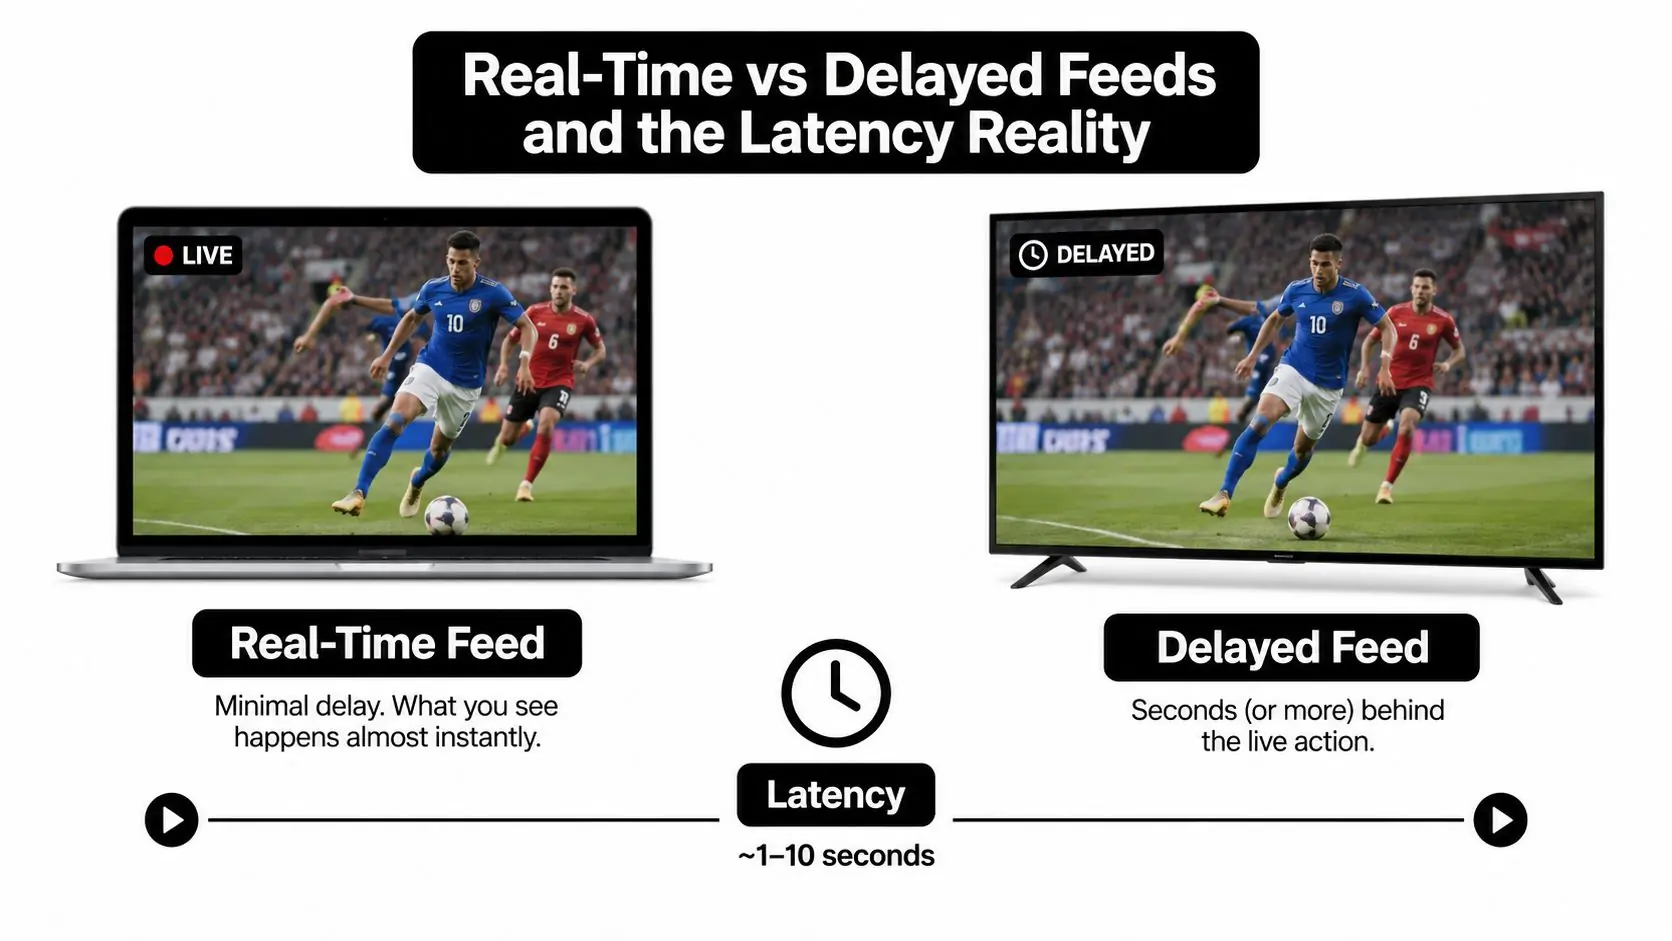
A real-time label doesn't mean your entire trading process is instantaneous. The price may update quickly at the source, then travel through a data connection, platform, chart, order ticket, broker, and execution system before you receive a fill. Each stage can create a difference between the price you intended and the price you got.
A delayed feed is suitable for broad observation and some forms of analysis, but it's dangerous for short-horizon execution. An indicative quote can help show a reference level, yet it may not represent executable buying or selling interest. A real-time quote is more relevant, but it still can't guarantee a fill at the displayed price.
Match the feed to the strategy
Retail-grade real-time systems may deliver data in under 100 milliseconds, while professional co-located systems can operate below 1 millisecond, according to the market-data discussion at Pomegra. That difference may matter greatly to an algorithm reacting to transient prices, while it may matter less to a trader holding positions for longer periods.
| Trading approach | Main quote concern | More suitable control |
|---|---|---|
| Short-horizon discretionary trading | The order ticket changes before the click completes | Compare intended and actual prices |
| Algorithmic execution | Timestamp, network delay, rejected fills, and partial fills | Use realistic event timestamps and slippage limits |
| Swing trading | Reference prices can be less important than gaps and spread at entry | Record the executable bid and ask |
| Copy trading | The follower may receive a different quote or fill from the source account | Measure signal time, arrival time, and fill difference |
News events expose weak data processes quickly. The SEC explains in its investor bulletin on extended-hours trading that reduced interest outside regular market hours can produce wider spreads, fewer available quotes, and more difficult execution at advantageous prices. The same principle applies to many instruments during thin sessions or major releases.
Build safeguards around the feed you use. A trading system can reject a signal when the current spread rises above a chosen multiple of its rolling median, and it can reject a fill after the quote changes beyond a maximum slippage threshold. Manual traders can use the same logic by pausing when the spread suddenly expands instead of treating every live tick as equally tradable.
Live data is necessary for live execution, but it isn't sufficient. The timestamp, order path, and fill record still determine what happened.
Auditing Your Quote-to-Fill Evidence
A tight advertised spread doesn't prove that your total execution cost is low. The spread is the bid-to-ask gap. Slippage is the difference between the price you expected and the price you received. They're related, but they're not the same cost.
A useful audit begins immediately before the order. Save the bid, ask, spread, timestamp, intended execution price, order type, actual fill, and direction of slippage. The slippage framework from Broker Champion also recommends reviewing the 90th and 99th percentile outcomes across a meaningful sample, with separate reporting for high-impact and lower-impact events.
Build a quote-to-fill log
Use one row per order and include:
- Pre-order quote Bid, ask, spread, and timestamp immediately before submission.
- Expected price The price your strategy or order ticket used as its decision point.
- Execution result Actual fill, fill timestamp, rejected status, or partial-fill details.
- Cost classification Spread paid, adverse slippage, favorable slippage, commission, and financing where relevant.
- Market context Instrument, session, order type, news condition, and platform connection status.
Don't judge the platform from one difficult trade. Separate ordinary conditions from event windows and compare the distributions. A median result may look acceptable while the tail of adverse outcomes damages a strategy's risk profile. Record the 90th or 99th percentile outcome rather than relying only on the average.
Check internal consistency
Your chart, order ticket, and account statement should tell the same story. They may display different formats or update at different speeds, but a material unexplained discrepancy deserves investigation.
- Capture the chart's bid or ask where available.
- Capture the order ticket at submission.
- Save the platform's execution confirmation.
- Compare the fill with the account statement.
- Mark whether the difference came from spread movement, latency, slippage, rejection, or a genuine gap.
This process can reveal whether a strategy is relying on stale chart prices. It can also show that the problem isn't the spread itself, but a delay between signal generation and order arrival. Don't label every worse fill as manipulation, and don't dismiss every discrepancy as normal. Keep evidence first.
Choosing a Quotes Provider and Platform
A tight displayed spread can still produce poor fills. Choose a provider by comparing its quote-to-fill behavior with your strategy, not by selecting the platform advertising the lowest headline spread. A provider suited to slower discretionary trading may fail a latency-sensitive algorithm, while a platform supporting market orders may lack the controls required for limit, stop, or copy-trading workflows.
Use a practical selection test
Start with the instruments you trade. Confirm whether prices are live, delayed, or indicative. Ask how the platform handles rejected orders, partial fills, spread expansion, and fast price gaps. These details determine whether the quote on screen remains useful when an order reaches the market.
Test the operational layer:
- Data integrity Compare chart prices with the order ticket, execution confirmation, and account statement.
- Order controls Check support for the order types and slippage settings your method requires.
- Connection behavior Record reconnection notices, frozen quotes, and gaps between timestamps.
- Volatile conditions Review the feed during scheduled releases or fast markets, while separating event conditions from ordinary trading.
- Account transparency Read the daily-loss, maximum-drawdown, news, weekend-holding, and payout rules before risking capital.
A proprietary trading environment adds a separate consideration. The quote may reflect real market data while the account operates in simulation. Review both the price source and the firm's evaluation rules. Confirm how a violation is calculated, which equity value is used, and how open-position losses affect the account. A provider can show credible prices while its account rules still make execution difficult to manage.
For traders comparing an evaluation route with self-funded trading, MyFundedCapital offers simulated accounts using real market quotes across forex, indices, crypto, and commodities, with DXtrade and cTrader access, a flat 5% daily loss limit, and up to 10% maximum drawdown through its trading account options. Those rules do not remove spread, latency, slippage, or market risk. Test the quote-to-fill chain under the conditions you intend to trade.
Trust comes from repeatable evidence, not one attractive quote. Keep independent records, test the exact setup you plan to use, and treat account rules as part of execution quality. A provider that publishes clear timestamps and handles difficult fills consistently gives you a stronger basis for judging performance.
Frequently Asked Questions About Trading Quotes
Does borrowed capital change the quote?
No. Borrowed capital does not improve the bid, ask, spread, or latency. It increases the financial effect of a price movement by allowing a trader to control a larger position size relative to their account balance. The SEC warns in its guidance on using borrowed funds to increase position size that losses can exceed the amount initially invested in a margin account. Stress-test adverse movement, gaps, and slippage before entering.
Are major currency pairs always cheap to trade?
No. Major pairs often have stronger liquidity than thinly traded pairs, yet spreads can widen during quiet periods, market stress, and major news. Record the live spread for the instrument and session you trade instead of relying on its usual reputation.
Should I use a market or limit order during news?
A market order improves the chance of participation but gives up price certainty. A limit order sets the maximum acceptable price but may not execute. A stop order can fill at a worse price when the market moves through its trigger. Choose according to whether missing the trade is preferable to accepting adverse selection.
What should I audit first?
Record the bid, ask, timestamp, intended price, actual fill, spread at fill, and slippage direction. Separate ordinary trades from event-window trades, then inspect the worst outcomes rather than only the average.
For traders testing execution discipline in a simulated prop trading environment, MyFundedCapital is one route to compare. Review its account rules alongside the quote-to-fill evidence, and start only when your risk limits and execution process are clear.