The popular advice says copy trading is a shortcut for people who lack time or confidence. That framing is wrong. You're delegating execution and risk decisions to another trader, while absorbing slippage, platform failures, and crowd behavior you may not understand. This copy trading guide shows how to screen providers, configure DXtrade and cTrader, cap concentration, monitor performance, and decide when manual trading is safer.
Free resources: the free Payout Date Calculator.
Why Most Copy Traders Lose Money Before They Start
Most copiers lose money before linking an account because they choose a provider, not a risk model. A leaderboard displays past winners, but it doesn't tell you whether the trader used borrowed funds, held through deep drawdowns, changed position size, or benefited from a market regime that has already ended.
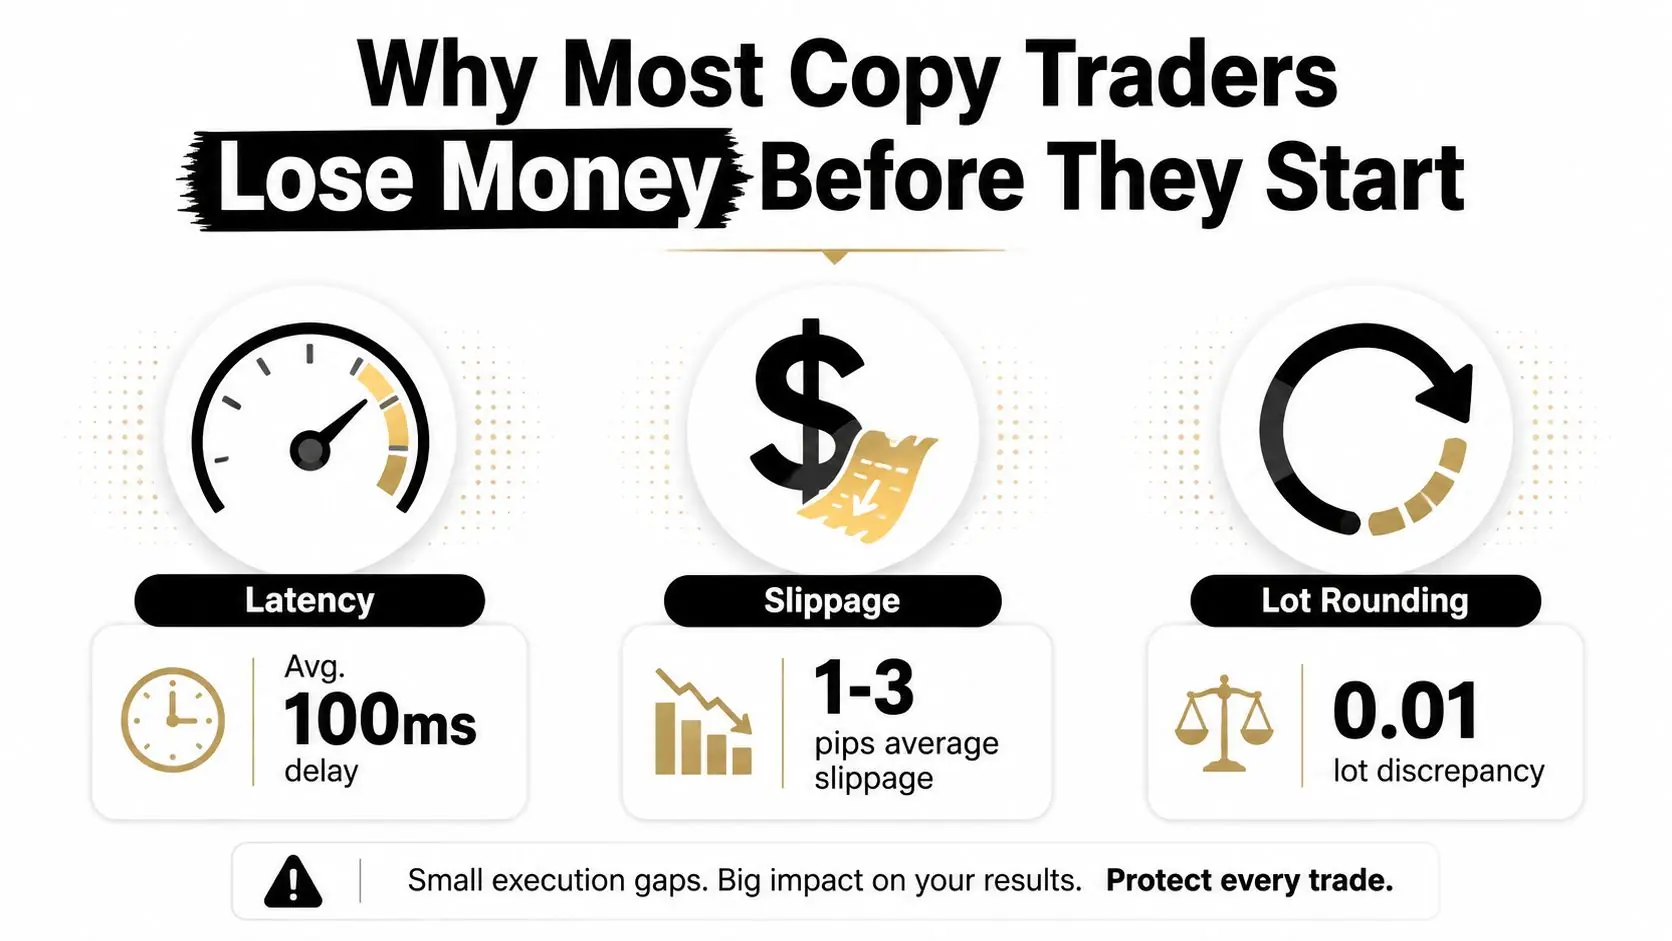
Execution creates another problem. The copied trader enters first, while your account follows after the platform processes the signal. Your fill can differ because of latency, slippage, liquidity, and lot rounding. The result is simple: you copy exposure, not the leader's exact outcome.
A peer-reviewed study of major copy-trading platforms found that the top 5% of copied traders accounted for 61.1% of copier relationships on ZuluTrade and 92.8% on eToro. Only 1.13% to 8.71% of traders were being copied, depending on the platform, so follower attention concentrates around a small visible group rather than reflecting broad retail skill (peer-reviewed copy-trading study).
Four failure modes to eliminate
- Winner chasing You select a provider after a sharp run, then experience the drawdown that the leaderboard hides.
- Execution mismatch Your account enters later, at a different price, or with a rounded position size.
- Uncapped exposure Several leaders open similar positions during the same session.
- Rule blindness A normal losing day becomes a funded-account violation because the account has a daily loss limit.
MyFundedCapital's stated risk parameters include a 5% daily loss limit and up to 10% maximum drawdown. A correlated day across several leaders can breach those limits before you can react. Read what FOMO in trading looks like before selecting a provider, because leaderboard chasing is often FOMO with an automated order system attached.
Risk manager's rule: Treat every leader as a leveraged strategy sleeve. Never treat one as a passive income stream.
Pre-Link Checklist Every Follower Should Complete
Don't connect a provider until the account, platform, and rules are ready. Copy trading only works inside the constraints of the account you're using, and a profitable signal can still fail a funded evaluation if its exposure conflicts with the firm's limits.
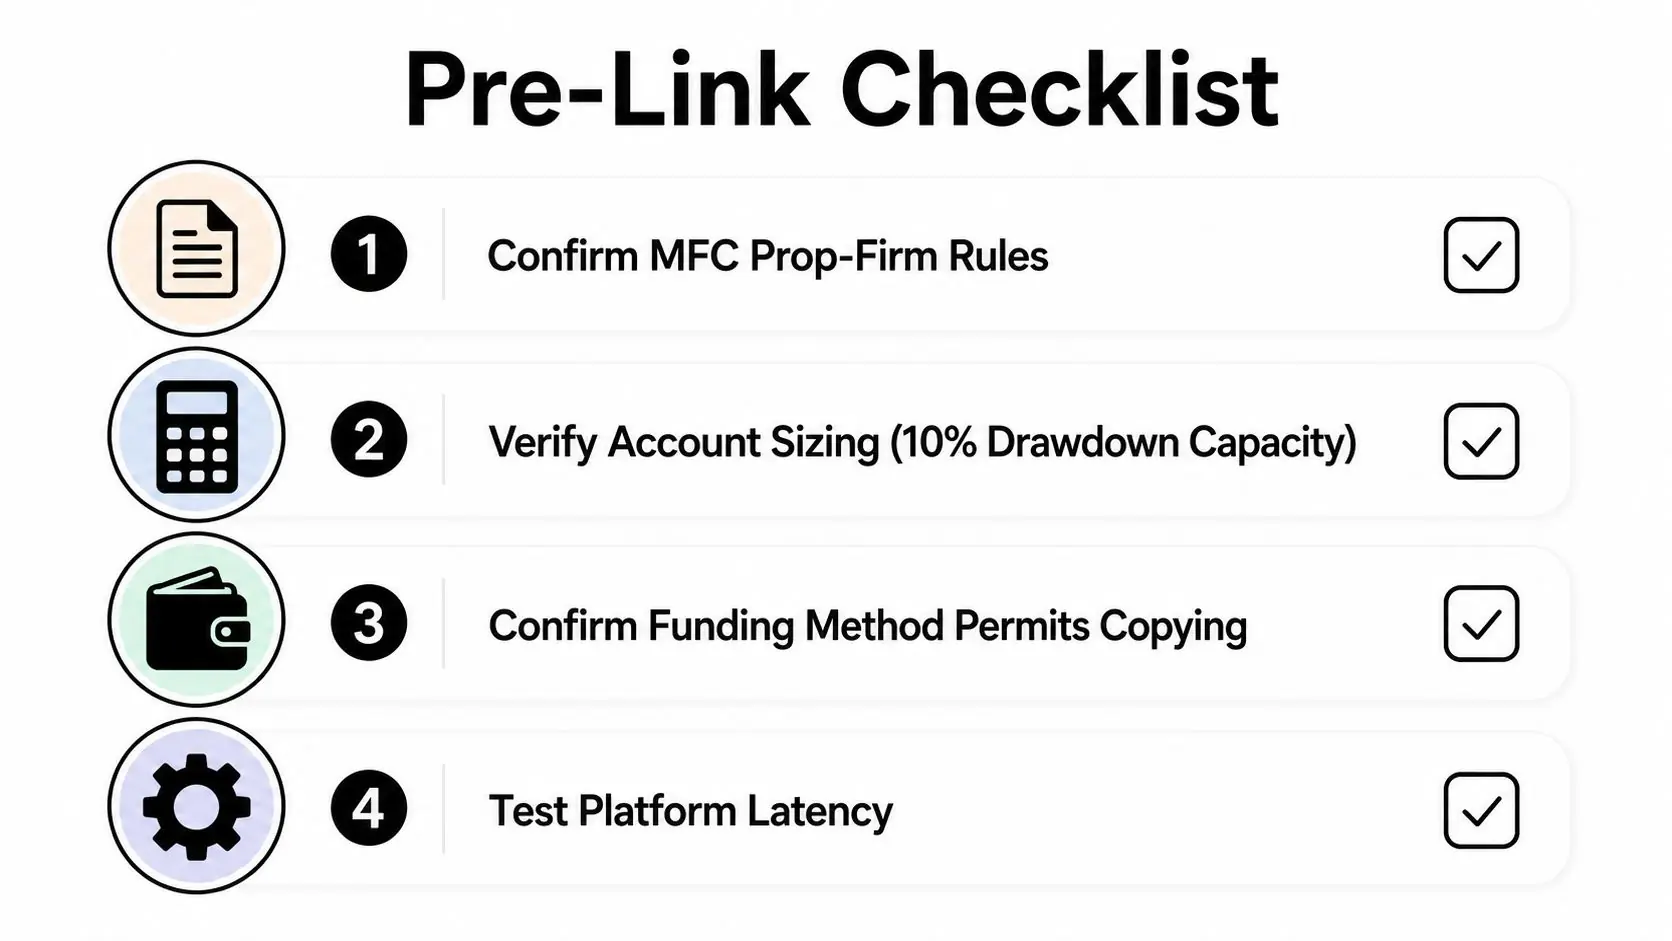
Complete these checks first
Confirm the prop-firm rules. Verify that copy trading is permitted on your specific account type, platform, and funding route. MyFundedCapital allows automated strategies and EAs by agreement (contact support first), and copy trading systems, when they comply with its risk rules and don't exploit platform vulnerabilities. Rules can change, so check the current terms before you link an account.
Size for the full drawdown allowance. Your allocation must tolerate a severe losing period without pushing the account through its daily or maximum loss boundary. Don't allocate based on the amount you hope to earn. Allocate based on the loss you can absorb while keeping the account operational.
Set a per-leader ceiling. Write the maximum capital percentage for each provider before you see their return chart. Your limit should remain valid after a winning streak, when emotional pressure encourages you to increase exposure.
Match the trading environment. Whitelist providers compatible with your terminal, whether that's MetaTrader-compatible infrastructure, DXtrade, or cTrader. Check symbols, contract specifications, risk amplification options, stop-loss handling, and whether pending orders are mirrored.
Run a live execution test. Start in a demo environment or with a 0.5% micro-lot allocation for at least two trading days. Record entry differences, exit differences, rejected orders, partial fills, and unexpected positions. This test won't prove profitability, but it will expose operational mismatches.
Document the strategy. Record the provider's strategy tag, instruments, holding style, trading hours, timezone, and average position behavior. That information helps you identify correlation when two apparently different leaders trade the same market session or instrument group.
Finish with a written policy covering maximum leaders, maximum capital per leader, and maximum correlated exposure. Keep your payout and withdrawal process documented too, and review the available prop-firm payout methods before you rely on trading income.
Screening Signal Providers Without Chasing Recent Winners
Raw return is a poor selection tool. A provider with a large gain may have earned it through oversized positions, concentrated instruments, or a drawdown that your funded account can't survive. The better question is whether the return compensates you for volatility, execution costs, and the probability of a prolonged recovery.
Use a verified record covering at least 6 months, with at least 100 trades, and a published maximum drawdown below 8% if you want the profile to remain compatible with MFC-style limits. These are screening rules, not guarantees. A provider can still change behavior after you start copying.
Compare the right metrics
| Metric | What Followers Check | What Actually Predicts Edge |
|---|---|---|
| Return | Recent percentage gain | Return adjusted for volatility and drawdown |
| Win rate | How often trades close profitably | Average win, average loss, and consistency |
| Copy count | Popularity on the leaderboard | Whether attention reflects durable process or recent performance |
| Sharpe ratio | Sometimes ignored | Risk-adjusted return across the observed period |
| Maximum drawdown | Peak-to-trough loss | Whether the account can survive the path, not just the result |
| Recovery time | Often absent from profile cards | How long capital remains impaired |
| Trade frequency | More trades appear more active | Whether turnover adds cost without improving expectancy |
| Instrument mix | Number of symbols | Concentration in one market, session, or risk factor |
The empirical evidence is clear on one selection error. Choosing traders by accumulated returns alone produced high losses, while incorporating the Sharpe ratio improved outcomes in an empirical social-trading analysis (copy-trading profitability study).
A 40% return over 3 months with a 35% drawdown is worse for a funded follower than an 18% return with a 6% drawdown. The second provider gives the account a more survivable path, even though the headline return is smaller.
Apply qualitative filters
Reject providers who concentrate in one volatile instrument, add repeatedly to losing trades, hold positions through unplanned news, or vary position size without a clear rule. High turnover can stack spreads and commissions. Very low frequency can create tracking-error risk because one missed entry materially changes the result.
Don't chase a recent winner. The platform's visible ranking is a filtered sample of accounts that already survived long enough to attract attention. Your job is to determine whether the provider has a repeatable risk process, not whether the chart looks impressive today.
Platform Setup on DXtrade and cTrader for Copy Trading
Platform configuration is a risk-control task, not an administrative step. Defaults often prioritize convenience, while a funded account needs explicit limits on allocation, drawdown, open positions, symbols, and pending orders.
DXtrade configuration
Open Account Management, select Copy Trading, choose the leader strategy, and set the copying mode. Use Proportional mode when the leader and follower accounts have comparable equity and you want exposure to scale with capital. Use Fixed Lot only when you understand the position-size relationship and the accounts are closely matched.
Set Maximum Allocation per Trade to 0.5% of funded balance. Enable Stop on Equity Drawdown at 8%, which leaves room inside MFC's 10% maximum drawdown boundary. Disable Mirror Pending Orders to reduce weekend-gap and unfilled-order exposure. Remove the default Maximum Copy Size and replace it with your own concentration cap. An uncapped setting can override the risk plan you built before linking.
cTrader configuration
Open cTrader Copy under Apps, connect through the broker-side invite token, select the strategy, and configure the account-level controls before activation. Set Equity Stop Loss to 4% and Maximum Open Trades to 5. Confirm that the symbol whitelist excludes high-volatility crypto and rollover-weekend pairs unless your account rules and strategy mandate them.
Review every copied stop, take-profit instruction, and position-size adjustment after activation. cTrader Copy can reproduce the leader's actions, but it can't make the leader's margin requirements or holding behavior suitable for your account.
| Setting | DXtrade Path | cTrader Path |
|---|---|---|
| Copy area | Account Management, Copy Trading | Apps, cTrader Copy |
| Allocation mode | Proportional or Fixed Lot | Strategy allocation settings |
| Trade allocation | Maximum Allocation per Trade, 0.5% of funded balance | Governed by allocation and equity controls |
| Equity protection | Stop on Equity Drawdown, 8% | Equity Stop Loss, 4% |
| Open exposure | Remove default Maximum Copy Size and set a personal cap | Maximum Open Trades, 5 |
| Pending orders | Disable Mirror Pending Orders | Review pending-order behavior before activation |
| Instruments | Use a symbol whitelist | Exclude high-leverage crypto and rollover-weekend pairs |
Choose a terminal only after checking the best FX trading platform options against your broker and provider requirements. Also review account-security exposure before sharing tokens or linking services. A resource such as the GoSafe Online Trade dark web check can help you assess whether your online trading credentials or related information may have appeared in breach monitoring.
Sizing Allocations and Concentration Caps
The copy function rarely blows the account by itself. Allocation does. A leader can trade within a tolerable risk range, but your account can still fail if you allocate too much or follow several providers with the same underlying exposure.
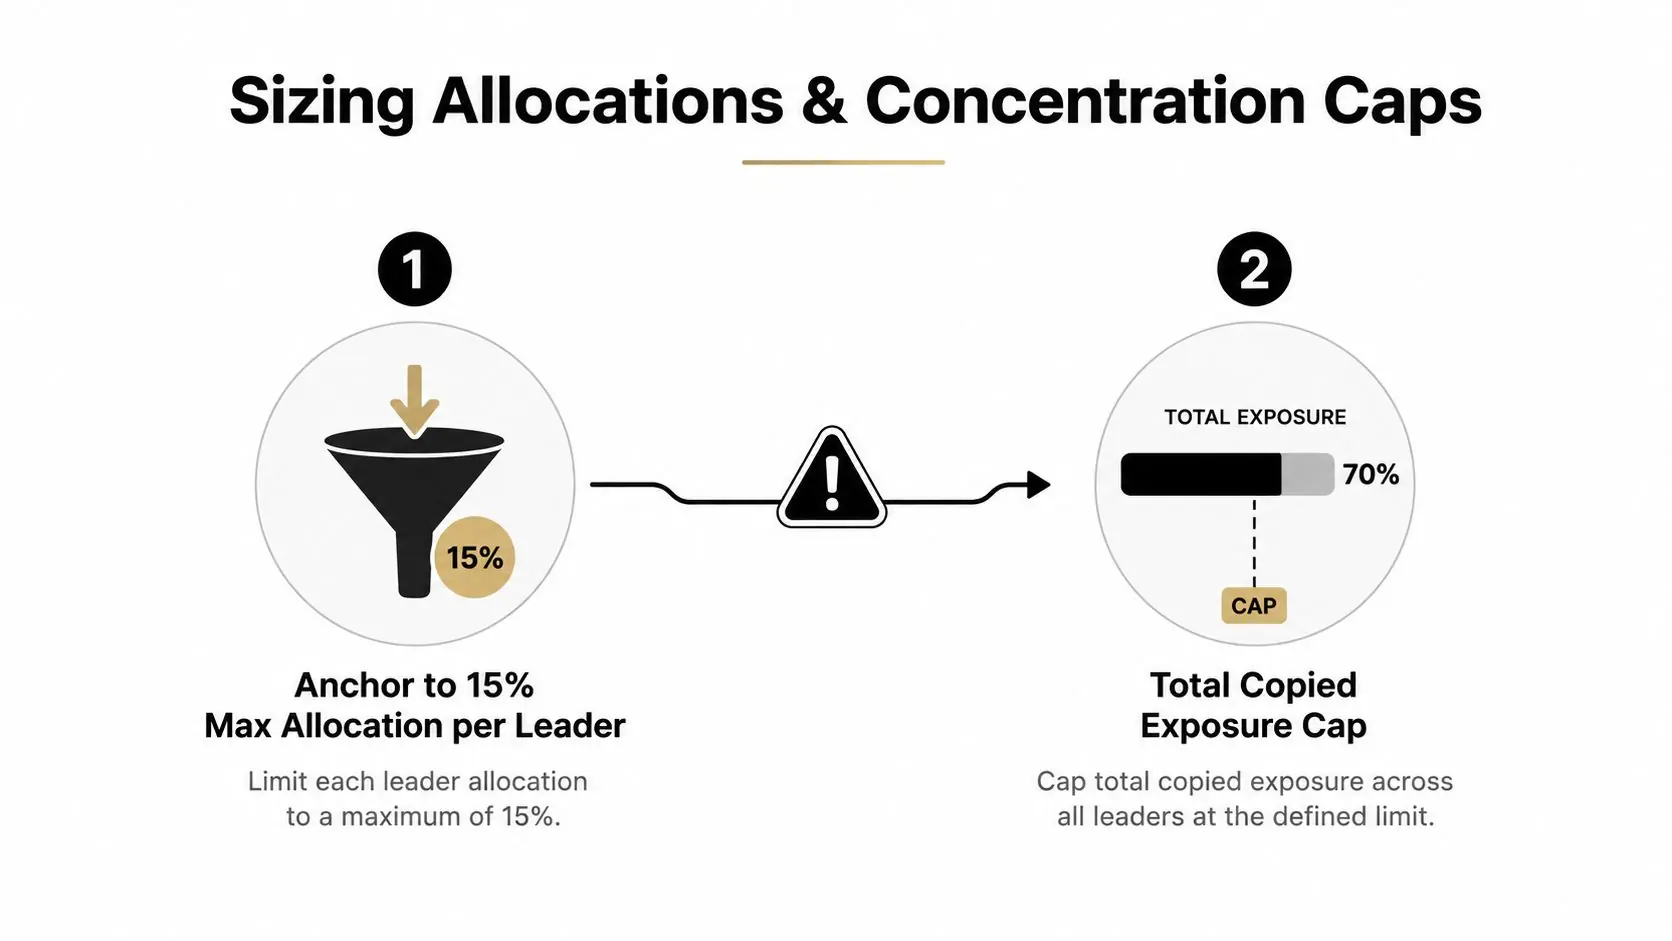
The practical starting anchor is 15% of funded equity per leader. Cap total copied exposure across all leaders at 60% of balance, leaving 40% as a cash buffer for correlated losses, execution differences, and rule protection.
Run the daily-loss math
MFC's 5% daily loss limit means a leader producing a 2% open drawdown consumes 40% of that daily budget. Three leaders with similar exposure can consume the entire day's tolerance if they lose together. The leaders may appear diversified by name, but their open trades can still share the same dollar, index, crypto, or risk-on factor.
Before increasing an allocation:
- Check shared exposure Compare the top holdings and open trades across leaders. Apply a 1.5x correlation check to identify overlapping risk before treating providers as separate sleeves.
- Cap each copied idea Use a Kelly-lite ceiling of 2% risk per copied idea, not 2% per leader. If three leaders independently enter the same market thesis, count the combined exposure as one idea.
- Keep proportional sizing honest Refuse Fixed Lot mode when account sizes diverge beyond 3x. Fixed lots can create disproportionate risk for the smaller account.
- Protect the buffer Don't convert unused cash into additional allocation after a winning week. The buffer exists for adverse correlation, not for performance chasing.
The infographic indicates a 70% total exposure cap, while the conservative operating rule here is 60%. Use the lower limit for a funded account unless the account rules and your tested execution data justify a different policy. The important principle is that a cap must be set before the trade, not after the loss.
Monitoring, Rebalancing, and Knowing When to Unfollow
Copy trading is a weekly review job. Automation handles order replication, but it doesn't determine whether the leader's process remains intact or whether several strategies have become one concentrated bet.
Use a fixed review cadence
Every Monday, pull the prior 5 trading days for each leader and compare realized Sharpe against the 4-week trailing baseline. A decline of more than 30% triggers a 50% allocation cut. Don't replace the allocation immediately. A pause is a risk decision, not an invitation to chase the next leaderboard winner.
Every Friday, inspect correlated open exposure. If any pair of leaders reaches 8% of equity across leaders, rebalance the caps. This prevents a portfolio that looked diversified during selection from becoming concentrated during active trading.
Keep a simple ledger with four fields:
- Date Record when the review happened.
- Leader Identify the exact provider and account.
- Action Note whether you held, cut, paused, or unfollowed.
- Reason Tie the action to drawdown, correlation, execution, or a rule change.
Set hard exit triggers
Unfollow a leader when any of these conditions occurs:
- The equity curve reaches new lows for two consecutive weeks.
- A single trade exceeds the leader's stated maximum drawdown by more than 1.5%.
- The strategy changes without an announcement at least 48 hours in advance.
Those rules remove discretion during stress. They also create an audit trail for your own review and any funded-account payout discussion. For broader operational discipline, use these SRE monitoring tips as a reference for alerts, incident records, and service health checks.
A provider doesn't need to lose every trade to become unsuitable. Unannounced process changes are enough.
Don't monitor only profit. Track rejected orders, average entry deviation, stop modifications, position sizing adjustments, holding time, symbol changes, and the relationship between leader and follower equity. A provider who remains profitable while execution quality deteriorates can still become unsuitable for your account.
When Copying Becomes Riskier Than Trading Yourself
Copying becomes riskier than manual trading when the provider's edge no longer covers the costs and constraints imposed by replication. Use a strict test: if the leader's Sharpe ratio fails to beat your execution costs plus 2%, the copy arrangement lacks sufficient margin. If monthly returns fall below 3% for two cycles, pause rather than automatically adding another provider. If correlation between leaders rises above 0.7, treat the group as one strategy.
The funded economics matter too. With an 80% profit split, a copied leader must clear roughly 1.25 times the copier's solo hurdle to justify fee drag and additional rule exposure. That isn't a promise of profitability. It's a required compensation for the extra execution layer, provider risk, and account restrictions.
| Metric | Copy Trading Threshold | Manual Trading Threshold |
|---|---|---|
| Risk-adjusted edge | Sharpe must exceed execution costs plus 2% | Your own tested expectancy must cover costs |
| Monthly performance | Pause below 3% for two cycles | Review the strategy after the same deterioration |
| Leader correlation | Pause or reduce above 0.7 | Not applicable to a single manual strategy |
| 30-day drawdown | Pause above 4%, don't reallocate immediately | Reduce size and review execution |
| Account protection | Use hard equity and trade limits | Use hard daily and maximum drawdown limits |
Three structural failure modes
On a throttled cTrader server, a stale stop-loss replication can leave your position open after the leader has exited. During a news spike on DXtrade, your order can fill at a materially different price from the leader's. When multiple leaders trade the same session, rule stacking can turn several acceptable positions into one oversized directional bet.
Use this decision tree:
- Did the 30-day drawdown exceed 4%? Pause the leader. Don't reallocate the capital immediately.
- Did execution differ from the tested setup? Stop new copying and investigate fills, symbols, and platform logs.
- Did the provider change its method? Unfollow until the change is documented and retested.
- Did correlation rise above the cap? Reduce the group, not just the worst-looking leader.
- After the review, can the original risk thesis still be defended? Resume only if the answer is yes.
A disciplined exit ladder includes unfollow thresholds, a payout cadence aligned with the account's withdrawal schedule, and a post-evaluation checklist covering execution, drawdown, correlation, strategy changes, and rule compliance. A practical crypto risk management framework can add context for risk, volatility, and exposure controls, but it can't replace your account-specific limits.
Trading involves a risk of loss, and copy trading doesn't remove that risk. This article is educational and isn't financial advice.
MyFundedCapital offers Instant Funding plus 1-Step and 2-Step Challenges, with account sizes from $5K to $100K and scaling paths up to $500K, while supporting manual, algorithmic, and compliant copy trading on DXtrade and cTrader. Review the MyFundedCapital account types, match the rules to your allocation plan, and start a challenge only after your provider, platform, and drawdown controls have passed the checklist.