The engulfing pattern candlestick is common enough that it shouldn't be treated like a rare chart event. In one large backtest across 4,120 markets over 59 years, researchers found 426,665 engulfing occurrences, about 1 pattern every 37 candles, and the pattern confirmed as a reversal 67.3% of the time overall, with confirmation typically arriving within 2.9 candles (patternswizard.com). That makes it useful, but only if you trade it with context, not hope.
What an Engulfing Pattern Candlestick Actually Signals
An engulfing pattern candlestick is a two-candle reversal setup. The second candle's real body fully covers the first candle's real body, which tells you one side of the market has overpowered the other in a single session or bar. The wick overlap doesn't define the pattern, body-to-body engulfment does (capital.com).
Read the structure before you read the story
A bullish engulfing usually forms after a decline. The first candle is bearish, then a larger bullish candle opens at or below the prior close and closes at or above the prior open, so the buyer side has pushed price back through the earlier body (Investopedia). The bearish version is the mirror image after an advance, where a bullish candle is swallowed by a larger bearish candle and sellers take control (LuxAlgo).
Practical rule: treat the pattern as a sentiment pivot, not a promise of reversal. If it appears in the middle of nowhere, it's just two candles.
That's why I want you to read the setup in sequence. First ask whether the prior move was showing exhaustion. Then ask whether the second candle took back the prior body. Finally, ask whether the level matters, because the same two-bar structure at support means something very different from the same shape in chop.
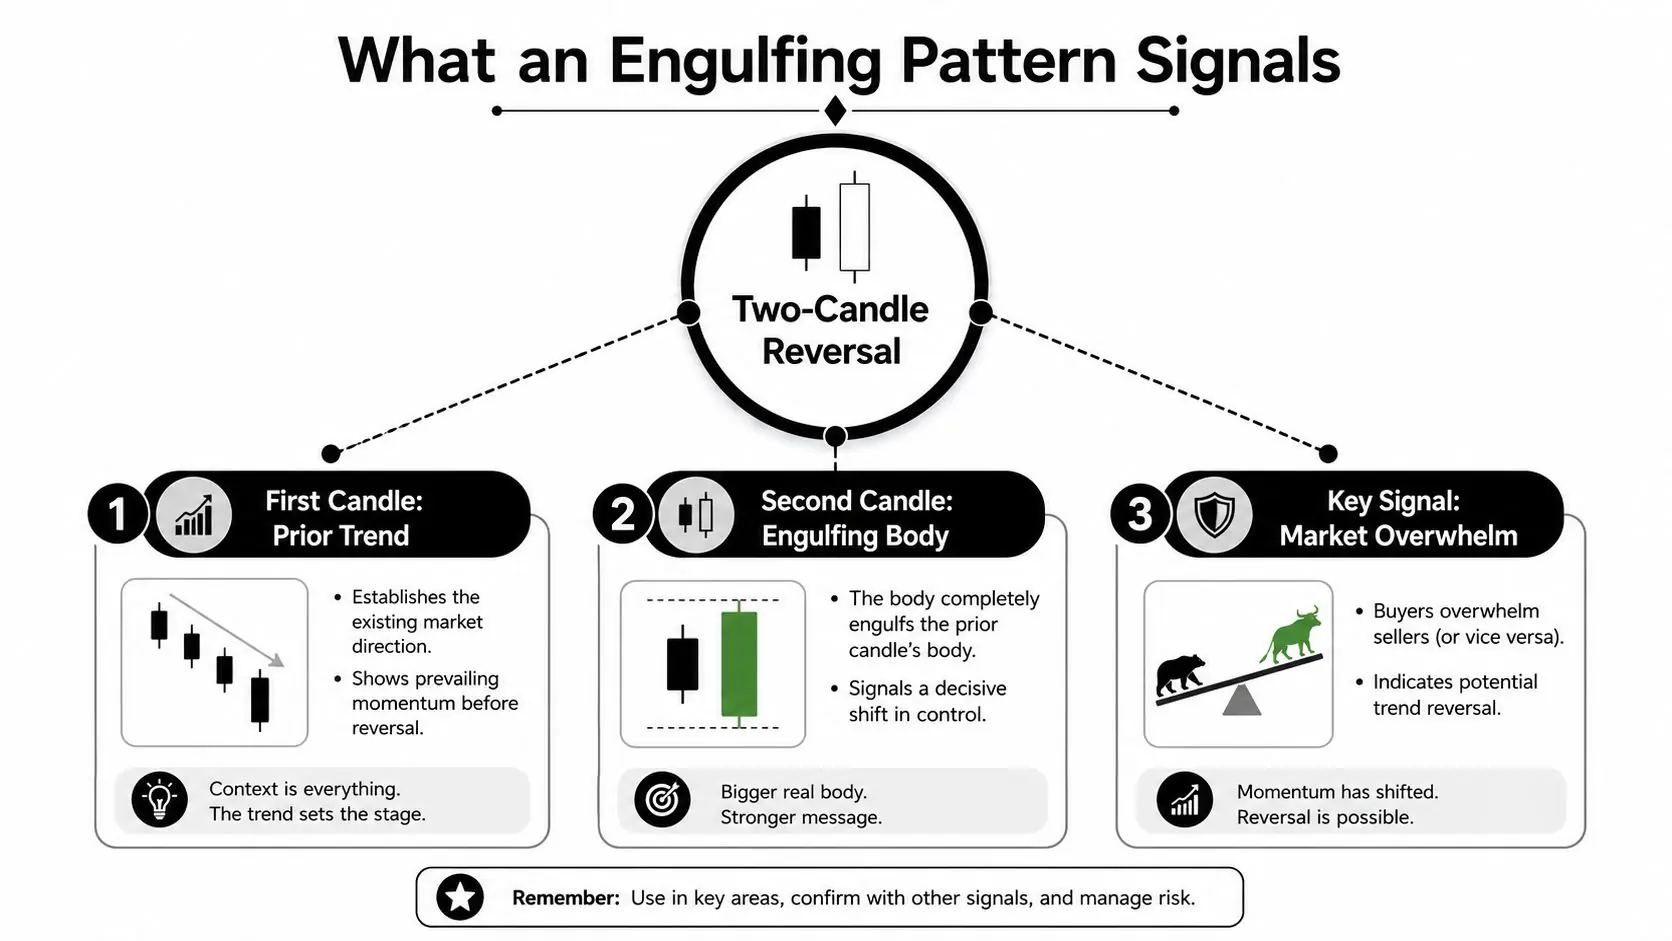
A concept map titled What an Engulfing Pattern Signals helps here, because the logic is simple. First candle, prior trend. Second candle, engulfing body. Key signal, market overwhelm. That is the whole story, and the chart either supports it or it doesn't. For a broader candlestick overview, this guide from MyFundedCapital's candlestick pattern breakdown adds useful context.
Bullish and Bearish Engulfing Identification Rules
Use a checklist, not instinct. Traders mislabel these patterns all the time because they focus on candle color and ignore the body relationship. The correct filter is strict enough to keep you out of junk signals, but simple enough to apply in seconds.
Bullish Engulfing Checklist
- Prior candle is bearish. The market needs a down-leg or pullback before the signal has meaning.
- Current candle is bullish. The second bar must show buyers taking over.
- Current open is at or below the prior close, current close is at or above the prior open. That's the body-to-body engulfment.
- The pair forms after a downtrend or at a demand zone. Location matters more than candle cosmetics.
- The engulfing body is meaningfully larger. In practice, a stronger second body carries more weight than a near-equal one.
Bearish Engulfing Checklist
Invert the same logic.
- Prior candle is bullish. Buyers were in control before the shift.
- Current candle is bearish. Sellers have to be the aggressor.
- Current open is at or above the prior close, current close is below the prior open. That confirms the body has been swallowed.
- The pair appears after an uptrend or at supply resistance. A bearish engulfing in the middle of a range is weak evidence.
- The second candle should dominate the first. If the bodies are nearly the same size, you're often staring at noise.
| Rule | Bullish Engulfing | Bearish Engulfing |
|---|---|---|
| Prior candle | Bearish | Bullish |
| Current candle | Bullish | Bearish |
| Body relationship | Second body fully covers first body | Second body fully covers first body |
| Best location | After a downtrend, near support | After an uptrend, near resistance |
| Weak version to avoid | Small body, doji-like second candle | Small body, doji-like second candle |
A stricter version some traders use demands the full range of the first candle sit inside the second candle's range, not just the body. That's a perfectly valid filter if you want fewer signals, but keep it consistent across your testing (IG).
Why Two Candles Can Flip Market Psychology
The pattern works because it shows a fight changing hands, not because two bars happen to look dramatic. The first candle is often the continuation candle, the one momentum traders trust. The second candle shows that the other side absorbed that pressure and forced price back through the prior body.
What trapped traders are doing
When price keeps moving in one direction, traders pile in, and stops usually sit just beyond recent extremes. The engulfing candle creates a clean failure point for the crowd that chased the move too late. If buyers were long into a bearish engulfing, they're suddenly holding losing positions. If sellers were short into a bullish engulfing, they're the ones trapped.
That unwind is why these candles can feel sharp in FX and CFD markets. Compresses the reaction, and thin liquidity can make the reversal look even cleaner than it would on a slower market. You're not just watching a candle change color, you're watching aggressive liquidity meet trapped positioning.
A good engulfing pattern often appears where the market has already done a lot of work. Extended legs, obvious round-number levels, and post-news spikes are where the crowd gets crowded.
That's the practical edge. A bearish engulfing near resistance matters because it tells you the rally lost sponsorship exactly where sellers wanted to engage. A bullish engulfing near support matters because it tells you bids absorbed the decline and pushed back hard enough to close beyond the prior body. The candle is the evidence. The level is the reason you care.
Entry, Stop Loss, and Take Profit Techniques
Execution is where most traders either protect the idea or ruin it. A valid engulfing setup still needs a trade plan before you click buy or sell. The candle gives you structure, but the plan decides whether that structure is tradable.
Aggressive and conservative entries
The aggressive entry is simple. You wait for the engulfing candle to close, then enter at the open of the third candle if the close confirmed the reversal direction. That keeps you aligned with the signal, but you may get a worse fill if price moves fast.
The conservative entry waits for price to revisit the pattern. That can mean a retest of the engulfing candle's midpoint, or a break back through the engulfing high or low depending on direction. It's slower, but it often improves reward-to-risk if the market gives you the pullback.
Stops, targets, and risk units
Your stop belongs beyond the engulfing candle's extreme. For a bullish setup, that means below the low. For a bearish setup, that means above the high. If price breaks that level, the setup has failed, and your trade thesis is gone.
For targets, use the next support or resistance, prior swing structure, or a measured move from the engulfing range. My own rule is simple, the candle range is the trade's risk yardstick. If the stop distance is too large for your position size, skip the trade rather than force it.
| Element | Bullish Setup | Bearish Setup |
|---|---|---|
| Aggressive entry | Third candle open after close confirmation | Third candle open after close confirmation |
| Conservative entry | Retest of engulfing midpoint or break of high | Retest of engulfing midpoint or break of low |
| Stop loss | Below engulfing low | Above engulfing high |
| Target idea | Next resistance or prior swing high | Next support or prior swing low |
For a broader risk-planning framework, the stop-loss and take-profit guide from MyFundedCapital is a useful companion. The key point is discipline, not creativity.
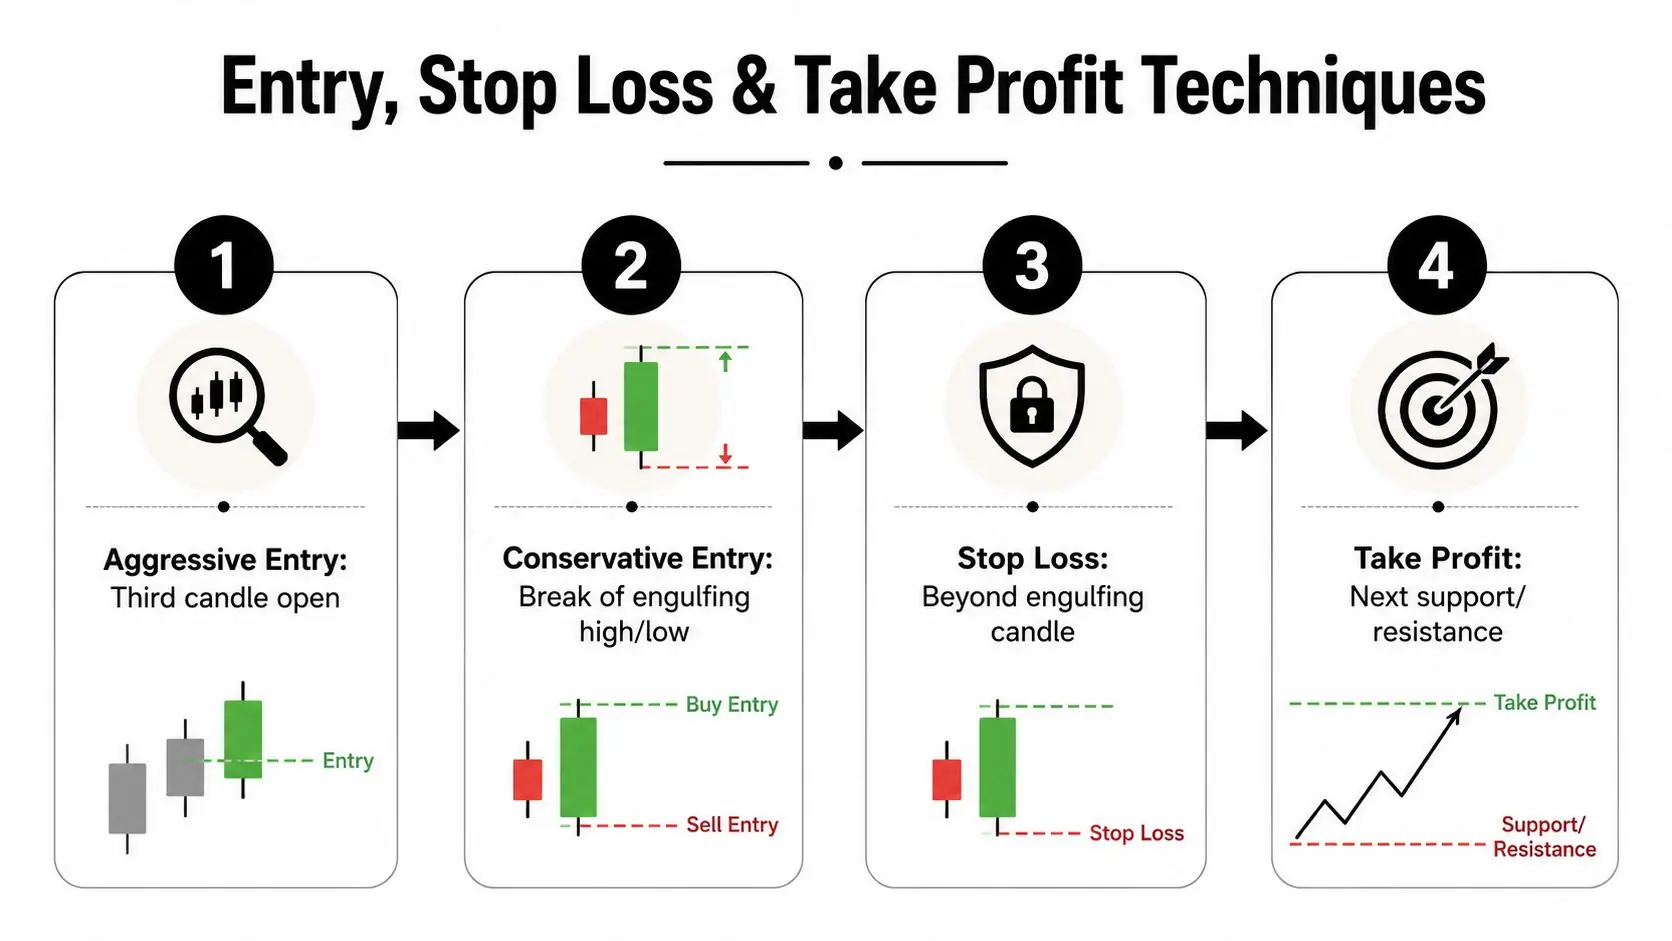
The chart flow is straightforward. Aggressive Entry, Third candle open. Conservative Entry, break of engulfing high or low. Stop Loss, beyond engulfing candle. Take Profit, next support or resistance. If you can't define those four points before entry, you're not ready to place the trade.
Confirmation Methods That Reduce False Signals
One confirmation is useful. Two confirmations are better. In choppy FX ranges, an engulfing pattern without support from price action or structure can fail quickly, so you want to stack evidence instead of guessing.
Start with the cheapest filters
Price confirmation is the lowest-friction filter. After the engulfing candle closes, the third candle should respect the new direction and close beyond the pattern's midpoint. If it immediately re-enters the prior body, the signal is weak.
Add volume and structure
On CFD platforms, you can use tick volume or platform-provided volume bars to see whether the engulfing candle printed a relative spike. That's not perfect, but it can help separate real participation from empty movement. For a deeper look at volume as a confirmation tool, see MyFundedCapital's volume trading explanation.
Structure is often the best second filter. A bullish engulfing at support, or a bearish engulfing at resistance, is cleaner than one floating in the middle of a range. If the setup also aligns with an RSI divergence, a 20-period EMA slope change, or an MACD histogram shift, the trade has more context.
- Price confirmation third candle closes beyond the engulfing midpoint.
- Volume confirmation the engulfing candle shows stronger participation than nearby bars.
- Indicator confirmation RSI, EMA slope, or MACD agrees with reversal direction.
- Structure confirmation the pattern sits on support, resistance, supply, demand, or a retracement level.
Don't load the chart with ten indicators and call that confirmation. Two good reasons are enough. Three is often more than enough.
Multi-timeframe alignment is the last layer. If the pattern appears on your trading timeframe and the higher timeframe shows a matching swing, the setup has more authority. If the higher timeframe is still pushing hard in the opposite direction, the engulfing candle is often just a pause.
Common Pitfalls and Backtesting Considerations
Most traders don't lose because the pattern is bad. They lose because they misdefine it, overtrade it, or test it badly. If you want to use engulfing patterns seriously, your first job is to remove ambiguity.
Mistakes that wreck results
The most common error is calling any larger candle after a smaller one an engulfing pattern. That's sloppy, and it pollutes your sample. The second mistake is ignoring the body rule and pretending wick overlap matters when your execution model never accounted for it.
Another trap is treating the setup like a reversal in a strong trend. In that environment, engulfing candles often function as continuation pauses rather than true turn signals. That's where a regime filter helps, such as checking volatility expansion or trend slope before you take the trade.
How to test it properly
Define the setup precisely before you test it. Decide whether you're using body-only engulfment or the stricter full-range version, then keep that definition fixed. After that, run the setup across multiple markets and regimes, not just your favorite pairs on pretty historical charts.
You also need to test outside the examples that look clean. Survivorship bias is brutal here, because traders remember the beautiful reversals and forget the failed ones. Out-of-sample validation matters more than cherry-picked wins.
| Common Pitfall | Mitigation Rule |
|---|---|
| Mislabeling any large candle as engulfing | Require strict body containment |
| Trading the setup in strong trend continuation | Use a regime filter before entry |
| Chasing only picture-perfect examples | Test across many market conditions |
| Curve-fitting entry offsets | Keep entries simple and robust |
If you're automating reviews or trade logging, even an internal workflow around trade data can help you stay honest. A useful companion example is custom AI for accounting, because the same discipline of structured inputs and clean records applies to trade analysis. The point is not automation for its own sake, it's cleaner decision-making.
Real Chart Examples for FX and CFD Traders
Real charts are where the pattern stops being theory. The same engulfing shape can mean very different things depending on timeframe, level, and session context. That's why you should train your eye to read the footprint, not just the candle color.
EUR/USD bearish rejection at resistance
On EUR/USD, a daily rally runs into a known resistance band. A small bullish candle prints first, then a larger bearish candle closes below that prior body and leaves a clear rejection wick above. The trigger bar is the next candle after the close, and the clean entry is below the bearish engulfing low if price confirms continuation.
The stop belongs above the pattern high, not just above the body. If price returns there, the rejection failed. A reasonable target is the prior daily swing low, because that's where the market has already shown interest before.
USD/JPY bullish engulfing at demand
On USD/JPY, price sells off into a weekly demand zone and prints a bearish candle followed by a larger bullish one that swallows the prior body. The cleanest trigger is either the close of the engulfing candle or a retest of its midpoint if the market retraces.
Here the session context matters. A bullish engulfing during active liquidity hours can react cleanly, while a late-session print may drift. If the move continues, you'll often see price challenge the prior swing high. If it fails, the market usually retests the opposite side of the engulfing body first.
A 4-hour CFD index example
On a 4-hour index chart, a bullish engulfing that aligns with a higher-timeframe trend filter can work as a continuation entry after a pullback. The candle structure is the same, but spread and session timing matter more on the CFD side than in spot FX. Around major opens, price can gap through your preferred entry, so the trigger needs to be defined before the session starts.
The failed setup is just as important as the winner. When an engulfing candle breaks the wrong side of its structure, it often tells you the move was only a pause, not a reversal.
That's the footprint you're learning to recognize. Sometimes the market continues through the prior swing after a brief pause. Sometimes it retests the opposite side of the engulfing body and then resumes. Both outcomes tell you the candle was real, but only one made the reversal hold.
Risk Disclosure and Putting It Together
Use the engulfing pattern as one piece of a complete plan. Scan for setups in the direction of the higher-timeframe trend, demand a trigger candle or another form of confirmation, and place stops beyond the engulfing extreme. Then size the trade so a stop-out doesn't damage your account.
CFD trading involves borrowed capital, and borrowed capital magnifies both gains and losses. That's why the pattern has to be treated as probabilistic, not predictive. A clean setup can still fail, and a failed setup doesn't mean your method is broken.
A simple session checklist keeps you honest:
- Identify regime trending, ranging, or choppy.
- Mark the level support, resistance, supply, or demand.
- Validate the candle body containment is exact.
- Check confirmation price, volume, indicator, or structure.
- Define the plan entry, stop, and target before execution.
- Log the trade record the setup so your backtest gets better over time.
If you want a straightforward way to apply that discipline in a funded environment, MyFundedCapital offers Instant Funding and 1-Step or 2-Step Challenge paths across FX, crypto, and commodities, which makes it a practical place to test whether your engulfing setup holds up under real risk rules.
Trading involves risk of loss, and no candlestick pattern removes that. If you want to practice this framework inside a structured prop setting, visit MyFundedCapital to compare funding programs, review account types, and decide whether a challenge or Instant Funding matches your trading plan.
Frequently Asked Questions
Is an engulfing pattern candlestick reliable on its own
No. It's a useful reversal clue, but it works better with trend context, support or resistance, and confirmation from price action or volume. In choppy conditions, standalone signals fail more often.
Should I trade wick engulfment or body engulfment
Use body engulfment as the core definition. Some traders add the stricter full-range rule, but that's a separate filter, not the base pattern.
What timeframe works best
The pattern can appear on any timeframe, but the higher the timeframe, the cleaner the structure usually is. Shorter charts need more confirmation because noise is higher.
Where should the stop go
For a bullish setup, below the engulfing low. For a bearish setup, above the engulfing high. If the market breaks that level, the pattern has failed.