

 AR
AR
 NL
NL
 FR
FR
 DE
DE
 ES
ES
 IT
IT
 PL
PL
 SV
SV
 PT
PT

You're probably looking at charts right now thinking the same thing most developing traders think: why do my entries always feel late? You buy after a push, price stalls. You short after a drop, price bounces. That's exactly where the Stochastic Oscillator helps.
Used properly, it's a clean momentum tool for timing pullbacks, filtering bad reversals, and building tighter entries without guessing. Used badly, it becomes a machine for overtrading. Trading involves risk of loss, and this article is educational only, not financial advice.
What Is the Stochastic Oscillator and Why Use It
The Stochastic Oscillator helps you answer one question fast: did price close near the top or bottom of its recent range? That matters because momentum often shifts before price fully turns, especially in slower pullbacks and range conditions.
George Lane developed the stochastic oscillator in the late 1950s, and the standard 14, 3, 3 setting has remained the default on major platforms for over 60 years. In range-bound markets, prices reversed within 3 to 5 sessions after crossing the 80/20 boundaries in approximately 68% of cases across major forex pairs, according to Britannica's overview of the stochastic oscillator.
What the two lines mean
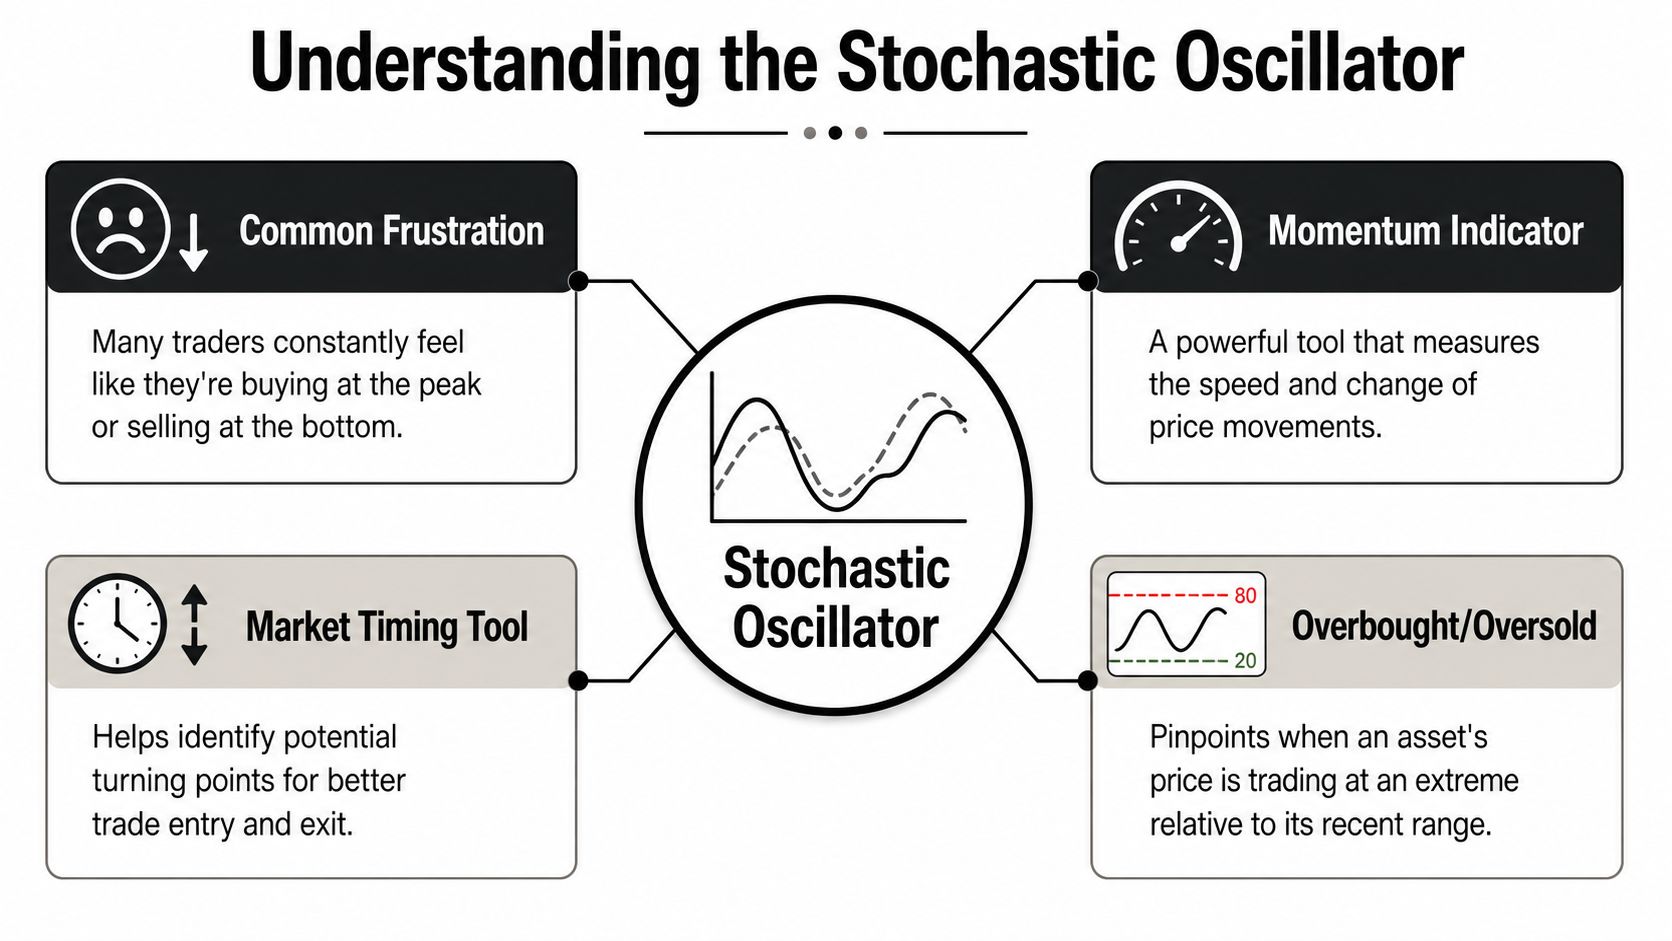
The indicator has two lines:
- %K line is the faster line. It tracks where the current close sits inside the recent high-low range.
- %D line is the slower line. It's a simple moving average of %K and acts as a confirmation line.
The standard formula is %K = 100 × (C – L14) / (H14 – L14), which keeps the reading between 0 and 100, as explained in CMC Markets' stochastic indicator guide.
Why traders keep using it
A lot of indicators tell you trend. Fewer help you time entry inside that trend. That's where stochastic earns its place.
If you already understand support, resistance, and price structure, stochastic becomes more useful because it adds timing to your chart work. If you need a refresher on the building blocks, this guide to forex technical analysis basics is a solid starting point.
Practical rule: Don't use stochastic to predict every reversal. Use it to measure momentum at places on the chart that already matter.
Reading the Signals Overbought Oversold and Divergence
Most traders learn stochastic in a shallow way. They hear “above 80 means sell” and “below 20 means buy,” then they start fading every strong move. That's the fast way to take unnecessary losses.

Overbought and oversold
A stochastic reading:
- Above 80 signals overbought
- Below 20 signals oversold
Those thresholds are the core mechanics of the indicator, and traders should only look for buy signals when %K crosses above %D below 20, and sell signals when %K crosses below %D above 80, as outlined in FP Markets' stochastic trading guide.
That said, overbought does not mean “must fall now.” Oversold does not mean “must bounce now.” It means price is stretched relative to its recent range.
An overbought stochastic reading is a warning flag, not an automatic short.
Why traders get trapped in strong trends
People often blow good trades. They see stochastic above 80 and assume the move is done, even when price is trending cleanly above structure.
A common pitfall is exiting too early in strong trends. Stochastics can remain above 80 for 30+ bars during bull markets, which makes the tool better as a pullback timer than a blind reversal trigger, according to Indicators101's discussion of strong-trend behavior.
If you trade funded-style rules or any account with tight loss limits, this matters a lot. Fading momentum over and over can stack losses fast.
Divergence is the signal worth your attention
Divergence happens when price and the oscillator stop agreeing.
Two forms matter:
- Bullish divergence means price prints a lower low, but stochastic prints a higher low
- Bearish divergence means price prints a higher high, but stochastic prints a lower high
That mismatch tells you momentum is weakening, even if price hasn't fully turned yet. It's one of the better ways to avoid taking every random crossover.
If you want to get better at spotting that mismatch on live charts, this divergence trading guide is worth studying alongside your chart replay work.
What divergence should look like
Use this quick screen:
- Clear swing points matter more than tiny intrabar wiggles
- Price structure should be obvious without zooming in too far
- Location matters. Divergence at support, resistance, or after an extended move is stronger than divergence in the middle of nowhere
- Confirmation should still come from price or crossover behavior, not from divergence alone
Building Entry and Exit Rules With the Stochastic Oscillator
The Stochastic Oscillator only becomes useful when you turn it into rules. Not opinions. Not vibes. Rules.
A lot of traders improve when they stop asking whether stochastic is “good” and start asking whether a specific setup is present or absent.
Strategy one, trend-aligned crossover
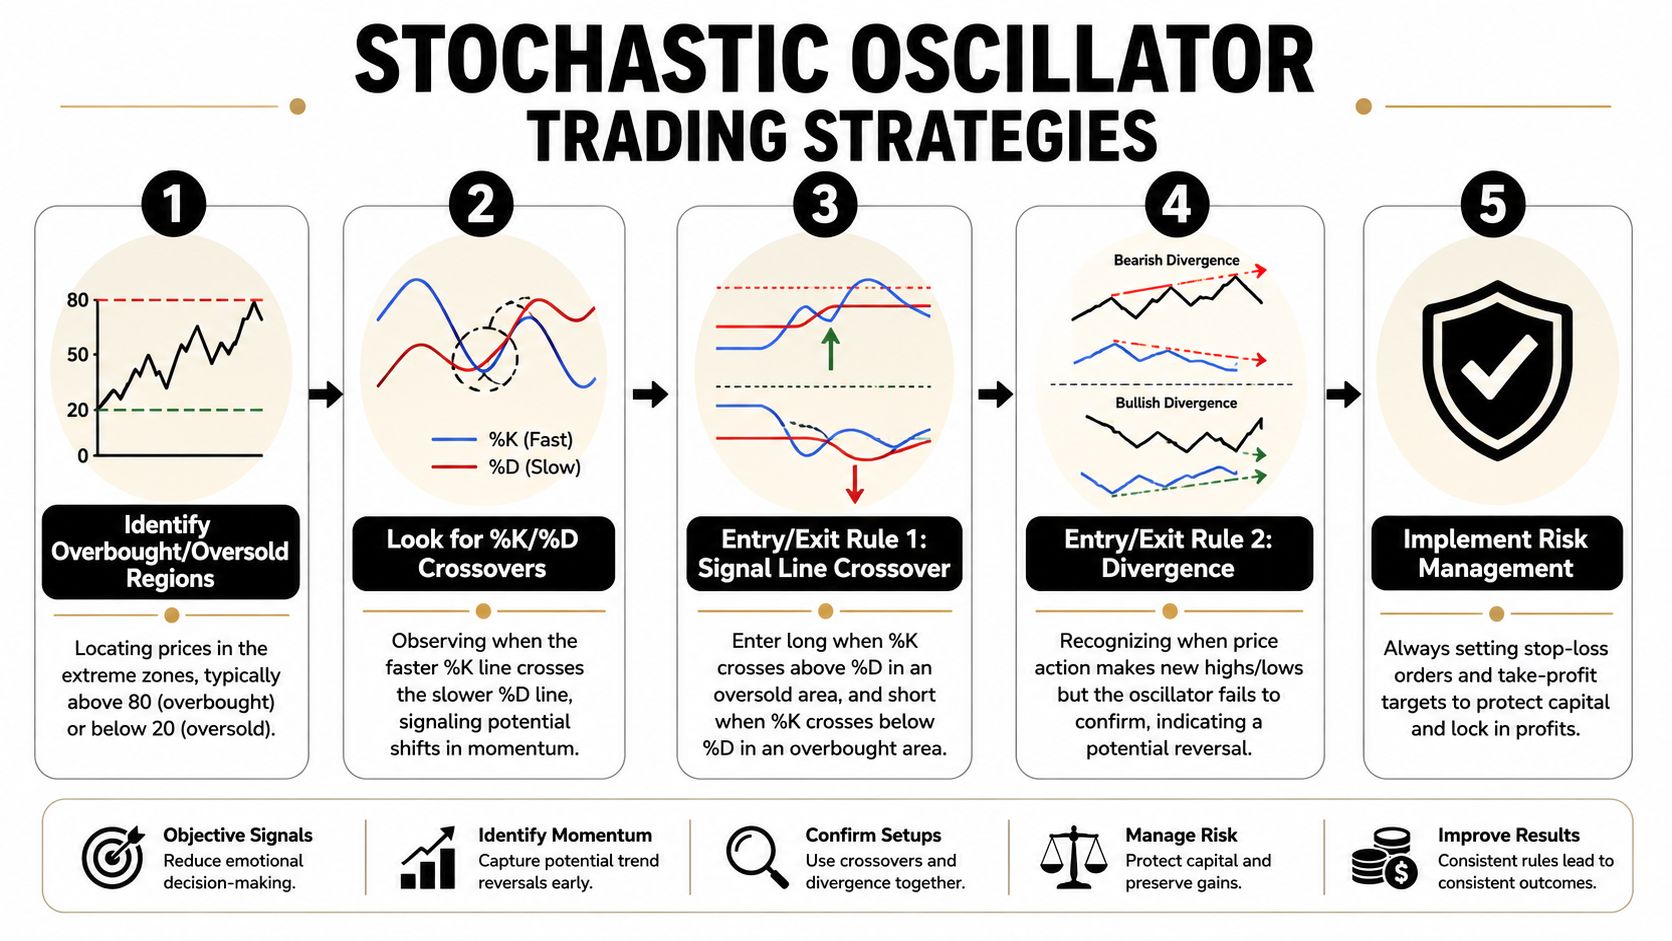
The cleanest beginner-to-intermediate use of stochastic is a trend-aligned crossover. You're not trying to call tops and bottoms. You're looking for a pullback entry in the direction of the larger move.
When daily price is above the 100-day SMA, buy signals from stochastic crossovers below the 20 level showed a 62% success rate with an average profit-to-loss ratio of 1.8:1, according to OANDA's stochastic strategy research.
Long setup checklist
Market condition
Daily price is above the 100-day SMA. You only want longs.Setup
Price pulls back into support or into a recent value area. Stochastic moves below 20.Entry trigger
%K crosses above %D while below 20.Stop loss placement
Put the stop below the recent swing low or below the structure level that invalidates the setup.Take profit target
First target can be the prior swing high, resistance, or a fixed structure-based target that preserves a sensible reward relative to your risk.
Short setup checklist
If price is below the trend filter, flip the logic:
- Wait for a rally
- Let stochastic move above 80
- Take the bearish crossover only when it lines up with market structure and your downside thesis
Strategy two, divergence entry with confirmation
Divergence is slower than a raw crossover, but it often keeps you out of weaker trades. It's especially useful near exhaustion points and after extended one-sided moves.
A bearish example looks like this:
| Part | What you want to see |
|---|---|
| Market condition | Price is pushing into resistance or extending after a strong run |
| Signal | Price makes a higher high, stochastic makes a lower high |
| Entry trigger | Wait for bearish confirmation such as a rejection candle or bearish crossover |
| Invalidation | Above the high that created the divergence |
| Exit idea | Prior support, midpoint of the move, or a measured pullback target |
A bullish divergence setup is the mirror image at support.
Don't enter just because the lines crossed. Enter because the crossover happened in the right place, in the right context, with a level that gives you a clean invalidation.
A simple candle filter that improves discipline
One way to avoid weak stochastic entries is to force price action to prove itself first. A practical 5-point checklist is:
- Zone exit. Both stochastic lines must exit the overbought or oversold zone
- Direction match. The first two candles must agree with the intended trade direction
- Candle quality. Those candles should have shorter wicks than bodies
- Timing. Entry happens at the open of the third candle only if the conditions still hold
- Discipline. If one condition is missing, skip the trade
That checklist comes from this detailed trader breakdown on candle confirmation with stochastic, and the reason it helps is simple: it stops you from trading indecisive momentum.
Managing Risk Like a Prop Trader Using the Stochastic
If you trade under prop-style rules, the Stochastic Oscillator should mostly help you do one thing: enter cleaner pullbacks with defined risk. It should not turn you into a hero trying to catch every market turning point.
That matters even more when the account has a flat 5% daily loss limit. A trader can be right on the week and still fail the day by forcing countertrend reversals that never confirm.
Why pullback entries beat blind reversals
In a prop environment, trend pullbacks are usually safer because they give you:
- Cleaner invalidation around recent swing structure
- Smaller stops than chasing breakouts late
- Fewer emotional trades than trying to fade strong momentum
- Better account protection when you're managing strict daily drawdown rules
Countertrend trades can work, but they need more proof. If the only reason for entry is “stochastic is overbought,” that's not enough.
The job isn't to predict every turn. The job is to survive long enough to keep trading your edge.
Add confirmation before you commit risk
A sound approach is to wait for stochastic to exit an extreme zone, then require a MACD crossover in the same direction before entry. For example, after stochastic exits overbought, a bearish MACD crossover can filter weaker sells and helps structure trades around a minimum 1:2 risk-to-reward ratio, based on this MACD and stochastic confirmation method.
That extra layer slows you down in a good way.
Use a simple decision process:
- If trend is clear, use stochastic for pullback timing
- If the market is messy, reduce size or stand aside
- If stochastic fires but MACD or price structure disagrees, skip it
- If your stop is too wide for the day's risk budget, there is no trade
For traders trying to stay consistent under evaluation-style rules, this guide to forex risk management covers the mindset and process that matter more than any single indicator.
What usually goes wrong
Most losses tied to stochastic come from three habits:
- Taking every crossover
- Trading against strong momentum
- Sizing up because the setup looks perfect
No setup is perfect. Protecting capital matters more than squeezing one more trade out of the session. Trading involves risk of loss, and no indicator removes that.
How to Add the Stochastic Oscillator on cTrader DXtrade and MT5
Once you know how to use stochastic oscillator logic, setup should take less than a minute. Keep it simple. Start with the default 14, 3, 3 configuration and the standard 20/80 levels.

On cTrader
- Open your chart for the instrument you want to analyze
- Click Indicators
- Search for Stochastic Oscillator
- Add it to the chart
- Check the inputs and confirm the default setting is 14, 3, 3
- Verify levels at 20 and 80
On DXtrade
- Load the chart
- Open the indicators menu
- Find Stochastic
- Apply the indicator
- Review parameters so the lookback and smoothing match the standard setup
- Save the layout if this is part of your regular workspace
On MT5
- Open the chart window
- Go to Insert, then Indicators
- Choose Oscillators
- Select Stochastic Oscillator
- Confirm the settings before clicking OK
- Check the sub-window below price to make sure both lines and the 20/80 bands display correctly
Keep the first version boring
Don't start by customizing everything.
Use the standard setup first because:
- You need consistency before optimization
- Most educational examples use the default
- Changing settings too early makes chart review messy
If your chart is cluttered, strip it back to price, one trend filter, and stochastic. That's enough to learn timing without drowning in indicators.
Stochastic Oscillator Frequently Asked Questions
What's the difference between the Stochastic Oscillator and RSI
They both help traders spot stretched conditions, but they don't read momentum in exactly the same way. Stochastic compares the close to the recent high-low range, while RSI focuses on the speed of recent gains and losses.
In practice, stochastic is often sharper for pullback timing and crossover-based entries. RSI can feel smoother. If you're choosing one for execution timing, stochastic usually gives more explicit trigger behavior.
What timeframes work best for stochastic
It works on multiple timeframes, but the key is matching it to context. On lower timeframes, it reacts faster and can throw more noise. On higher timeframes, signals are slower but often cleaner.
A practical approach is to define trend on a higher chart and use stochastic on your execution chart for entries. If you use it on a very low timeframe without structure, you'll usually get chopped up.
Does stochastic work better on certain markets
It tends to behave best in liquid markets and in environments where price rotates between clear ranges or pulls back cleanly within a trend. It's still usable on forex, indices, commodities, and crypto, but fast-moving instruments can produce more false signals if you don't wait for confirmation.
That's where candle confirmation helps. A practical checklist is to wait for both stochastic lines to exit the extreme zone, then require the first two candles to match the intended trade direction with short wicks, and only enter at the open of the third candle if all conditions line up.
What's the biggest mistake beginners make with stochastic
Treating it like a reversal button.
The better approach is simple:
- Use it with structure
- Trade fewer signals
- Prefer pullbacks over guesses
- Define the stop before the entry
- Skip anything that doesn't fit your rules
If you do that, the indicator becomes useful. If you don't, it becomes noise.
Trading involves risk of loss. This article is educational only and not financial advice.
If you want to put this into practice under clear rules, explore MyFundedCapital and compare its funding programs, account types, and challenge options. It's a practical way to test your stochastic-based process in a structured environment where risk limits, discipline, and execution matter.
