You're probably looking at trade setups right now and asking a simple question that feels harder than it should: is this trade worth taking? That's where risk reward ratio helps. Once you understand it, you stop judging trades by excitement and start judging them by structure.
Trading involves risk of loss, and this article is educational only, not financial advice.
Understanding the Risk Reward Ratio
You spot a setup that looks clean. Price is near your entry, the chart looks strong, and the trade feels promising. Then a better question cuts through the excitement. If this idea fails, how much does it cost you, and if it works, is the payoff large enough to justify that risk?
That question is the risk reward ratio.
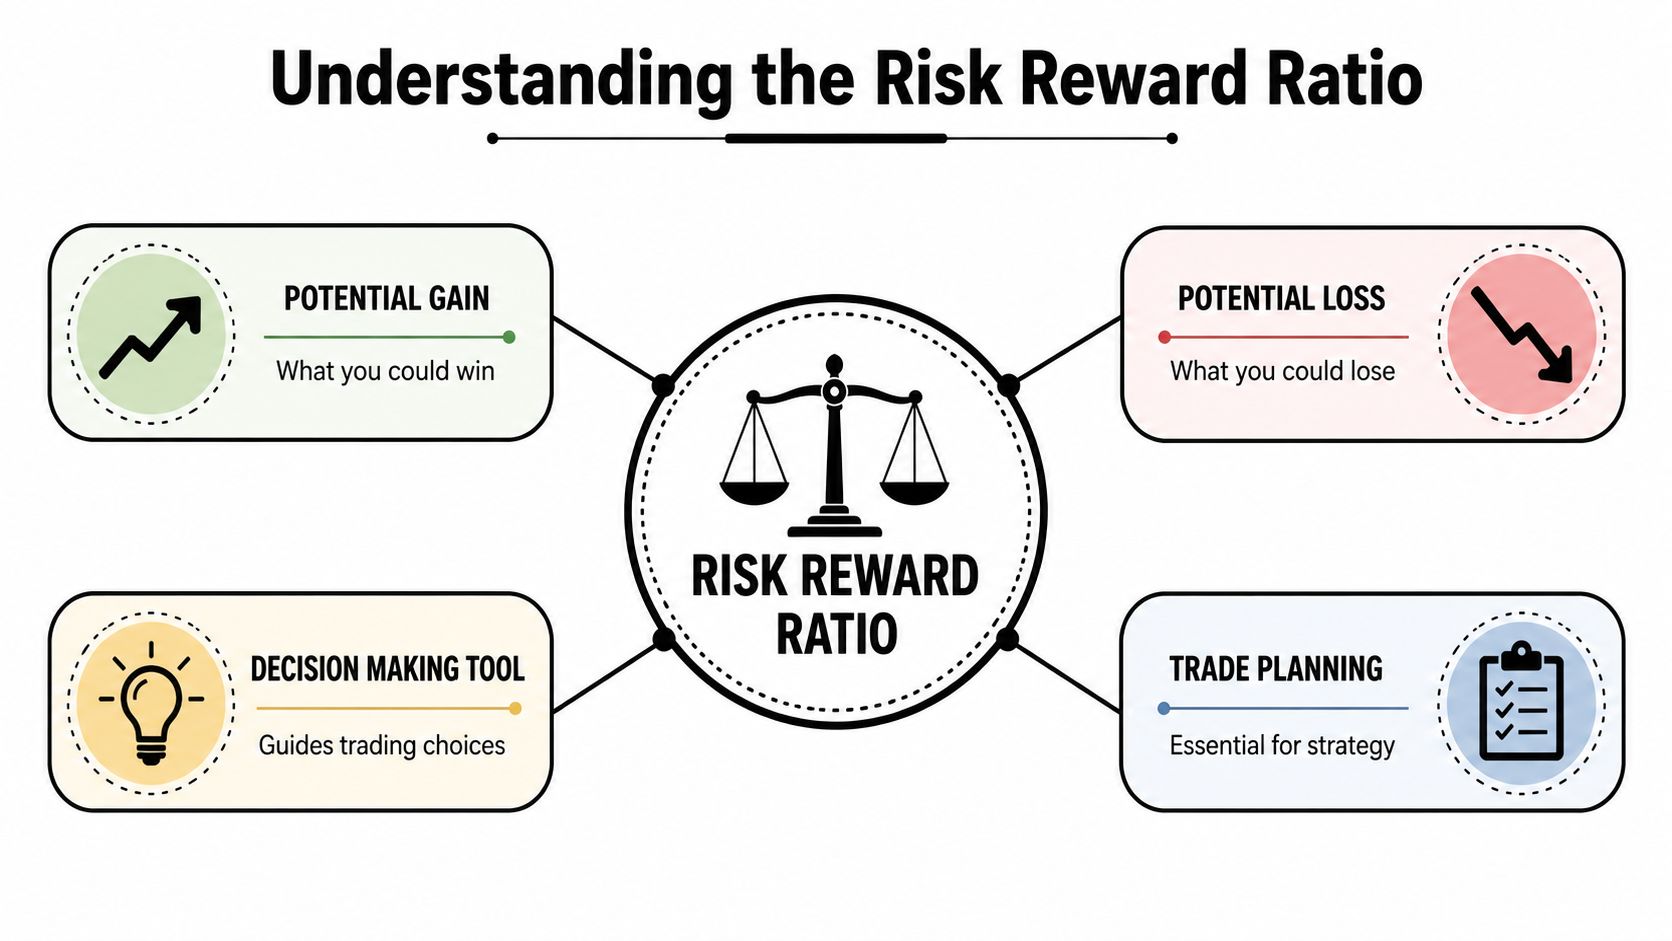
What is risk reward ratio? It is the comparison between your planned loss and your planned profit on a trade before you enter. In practice, it answers whether the trade gives you enough upside for the downside you are accepting.
Definition: The risk-reward ratio compares the money you could lose to the money you could make on a position, using three planned prices: entry, stop-loss, and take-profit.
The three prices that define the trade
Every ratio starts with three planned prices:
- Entry price is where you plan to open the trade
- Stop-loss is where the trade is proven wrong
- Take-profit is where you plan to exit with a gain
Those three numbers give the trade its shape. The distance from entry to stop is your risk. The distance from entry to target is your reward.
A simple example makes it clear. If you risk $100 to pursue $300 in profit, the setup is 1:3. You are risking $1 to try to make $3, as explained in this overview of the risk-reward ratio.
Why traders care about it
Risk reward ratio works like the price tag on a business decision. Before you commit capital, it tells you what the trade is asking from you and what it may give back.
That matters even more in a prop firm environment. At MyFundedCapital, a trader is not judged only by how much a winning trade can make. Drawdown control matters too. A setup with a wide stop and limited upside can damage your daily or overall loss limits even if the idea looked good at first glance. A solid ratio helps you choose trades that fit the account's rules, not just trades that look exciting on the chart.
There is one point that often confuses newer traders. A lower ratio number, such as 0.5, means the potential reward is larger than the risk. A higher ratio number, such as 2.0, means you are risking more than you stand to make. As noted by Trade With The Pros, that is why traders often prefer setups such as 1:2 or 1:3 over 1:1.
If your stop and target levels still feel arbitrary, this guide on stop-loss and take-profit placement helps connect the ratio to actual chart structure.
One more practical point. Risk reward ratio is a planning tool, not a guarantee. It does not predict whether the trade will win. It helps you filter for trades where the upside justifies the downside, which is exactly the kind of discipline prop firm traders need.
For readers who also study decision-making frameworks in other markets, you can explore advanced DeFi liquidity management and compare how structured risk planning shows up outside discretionary trading too.
A trade idea isn't complete until the downside is defined.
How to Calculate Your Risk Reward Ratio Step by Step
You spot a clean setup, click buy, and then hesitate. Where does the stop go? Where should the target be? If those two levels are unclear, the trade is still half-built.
The calculation itself is simple. The hard part is staying logical while price is moving.
Start with the formula
Use:
Reward / Risk
That means:
- Risk = the distance from your entry to your stop-loss
- Reward = the distance from your entry to your take-profit
A trade with $300 of potential upside and $100 of downside has a 3:1 reward-to-risk ratio, as explained in Capital.com's guide to risk-reward ratio calculation.
A small but important detail trips up many newer traders. You are measuring distance, not emotion. The chart does not care how confident you feel about the setup.
Follow the steps in this order
Order matters here. If you start with the target because you want a bigger payout, you can end up forcing a trade that does not fit the chart or your account rules.
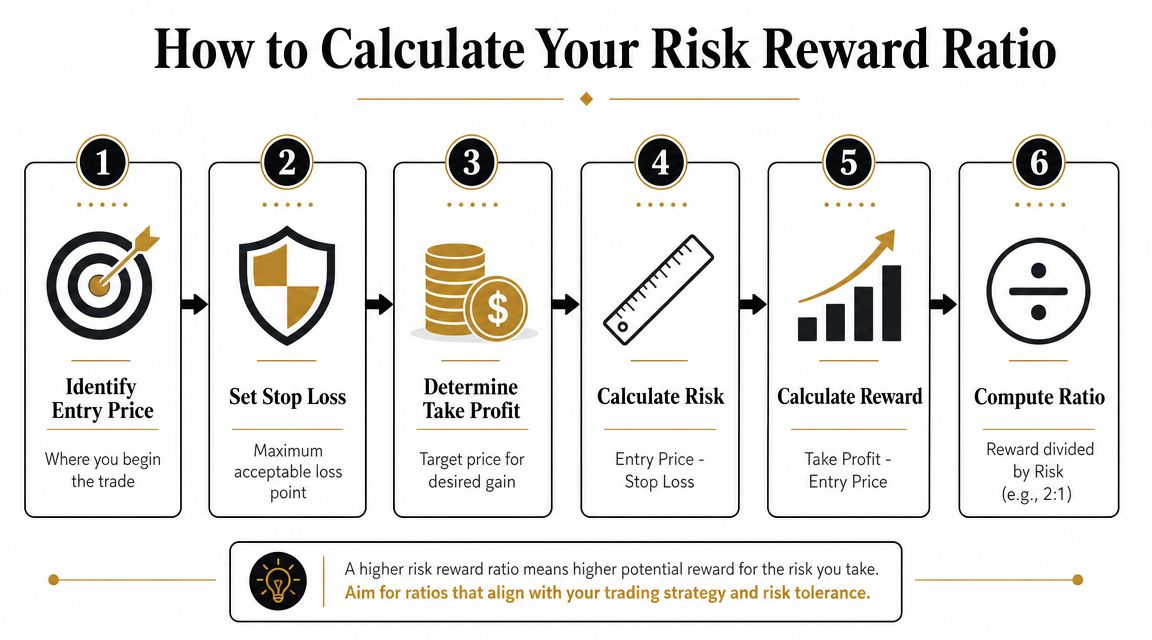
Mark your entry
Choose the price where your setup becomes valid.Set the stop-loss first
Place it at the level where the trade idea is proven wrong, not at a random dollar amount.Set the take-profit
Choose a target based on a realistic price move, such as the next resistance zone, support level, or measured move.Measure the risk distance
Count the distance from entry to stop. In forex, that may be pips. In stocks, it may be dollars. In futures, it may be points or ticks.Measure the reward distance
Count the distance from entry to target using the same unit.Divide reward by risk
If the target is 60 points away and the stop is 20 points away, the ratio is 3:1.
That is the full calculation.
Put it on a chart
Say you are planning a long trade on EUR/USD at 1.1000.
- Your stop-loss is at 1.0980
- Your take-profit is at 1.1060
Your risk is 20 pips. Your reward is 60 pips.
60 / 20 = 3, so the trade has a 3:1 reward-to-risk ratio.
A tape measure works as a useful comparison here. You are not guessing whether one side is bigger. You are measuring both sides before you commit money.
Why this matters more in a prop firm account
In a personal account, a poor ratio hurts your results. In a prop firm account like MyFundedCapital, it can also push you closer to daily or overall drawdown limits.
That changes how you should use this calculation. You are not only asking, “How much can I make?” You are also asking, “Does this setup justify the amount of account risk it consumes?” A trade with a weak target and a wide stop can use up too much room even if the idea looks attractive on the chart.
Use the ratio as a pre-trade filter
Once you know how to calculate it, the ratio becomes a decision tool:
- Check whether the stop placement makes technical sense
- Check whether the target is realistic
- Reject trades that need a forced target to look attractive
- Keep position risk aligned with prop firm drawdown rules
Discipline manifests in practice. Good traders do not calculate the ratio after entering. They calculate it before the order goes live.
If you also trade on-chain markets or want another lens on structured market risk, it can help to explore advanced DeFi liquidity management and compare how liquidity, execution, and planning affect trade outcomes in different environments.
Connecting Risk Reward Ratio with Win Rate and Expectancy
A common beginner mistake is treating risk reward ratio like a score. It isn't. A trade with a high ratio isn't automatically good, and a trade with a modest ratio isn't automatically bad.
Profitability depends on both the ratio and your win rate. TechTarget's explanation of the risk-reward ratio makes this point clearly: a 1:1 profile usually needs a win rate above 50% to overcome costs, while a 1:3 profile can stay profitable with a materially lower hit rate because one winner can cover several losers.
Why the ratio alone can mislead you
A lot of traders chase a bigger target because a bigger target makes the spreadsheet look better. The problem is that charts don't pay you for neat math. They pay you when price reaches the target.
If you push your take-profit too far away just to improve the ratio, you may lower your win rate. That can ruin the trade idea even though the planned ratio looks impressive on paper.
Practical rule: A better-looking ratio means nothing if the market rarely reaches your target.
There's another trap. Some traders tighten their stop-loss too much to create a larger reward-to-risk figure. The math improves, but the stop gets clipped by normal price movement. The source above also notes that over-tight stops can improve the ratio mathematically while increasing stop-out probability and hurting realized expectancy.
Break-even thinking matters more than ratio worship
Use the ratio to ask a better question: how often does this setup need to work to justify the losses when it doesn't?
A simple way to understand it is:
| Risk:Reward Ratio | Break-Even Win Rate |
|---|---|
| 1:1 | Above 50% |
| 1:3 | Materially lower than a 1:1 setup |
This table is intentionally short because those are the only break-even relationships supported by the verified data. Even with that limited set, the lesson is strong. A strategy can survive a lower hit rate if each winner is meaningfully larger than each loser.
Expectancy is the real target
Expectancy is the combined effect of:
- How much you make when you win
- How much you lose when you lose
- How often each outcome happens
That's what separates sustainable trading from random trade-taking.
A trader with a modest ratio and strong execution can outperform a trader who chases huge targets and rarely gets paid. When you evaluate setups this way, you stop asking, “Is 1:3 always best?” and start asking, “Does this setup produce positive expectancy when traded consistently?”
That's a much better question.
How to Choose a Ratio for Your Trading Style
There isn't one perfect answer to what is risk reward ratio in practice, because the “right” ratio depends on how you trade. A scalper and a swing trader don't face the same chart conditions, the same holding time, or the same execution problems.
Two traders can both be right
A short-term trader may take quicker moves and accept a lower reward relative to risk if the setup wins often and exits fast. A swing trader may hold longer and target a larger move because the structure gives the trade more room.
Neither approach is automatically superior. What matters is whether the ratio fits the behavior of the setup.
Questions to ask before choosing a target
Use these as a decision filter:
How long do you usually hold trades
Short holding periods often limit how far price can realistically travel.What does the chart structure allow
Your target should sit where price has a believable path, not where your spreadsheet looks nice.How reliable is the setup
A setup that wins often may not need an aggressive target. A setup that triggers less often may need a larger payoff when it works.How precise is your position sizing
Your lot size changes how much money sits behind the chart distance. If you need a refresher, review what lot sizing means in practical risk control.
Don't copy someone else's ratio
Many traders often err here. They hear that “good traders use 1:3” and start forcing every setup into that mold.
That usually creates one of two problems:
- targets that are too far away to hit consistently
- stops that are too tight to survive normal movement
The best ratio is the one your strategy can actually deliver in live conditions.
A useful standard is simple: choose a ratio that matches your setup, then track real results. If your planned ratio and your actual outcomes keep drifting apart, the issue isn't the formula. It's your execution, your exits, or your analysis.
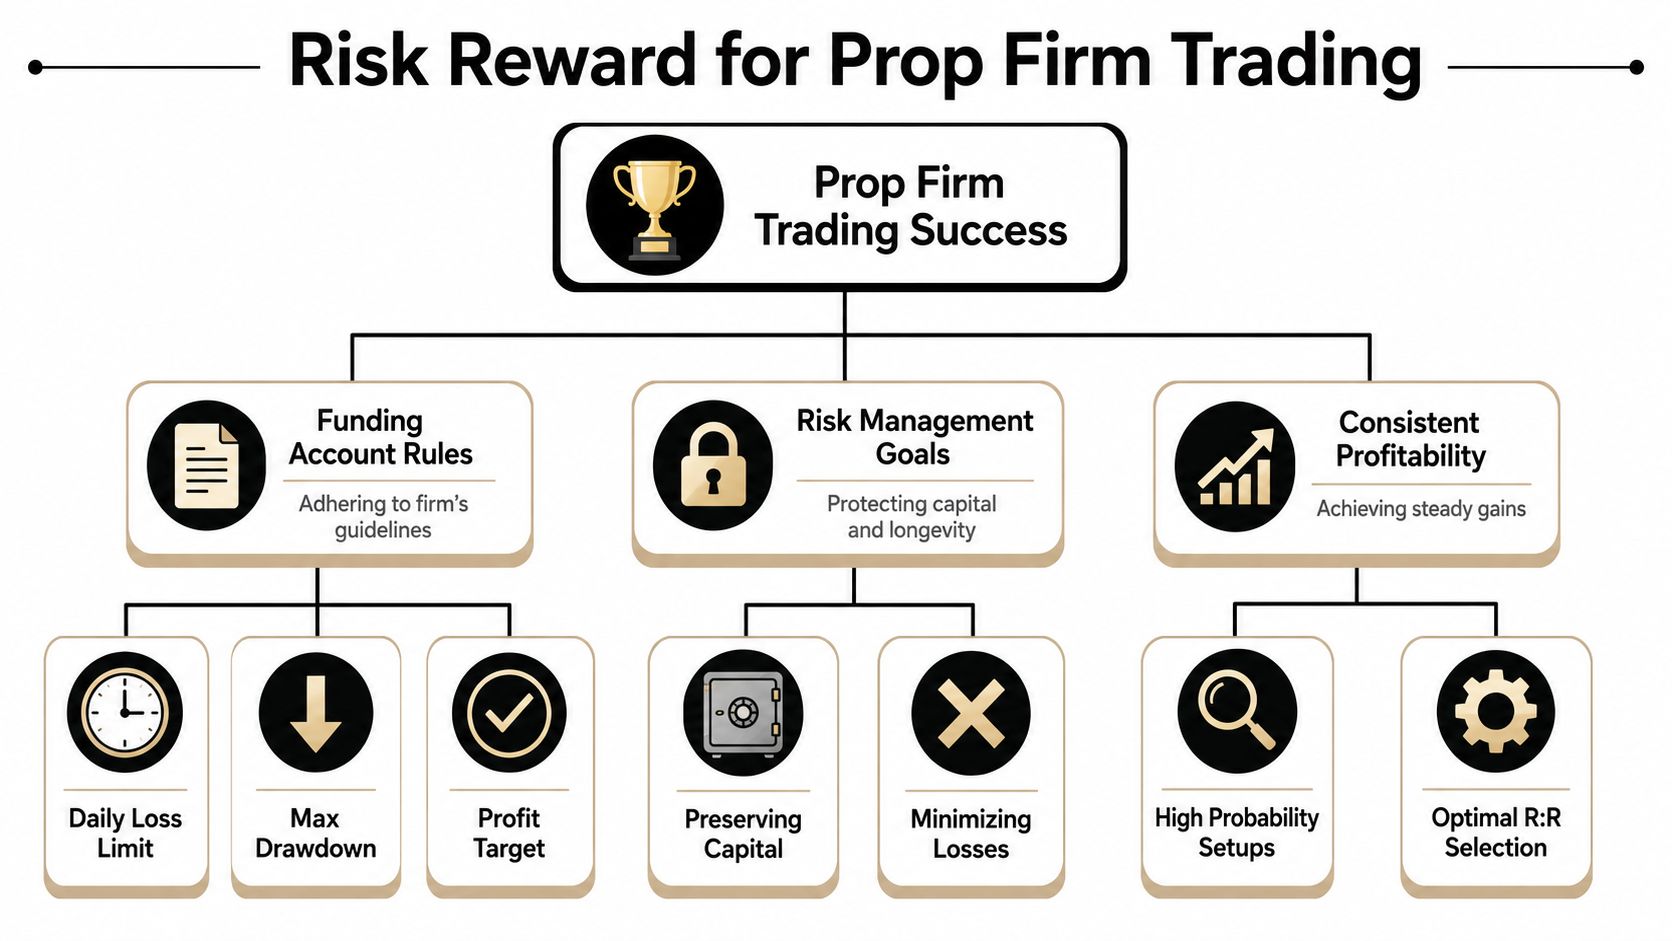
Using Risk Reward for Prop Firm Trading Success
In a prop environment, risk reward ratio takes on a different role. You're not only managing a trade. You're managing the survival of the account.
That changes the question from “Is this setup attractive?” to “Does this setup fit the account rules and leave room for normal losing streaks?” This distinction matters because broader risk literature separates trade-level ratios from account-level return-versus-drawdown thinking, especially where max daily loss, maximum drawdown, and path dependency matter, as described in this overview of risk return ratio concepts.
Trade-level logic can fail at the account level
A single trade can have a clean reward-to-risk profile and still be a poor decision for a funded account.
Why? Because prop trading includes hard limits. The publisher of this article, MyFundedCapital, operates with a 5% daily loss limit and up to 10% maximum drawdown in its published account framework. Those guardrails force you to think beyond one setup.
A trade that looks fine in isolation may become dangerous if:
- You size it too large and leave no room for a second loss
- You stack correlated positions that can fail together
- You take lower-quality setups late in the session after already taking damage
- You ignore path dependency and assume the account can absorb losses in any sequence
Think in sequences, not single trades
Prop traders need to plan for clusters of outcomes. That means your risk reward ratio should fit your account plan, not just your chart.
A practical approach:
Start with account survival
Decide how much room you need to stay comfortably inside the daily loss and drawdown rules.Size the trade from that limit
Position size comes after risk planning, not before.Take only setups that justify the risk used
If you're consuming meaningful account risk, the setup should earn that privilege.Track drawdown behavior, not just win rate
Two traders can have similar trade results and very different account curves.
This account-level mindset is also why institutional firms place high importance on process. If you want a sense of how firms evaluate the people behind systematic trading operations, this look at hiring quant trading professionals gives useful context on the skills and discipline serious trading environments value.
The real objective in a funded account
The goal isn't to maximize the ratio on every trade. The goal is to stay in the game long enough for your edge to play out.
That means a slightly less exciting setup with controlled downside can be better than an aggressive trade with a flashy target. In prop trading, consistency and drawdown control often matter more than squeezing every chart for the largest theoretical payoff.
Common Risk Reward Ratio Mistakes to Avoid
Most mistakes with risk reward ratio don't come from bad arithmetic. They come from bad behavior.
SmartAsset's discussion of the risk-reward ratio highlights an important nuance: the ratio is only half the decision. Win rate matters too, and chasing very high targets can reduce fill quality and hurt results in fast markets.
The mistakes that quietly damage performance
Don't force every trade into the same ratio
A clean setup should define the levels. If you force the chart to fit your preferred number, you'll place unrealistic stops or targets.Don't chase a huge target just to impress yourself
A bigger target can make the planned ratio look better while reducing the chance of getting paid.Don't widen your stop after entry
Once you move the stop farther away, the original risk calculation is no longer true. You changed the deal after taking it.Don't ignore win rate
A strategy with a lower-looking ratio can still work if it wins often enough. A strategy with a great-looking ratio can still fail if it rarely reaches target.
The disciplined alternative
Use the ratio as a filter, not as decoration.
If the stop doesn't make technical sense or the target isn't realistic, skip the trade.
That single habit will save you from a lot of avoidable damage. Good traders don't try to make every setup look attractive. They reject the ones that don't meet their rules.
Frequently Asked Questions About Risk Reward Ratio
A trader sets a clean stop and target, the platform flashes a 1:2 ratio, and the trade still feels unclear. That is usually where the pertinent questions start. The useful ones are less about textbook definitions and more about how the ratio works on your screen, in your market, and inside firm rules that cap drawdown.
How does the risk-reward tool on a trading platform actually work?
The tool measures the distance from your entry to your stop, then compares it with the distance from your entry to your target.
If your stop is 20 pips away and your target is 40 pips away, the tool shows 1:2. It is a measuring tape, not a decision-maker. It does not know whether your stop is placed at a logical invalidation point or whether your target sits right below a major resistance level. You still have to read the chart.
That distinction matters in a prop environment. A platform can show an attractive ratio while the actual setup still risks too much of your daily or overall drawdown limit.
Does risk-reward ratio apply the same way in forex, stocks, and crypto?
The math is the same. The market behavior is not.
Forex often gives tighter spreads and more standardized position sizing, so the ratio is usually easier to map before entry. Stocks can introduce gaps, which means your actual exit may differ from your planned stop. Crypto often trades with wider swings and overnight movement, so targets and stops may need more room. The ratio still applies, but execution quality and volatility can change how reliable your plan is.
A good habit is to calculate the ratio in the same way across markets, then adjust for the way that market moves.
What is a common risk-reward ratio for trend-following vs. mean reversion?
Trend-following setups often aim for larger upside relative to risk because the whole idea is to catch an extended move. Mean reversion setups often take smaller targets because they are betting on price snapping back to a nearby reference point.
A simple comparison helps. Trend-following works like fishing for fewer but larger catches. Mean reversion works more like collecting smaller, quicker payouts. Neither style is automatically better. The ratio should match the way the setup is designed to make money.
Should I calculate risk-reward before or after position size?
Calculate the chart first, then size the trade.
Start by marking the entry, stop, and target based on the setup. That gives you the ratio. After that, adjust position size so the dollar amount at risk fits your account rules. Traders often reverse that process and end up placing stops where the account size wants them, not where the trade structure requires them.
That mistake is expensive in funded accounts. On MyFundedCapital, the account rules matter at the account level, so position size should adapt to the setup, not distort it.
Does slippage change my real risk-reward ratio?
Yes. Your planned ratio and your realized ratio are not always the same.
Fast markets, low liquidity, and news events can push your entry or exit away from the price you expected. A setup planned at 1:2 can end up closer to 1:1.6 after poor fills. That is one reason experienced traders review execution data instead of grading a strategy only from chart screenshots.
How often should I review my average risk-reward ratio?
Review it often enough to spot a behavior problem before it grows.
For many traders, a weekly review is enough to catch patterns like cutting winners early or letting stops slip. A monthly review helps you see whether your average planned ratio matches your average realized ratio. If those two numbers keep drifting apart, the issue is usually execution, not strategy design.