

 AR
AR
 NL
NL
 FR
FR
 DE
DE
 ES
ES
 IT
IT
 PL
PL
 SV
SV
 PT
PT

Staring at a trading chart for the first time can feel overwhelming, like trying to read a foreign language. This guide will help you decode those charts by focusing on practical, actionable steps. You will learn the core principles of technical analysis, how to read price action, and how to build a simple trading strategy you can use today.
At its heart, technical analysis is simply the skill of forecasting where prices might go next by looking at where they've been. It’s what separates guessing from educated decision-making. This content is for educational purposes only and is not financial advice; all trading involves a significant risk of loss.
What is Technical Analysis?
Technical analysis is a method of evaluating assets by analyzing statistics generated by market activity, such as past prices and volume. It’s built on the idea that all known information is already reflected in the price, so studying the chart itself is the most direct way to understand market behavior. Instead of digging through financial reports (which is fundamental analysis), you focus on the price action on your screen.

Why It Matters For New Traders
For a new trader, learning technical analysis is non-negotiable. Without it, you're essentially gambling. A solid foundation gives you a real edge by helping you:
- Identify Market Structure: Learn to see if the market is trending up, down, or moving sideways.
- Time Your Entries and Exits: Find logical points to enter or exit a trade, rather than acting on impulse.
- Manage Your Risk: Use price charts to set clear stop-losses, which is your primary defense against significant losses.
- Build a Repeatable Strategy: Create a consistent, rules-based trading plan that you can test, refine, and trust over time.
It's crucial to understand that technical analysis is not a crystal ball. It doesn't guarantee profits. It’s a framework for weighing probabilities and, most importantly, managing your risk. If you want to dive a bit deeper, you can explore this in-depth guide to what Forex technical analysis is and how it all works.
How to Read a Trading Chart
Every chart tells a story of the battle between buyers and sellers. Your job is to learn how to read that story. We'll start by decoding the basics, which is the absolute foundation of technical analysis for dummies and pros alike.
Candlestick Charts: The Trader’s Choice
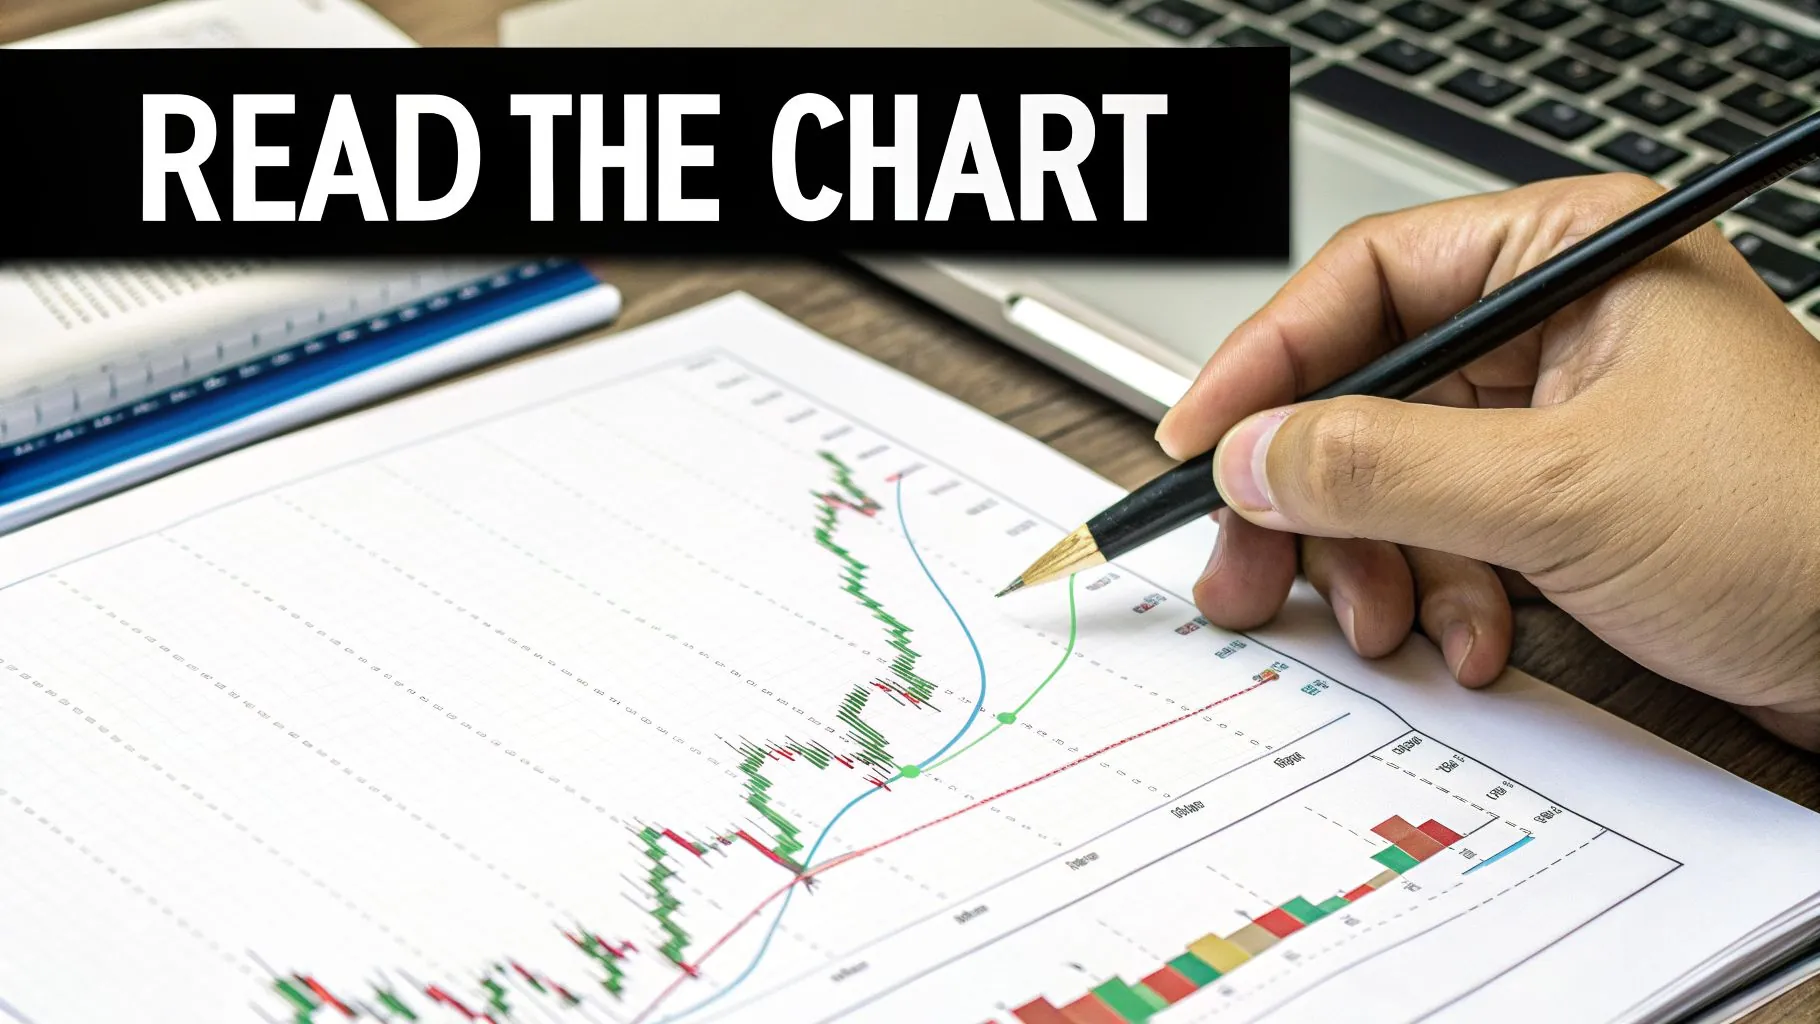
While line charts and bar charts exist, candlestick charts are the standard for most active traders. They show the Open, High, Low, and Close (OHLC) for each period, but with a color-coded "body" and "wicks" that make interpreting market psychology intuitive.
- A green (or bullish) candle means the price closed higher than it opened; buyers were in control.
- A red (or bearish) candle means the price closed lower than it opened; sellers were in control.
This visual clarity is crucial for making fast, confident decisions.
Identifying Trends and Market Direction
The first question you should always ask when looking at a chart is: which way is the price generally heading? This is the trend.
There are three main types of trends:
- Uptrend: A series of higher highs and higher lows. This indicates buyers are in control.
- Downtrend: A series of lower highs and lower lows. This shows sellers are dominant.
- Sideways Range (Consolidation): The price is bouncing between two boundaries, signaling indecision.
A core principle for beginners is to trade with the trend. Fighting the market's dominant direction is one of the fastest ways for a new trader to lose money. Identify the trend first, then look for a trade.
Understanding Support And Resistance
If the trend is the market's direction, support and resistance levels are the "floors" and "ceilings" that can cause price to pause or reverse.
- Support: A price level where buying pressure tends to overcome selling pressure, causing the price to "bounce" up.
- Resistance: A price level where selling pressure tends to overcome buying pressure, causing the price to turn back down.
These levels exist because traders remember where the price reversed before and place orders around those same areas. Learning to spot these zones on your chart is how you find logical places to enter a trade, set a protective stop-loss, and decide where to take profits.
A Beginner's Toolkit of Technical Indicators
Technical indicators are tools that help you make sense of price action. Think of them like gauges on a car's dashboard. They provide critical context about momentum, trend strength, and potential turning points. Let's focus on three essential indicators.
Moving Averages (MA)
A Moving Average (MA) smooths out price data to give you a clearer view of the trend. It calculates the average price over a set number of periods (e.g., the last 20 candles).
- Simple Moving Average (SMA): A basic average.
- Exponential Moving Average (EMA): Gives more weight to recent prices, making it react faster. Short-term traders often prefer EMAs.
A classic strategy is the "crossover." For example, when a shorter-term MA (like the 50-period) crosses above a longer-term MA (like the 200-period), it's often seen as a bullish signal.
The Relative Strength Index (RSI)
The Relative Strength Index (RSI) is a momentum indicator that measures the speed and change of price movements on a scale of 0 to 100.
- An RSI reading above 70 suggests the market may be overbought (buying momentum could be fading).
- An RSI reading below 30 suggests the market may be oversold (selling pressure could be exhausting).
This is not a blind signal to buy or sell, but a warning to pay close attention.
Moving Average Convergence Divergence (MACD)
The MACD (Moving Average Convergence Divergence) is an all-in-one indicator that combines trend and momentum. It consists of the MACD Line, a Signal Line, and a Histogram.
A common signal is the crossover: when the MACD Line crosses above the Signal Line, it’s bullish. When it crosses below, it’s bearish. If you want a deeper dive, our guide on how to read the MACD indicator is a great next step.
While these tools are powerful, their effectiveness can vary by market. A major review of academic literature confirmed that technical analysis has proven to be highly profitable in foreign exchange and commodity futures markets. For more details, you can explore the full market outlook from J.P. Morgan. Remember, no indicator is foolproof; they are best used to complement price action analysis.
Building Your First Simple Trading Strategy
Having indicators is not enough. You need a trading strategy—a set of concrete rules for when to enter, when to exit, and how to manage risk. This takes emotion and guesswork out of trading.
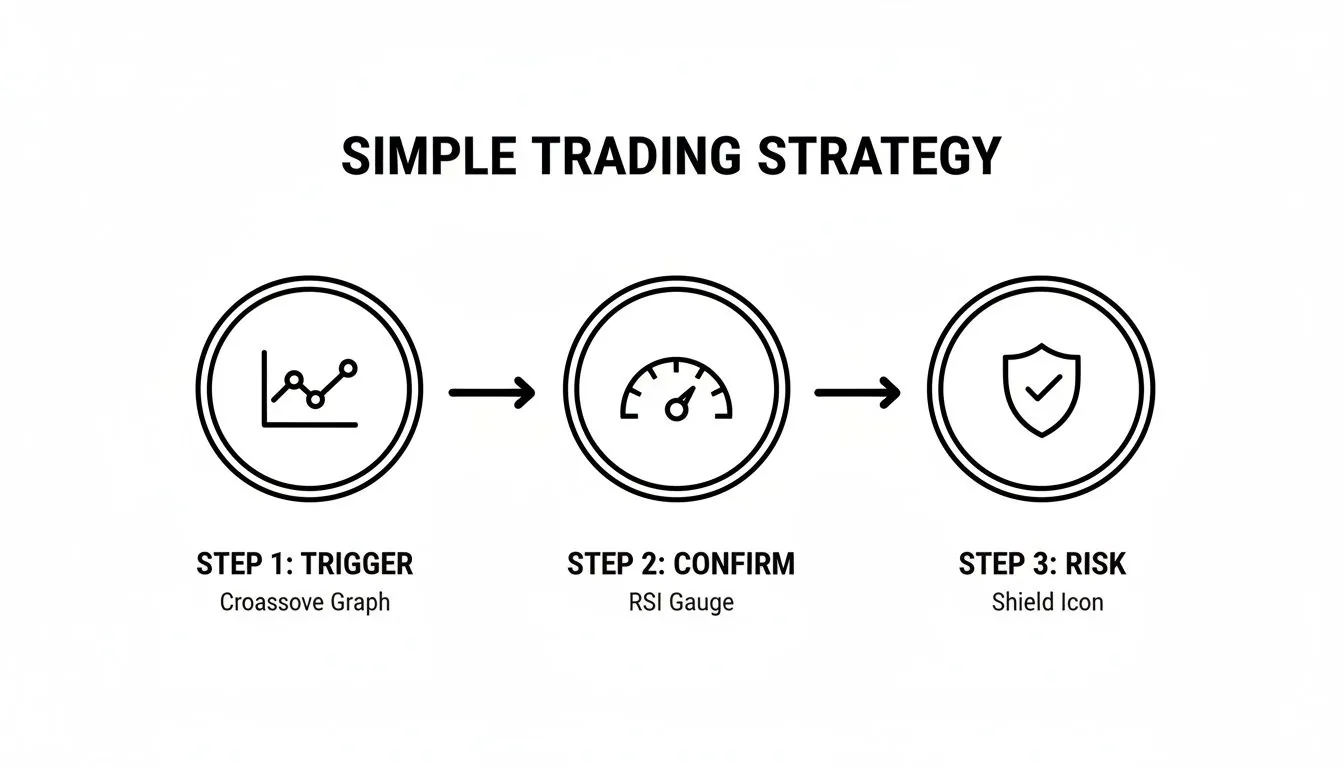
Step 1: Define Your Entry Trigger
Your entry trigger is a clear signal to consider a trade. A moving average crossover is a simple and effective trigger for beginners. We'll use a 9-period EMA and a 21-period EMA.
- Long (Buy) Signal: The 9 EMA crosses above the 21 EMA.
- Short (Sell) Signal: The 9 EMA crosses below the 21 EMA.
If this condition isn't met, you don't trade.
Step 2: Confirm the Signal With an Oscillator
Crossovers can produce "false signals," especially in choppy markets. We need a confirmation tool. The RSI is perfect for this.
- Buy Confirmation: For a buy signal (9 EMA crosses above 21 EMA), the RSI must be above 50. This confirms bullish momentum.
- Sell Confirmation: For a sell signal (9 EMA crosses below 21 EMA), the RSI must be below 50. This confirms bearish momentum.
If the EMAs cross but the RSI disagrees (e.g., a buy signal occurs with the RSI at 40), you do not take the trade. This discipline is what separates strategic traders from gamblers. Rule-based trading is a cornerstone of professional strategy; you can see more insights on these technical analysis research trends to understand why.
Step 3: Set Your Risk and Exit Rules
A strategy without risk management is a recipe for disaster. Before you enter a trade, you must know two things:
- Your Stop-Loss: This is your maximum acceptable loss. For a buy trade, place it just below a recent support level. For a sell trade, place it just above a recent resistance level.
- Your Profit Target: A common method is using a risk-to-reward ratio. A 1:2 ratio is a solid start: for every $1 you risk, you aim to make $2.
Example: You buy EUR/USD at 1.0750 and set your stop-loss at 1.0725 (risking 25 pips). A 1:2 risk/reward ratio means your profit target would be 50 pips higher, at 1.0800. Once the trade is set, let it play out.
Applying Technical Analysis In A Prop Firm Challenge
Passing a prop firm challenge tests your discipline and ability to perform under strict rules. Your technical analysis must become a tool for managing risk within those parameters, like a 5% daily drawdown limit or a 10% total drawdown limit.
- Intelligent Stop-Losses: Use support/resistance levels to place stops that keep potential losses within the daily limit.
- Calculated Position Size: A setup with a wide stop-loss requires a smaller position size to respect the firm's risk rules.
- Methodical Profit Targets: Use your analysis to set take-profit orders at major price levels to systematically work toward the challenge's profit target.
This methodical approach is what prop firms look for. It's a discipline that is growing in demand, especially with markets like crypto expanding rapidly. You can discover more about these global crypto adoption trends from Chainalysis to see the growing need for skilled technical traders.
FAQ: Common Questions on Technical Analysis
1. Can technical analysis predict the future?
No. Technical analysis is a tool for weighing probabilities, not a crystal ball. It helps you find high-probability setups and, more importantly, manage your risk in an uncertain environment. There are no guarantees in trading, and every trade involves risk.
2. How long does it take to learn technical analysis?
You can learn the basics in a few weeks, but mastery is a lifelong journey. Start by focusing on a few core concepts: identifying trends, drawing support/resistance, and using one or two indicators like Moving Averages and the RSI. Practice in a demo account to build screen time before risking real capital.
3. Is technical analysis better than fundamental analysis?
Neither is "better"—they are different tools. Technical analysis is about when and focuses on chart data, ideal for short-term trading. Fundamental analysis is about why and looks at economic data, better for long-term investing. Many traders use a blend of both. Advanced traders are even exploring tools like using ChatGPT for stock trading to process data, though this requires extreme caution.
Ready to Test Your Skills?
Theory only gets you so far. The real growth happens when you apply your technical analysis skills in a live market environment. A prop firm challenge provides the ideal arena to prove your discipline and risk management.
At MyFundedCapital, we give you the platform and capital to put your strategy to the test. If you can demonstrate consistent, risk-managed trading, you can earn funding.
Ready to see if your technical analysis holds up when it counts? Explore our funding programs and start a challenge today.
