Struggling to find reliable short-selling opportunities in a falling market? The bearish flag pattern is a classic continuation signal that can help you identify when a downtrend is likely to resume after a brief pause. This guide provides a practical, step-by-step framework for spotting, confirming, and trading this powerful pattern while managing your risk.
Think of it like this: the market makes a sharp, aggressive move down, and then needs to take a quick breather before the next leg lower. That "breather" is the flag, and it's our cue that the sellers are just regrouping. This pattern is a go-to for traders because its structure tells a very clear story about market momentum and psychology.
How to Identify a Bearish Flag Pattern
To trade this pattern effectively, you first need to know what you’re looking for. A genuine bear flag has a specific structure that tells a story of sellers taking a quick breather before pushing the price lower again. It is made of two distinct parts that are easy to spot once you know the rules.
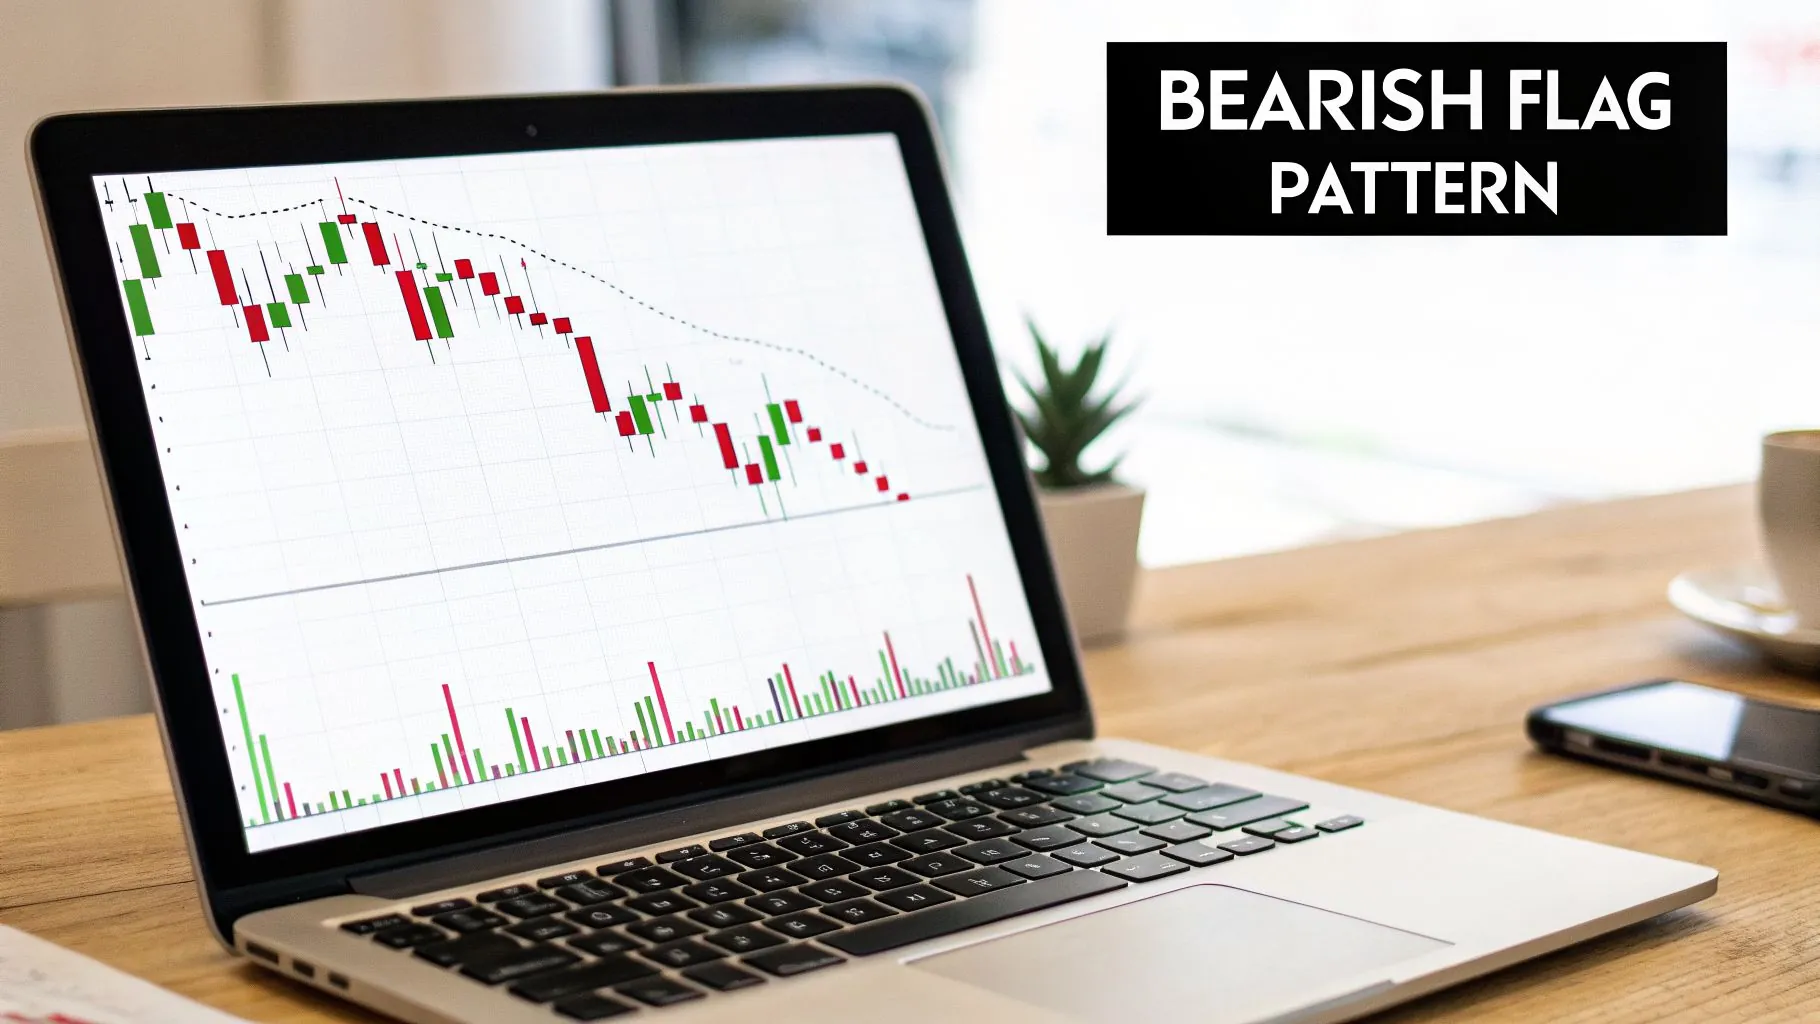
The Flagpole: The Initial Plunge
The whole pattern kicks off with the flagpole. This isn't a gentle slide; it's a sharp, almost vertical drop in price, representing a moment of panic or aggressive selling. A strong flagpole is the foundation of a valid pattern and your first major clue that sellers have taken complete control.
- This initial move is almost always accompanied by a spike in trading volume.
- This high volume is critical—it confirms that strong conviction is behind the sell-off.
The Flag: The Deceptive Pause
After that intense selling, the market seems to find a temporary floor and enters a consolidation phase. This is where the flag forms. It looks like a small, neat channel that drifts slightly upward or sideways, pushing back against the powerful downtrend.
- Crucially, this happens on lower volume.
- This tells us the buyers trying to push the price up lack any real conviction. The upward drift is likely just short-sellers taking small profits.
The entire setup hinges on the idea that the upward consolidation (the flag) is weak and temporary. This lack of buying pressure is the key signal that sellers are still in control and are about to push the price lower again.
A Checklist for Spotting a Valid Bearish Flag
Before you even think about placing a trade, make sure the pattern checks all these boxes:
- Prior Trend: The market must already be in a clear downtrend. The flag is a continuation pattern, not a reversal.
- Steep Flagpole: Was the first drop sharp and sudden on high volume? A slow drift downwards doesn't count.
- Weak Consolidation (Flag): Is the flag a tight channel moving up or sideways on declining volume?
- Brief Duration: The flag should form quickly, usually over 5 to 20 price bars. If it drags on, the pattern loses its urgency.
- Shallow Retracement: The flag shouldn't claw back too much of the flagpole's move. Ideally, it retraces less than 38.2%, and almost never more than 50%. You can learn how to measure this with our guide on how to draw Fibonacci retracements.
This isn't just theory; it's grounded in historical data. Analysis has shown the bearish flag pattern has a success rate of around 67% in confirmed downtrends. For instance, one study found the average subsequent drop after the flag broke was 17%, and 61% of successful patterns met their measured price targets. If you're interested in the numbers, you can read the full research on bear flag performance.
As one of the most common signals in technical analysis, the bearish flag is a fundamental tool. To broaden your skills, you might want to check out our guide on other essential chart patterns in forex.
A Step-by-Step Guide to Trading the Bearish Flag
Spotting a bearish flag is one thing; knowing exactly how to trade it is another. A clear plan is what separates a disciplined trade from a gamble. To do this right, you need three things locked in before you hit the sell button: your entry trigger, your stop-loss, and your profit target.
This is a practical playbook for trading the bearish flag, covering two distinct entry styles to match your personal risk appetite. Remember, trading involves significant risk of loss and is not suitable for all investors. This content is for educational purposes only and is not financial advice.
Step 1: Nailing Your Entry
Your entry point is critical. Enter too soon, and you risk a fakeout; enter too late, and you miss the move. Traders generally use one of two entry methods.
- The Aggressive Entry: Enter a short position the moment a candle closes firmly below the flag's lower trendline. This gets you the best possible price if the pattern breaks down as expected but carries a higher risk of a false breakout.
- The Conservative Entry: Wait for the price to break below the flag, then wait for it to pull back and retest that broken trendline from underneath. Your entry signal is the price getting rejected from this level, confirming sellers are back in command. You might get a slightly worse entry price, but your trade has a higher probability of success.
Deciding between an aggressive and a conservative entry is a core part of any trader's strategy. The right choice depends on market conditions and your tolerance for risk.
Step 2: Setting Your Protective Stop-Loss
Trading without a stop-loss is one of the fastest ways to blow up an account. The bearish flag provides a logical place to set it.
- Your stop-loss should go just above the highest point of the flag's upper trendline.
- The Logic: If the price breaks above the consolidation channel, the bearish setup is invalidated. It means buyers have overwhelmed the sellers. Placing your stop here defines your exact risk upfront.
Properly setting these orders is a non-negotiable skill. For a deeper dive, check out our guide on how to effectively use your stop-loss and take-profit.
Step 3: Calculating Your Profit Target
The final piece is knowing when to take profits. The most common method for a bearish flag is the measured move technique.
- Measure the Flagpole: Calculate the price distance of the initial sharp drop. For example, if an asset drops from $100 to $90, the flagpole’s height is $10.
- Project from the Breakout: Subtract that same height ($10) from the price where the market broke out of the flag. If the breakout happened at $92, your projected profit target would be $82 ($92 – $10).
This technique provides an objective, data-driven target, helping you avoid emotional decisions like closing too early or getting greedy.
Using Advanced Techniques for Confirmation
Relying on shape alone is a recipe for getting stopped out by false signals. Professional traders look for multiple layers of confirmation to build a strong case for a trade. These methods help you verify that market psychology aligns with the pattern, improving your odds of success.
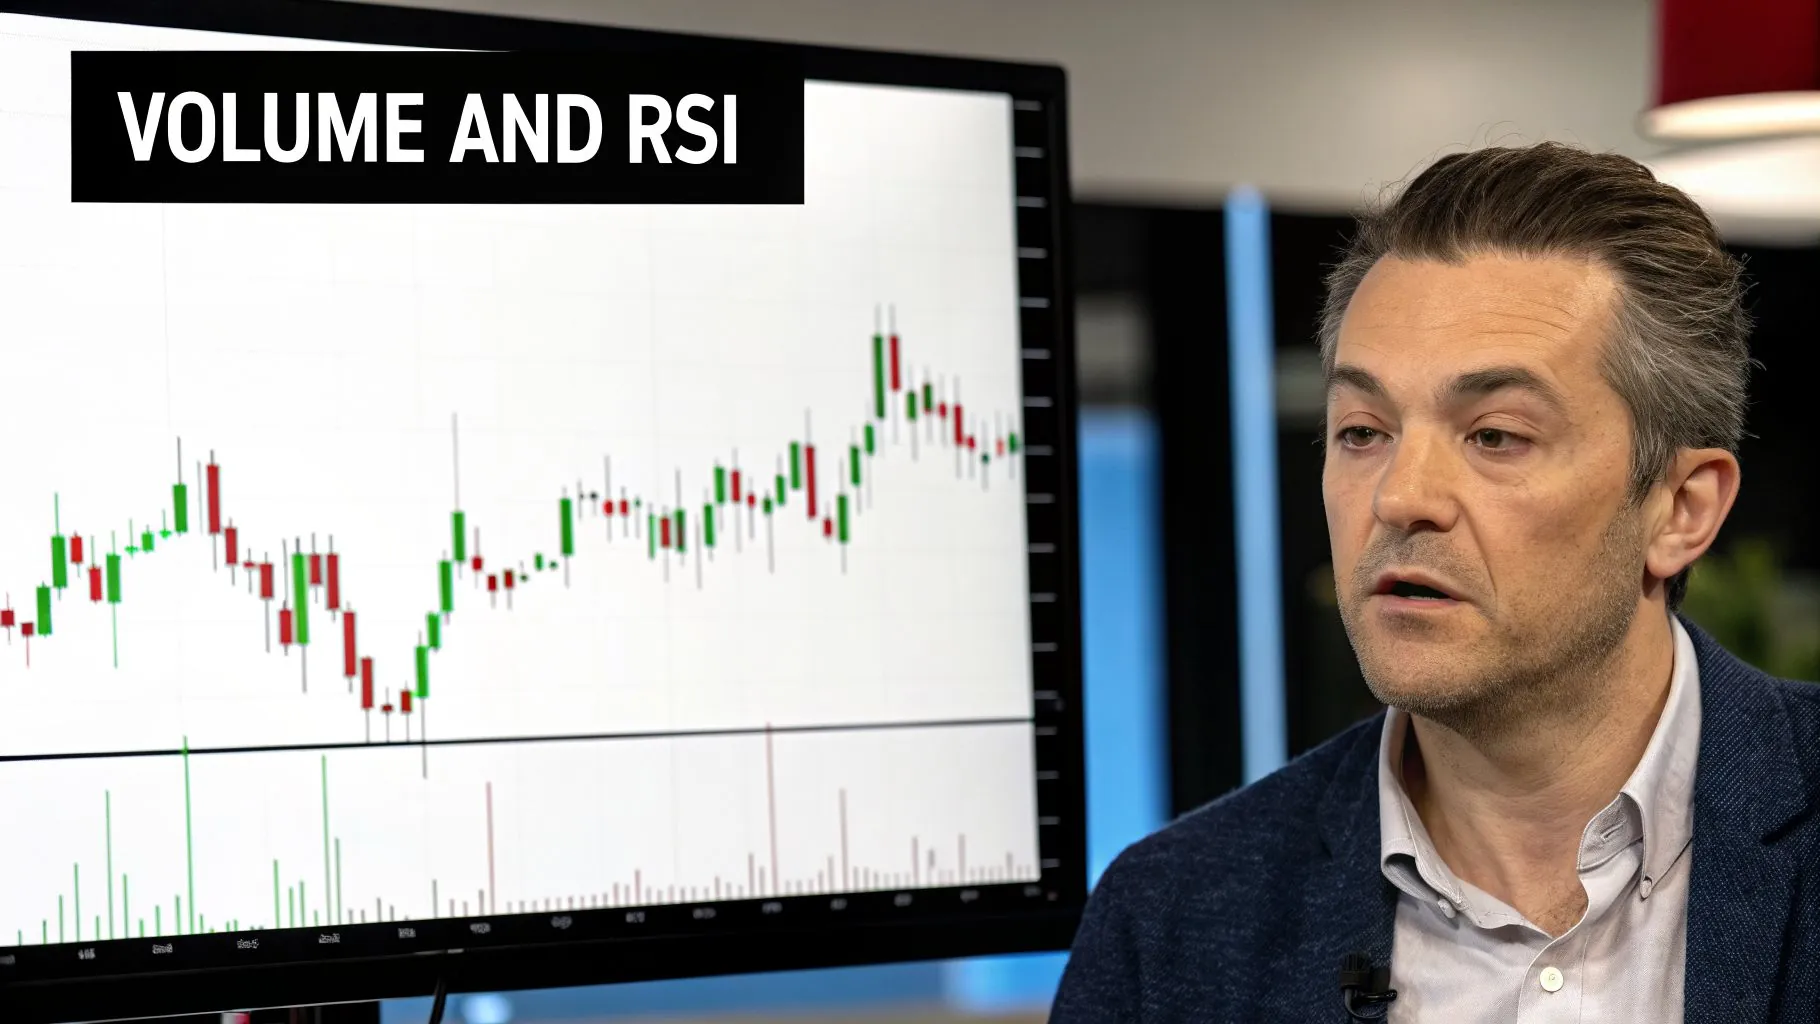
Volume Analysis
Volume is arguably the most powerful confirmation tool. It shows the conviction behind price moves. A genuine bear flag has a specific volume signature.
- High Volume on the Flagpole: The initial drop must occur on heavy volume, proving that sellers are in control.
- Decreasing Volume in the Flag: As the flag consolidates, volume should dry up. This is the crucial tell—it shows buyers lack conviction.
- A Spike in Volume on the Breakout: When the price cracks below the flag’s lower trendline, volume should surge again, confirming sellers are back in force.
Momentum Oscillators (RSI)
Momentum indicators like the Relative Strength Index (RSI) are fantastic for spotting hidden weakness through a signal known as bearish divergence.
- This occurs when the price action inside the flag’s channel makes a small new high.
- At the same time, the RSI makes a lower high instead.
- This divergence is a major red flag, signaling that buying pressure is fading fast and making a downside breakdown more likely.
Research from Quantified Strategies shows that bear flags in established downtrends perform exceptionally well, with an average price decline of 17% post-formation. Declining volume during the flag is a key predictor of a sharp breakout. You can discover more insights about these findings on QuantifiedStrategies.com.
Multi-Timeframe Analysis
A chart can be misleading without context. What looks like a perfect bear flag on a 15-minute chart could just be noise within a powerful uptrend on the 4-hour chart.
- Identify the Dominant Trend: Before trading a bear flag, zoom out to the daily or 4-hour chart. Is the market in a clear, overarching downtrend?
- Find Your Setup: Once confirmed, zoom back into your preferred trading timeframe (e.g., 1-hour or 15-minute) to pinpoint the pattern.
This process ensures you’re trading with the prevailing market current, not fighting against it.
Applying the Bearish Flag to Prop Firm Rules
Trading for a prop firm like MyFundedCapital is about mastering risk management. The bearish flag is an excellent tool for prop firm traders because it has risk management built into its structure, helping you stay within rules like a 5% daily drawdown.
Position Sizing for Prop Firm Compliance
In prop firm trading, your first priority is survival. Sizing your positions based on a pre-defined stop-loss, typically risking no more than 1% of your account on any single trade, is essential.
Here is a practical example with a hypothetical $100,000 account:
- Set Your Maximum Risk: On a $100,000 account, a 1% risk limit means you cannot lose more than $1,000 on one trade.
- Pinpoint Your Stop-Loss: You spot a bear flag on EUR/USD and enter short at 1.0750. Your stop-loss is placed above the flag's high at 1.0775 (a 25-pip risk).
- Calculate Your Position Size: Assuming a standard lot where 1 pip is worth $10, your risk is $250 per lot (25 pips x $10). To stay within your $1,000 risk limit, your position size is 4 lots ($1,000 / $250).
By following this process, a losing trade becomes a manageable 1% setback, not a challenge-ending event.
The bearish flag also provides an objective profit target via the measured move, removing emotional decision-making. Historical analysis shows that bearish flags perform as expected 60-70% of the time, especially when confirmed by falling volume. One study noted flags typically formed over 8 days before the subsequent drop, giving traders ample time to prepare. You can dig into these historical findings to build confidence in the setup. This systematic approach helps protect your capital and work towards passing your challenge.
Common Mistakes to Avoid When Trading Bearish Flags
Spotting a textbook bear flag and then watching it fail is a common frustration. Usually, the issue isn't the pattern but an avoidable trading error. Knowing these pitfalls is just as important as knowing the entry rules.
Forcing the Pattern
The number one mistake is forcing the pattern. A true bear flag needs a sharp, violent flagpole. If you have to squint and tilt your head to see it, it's not a trade. Without a decisive initial drop on high volume, there's no strong bearish momentum to continue.
Entering Before Confirmation
The second mistake is jumping the gun. Entering before a candle closes firmly below the flag's lower trendline is pure impatience. This is a common way to get stopped out on a fakeout. You must wait for the market to prove that sellers are truly back in charge.
Ignoring Contextual Clues
Many traders get so fixated on the shape that they miss critical context.
- Forgetting to Check Volume: If volume stays high or rises inside the flag, it means buyers are stepping in with conviction. This is a battle, not a pause, and your "flag" could easily be a reversal.
- Trading a "Stale" Flag: The consolidation should be brief (typically 5-20 bars). A flag that drags on signals that bearish pressure is fading, and the odds of a breakdown are dropping.
Your Pre-Trade Checklist
To avoid these traps, run every potential bear flag through this quick checklist:
- Is the Flagpole Obvious & Steep? It should immediately catch your eye.
- Did Volume Die Down? Look at your volume indicator for a noticeable drop-off during the flag. This is non-negotiable.
- Was the Consolidation Brief? Did the flag form in under 20 bars?
- Did I See a Confirmed Breakout? Wait for a full candle to close below the lower trendline before entering.
By making this checklist a habit, you systematically filter out low-quality setups and protect your capital.
FAQ: Bearish Flag Pattern
Here are answers to some frequently asked questions about trading the bearish flag pattern.
What's the difference between a bearish flag and a bearish pennant?
The only real difference is their shape. A bearish flag consolidates within a rectangular, parallel channel. A bearish pennant consolidates within a small, converging triangle. From a trading perspective, they tell the exact same story of a trend continuation and are traded using the same methods.
How successful is the bearish flag pattern?
No chart pattern is 100% accurate. However, historical studies show that the bearish flag is one of the more reliable continuation patterns, with reported success rates often between 60-70%, especially when found in a clear downtrend and confirmed with declining volume. This performance makes it a valuable setup for traders, but it's crucial to use a stop-loss as failed patterns can occur.
Can I trade this pattern on any timeframe?
Yes, the bearish flag is a fractal pattern, meaning its structure appears on all timeframes, from 1-minute charts to weekly charts. However, patterns identified on higher timeframes (like the 4-hour or daily) are generally considered more significant and reliable as they filter out short-term market noise.
What's a good risk-to-reward ratio for this trade?
The bearish flag naturally lends itself to a favorable risk-to-reward ratio. The logical stop-loss placement (just above the flag's high) combined with the measured move profit target often creates setups offering a 1:2 risk-to-reward ratio or better. This means your potential profit is at least twice your potential loss, which is a cornerstone of any sustainable trading strategy.
Ready to apply your trading skills with serious capital? At MyFundedCapital, we fund disciplined traders who can prove their edge. Compare our instant funding and challenge accounts and start your journey to getting funded today.