
Struggling to find the right entry point after a market makes a big move? This guide will show you how to draw Fibonacci retracements to identify high-probability zones where a price pullback might end and the original trend could resume. You'll learn the step-by-step process of using this tool to plan your trades with greater precision.
Why Fibonacci Retracements Are an Essential Trading Tool
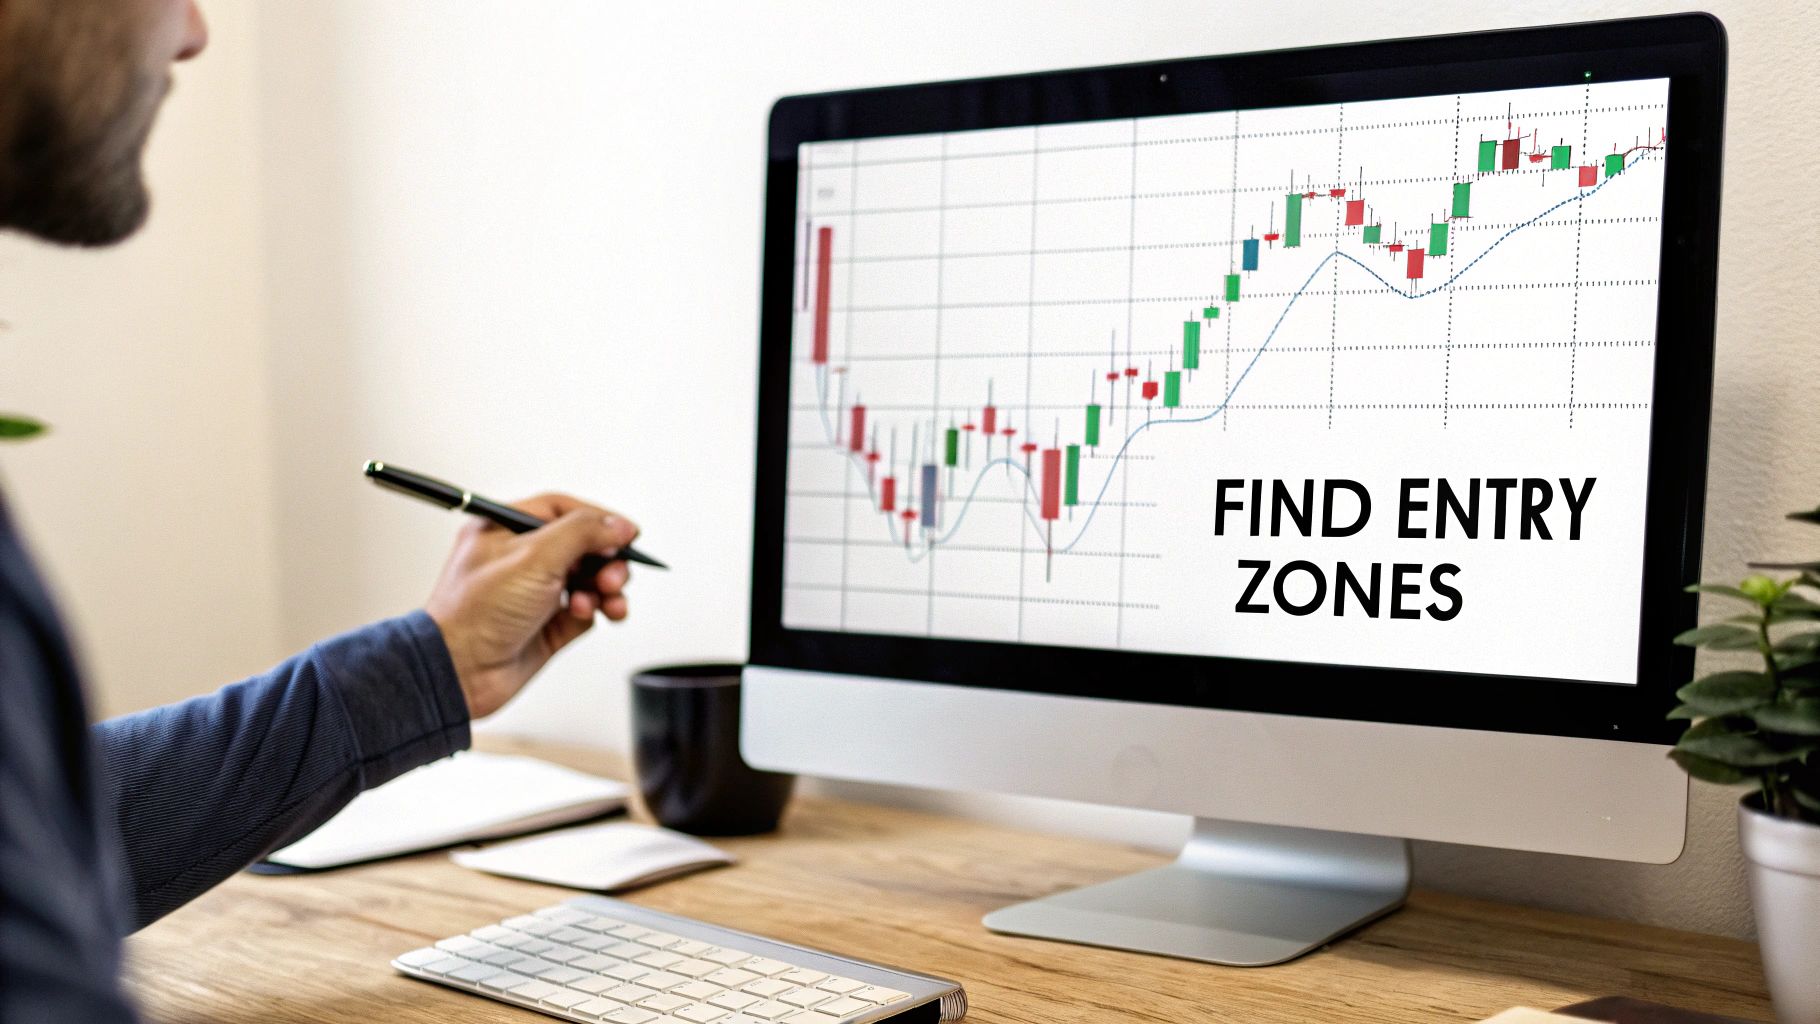
Let's be honest: one of the toughest parts of trading is figuring out where a pullback is going to stop. After a big run-up or a sharp drop, the market rarely moves in a straight line. It breathes, it pulls back, and that's where traders often get nervous. This is the exact problem Fibonacci retracements are designed to solve.
Instead of guessing where to enter a trending market, this tool provides a structured way to spot potential reversal zones. It’s a cornerstone of technical analysis because it helps you anticipate where the buyers or sellers who drove the initial move might step back in.
The Power of Key Ratios
The "magic" behind Fibonacci isn't magic—it's market psychology. The tool is based on a mathematical sequence, and its key ratios have become a self-fulfilling prophecy in the markets. Why? Because millions of traders, from small retail accounts to huge institutional funds, are watching the exact same levels.
When the price pulls back to a well-known level like the 61.8% retracement, everyone is watching. Traders are poised to act, and that collective action can create the support or resistance you're looking for.
Using these levels helps you:
- Pinpoint Potential Entry Zones: Find logical spots to enter a trade as the trend looks to resume.
- Set Smarter Stop-Losses: Place your stop just beyond a key Fibonacci level, giving your trade a logical invalidation point.
- Establish Realistic Profit Targets: Use Fibonacci extensions (a related tool) to project how far the next price swing might travel.
The goal isn't to predict the future with 100% accuracy. It's about finding zones where the odds of the trend continuing are in your favor, giving you a statistical edge over time. Trading involves a substantial risk of loss and is not suitable for all investors.
Key Fibonacci Retracement Levels and Their Meaning
This quick-reference table breaks down what each common level typically signifies.
| Fibonacci Level | Retracement Depth | What It Suggests |
|---|---|---|
| 23.6% | Shallow | A very strong trend. Price is barely pulling back before continuing. |
| 38.2% | Moderate | A healthy pullback in a strong trend. A common first stop. |
| 50.0% | Medium | A significant but normal pullback. Not a true Fibonacci ratio, but widely watched. |
| 61.8% | Deep (Golden Ratio) | A deep pullback, often considered a strong potential support/resistance area for the current trend. |
| 78.6% | Very Deep | An extremely deep retracement. The original trend is in danger of reversing if this level fails. |
Understanding these levels helps you read the market's current story. A shallow retracement signals strength, while a deep one suggests the trend might be losing steam.
How to Draw Fibonacci Retracements Correctly
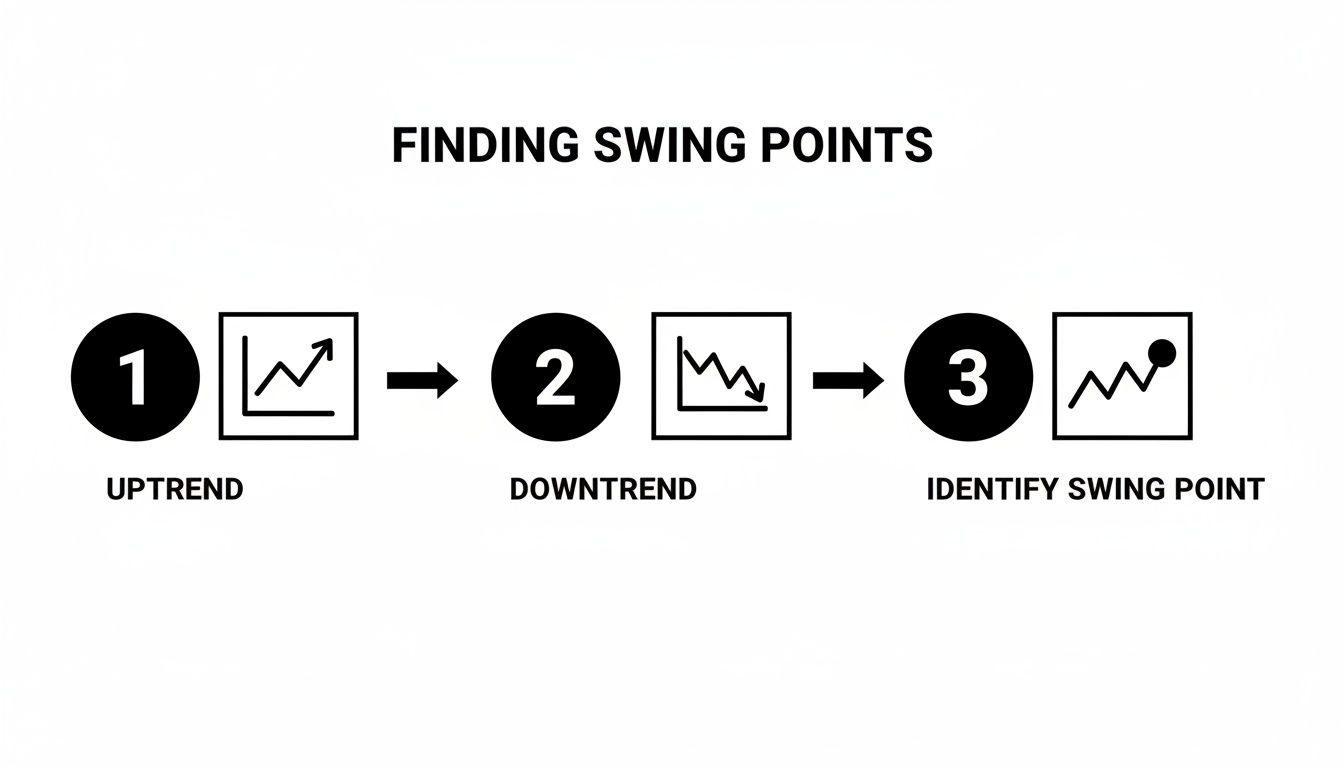
Your Fibonacci tool is only as reliable as the anchor points you give it. Get those wrong, and your analysis is invalid. The first real skill in using Fibonacci retracements is spotting the right swing points on your chart.
A proper swing point is a major turning point—a clear, obvious peak or trough where the market's momentum reversed course. You need to identify the definitive high and low of the specific trend you want to analyze.
Drawing Fibs in an Uptrend
When the market is bullish, you’ll see a pattern of higher highs and higher lows. You're looking to enter on a pullback, so your job is to measure the last significant push upward (the impulse wave).
Here’s the step-by-step process:
- Step 1: Identify the significant Swing Low where the upward move began. This is your anchor point 1 (the 0% or 0 level).
- Step 2: Identify the significant Swing High where the price peaked before starting to pull back. This is your anchor point 2 (the 100% or 1 level).
- Step 3: Select the Fibonacci Retracement tool. Click on the Swing Low and drag your cursor up to the Swing High, then release.
Drawing from low to high projects potential support levels onto your chart. These are the zones where the price might find its footing, bounce, and then continue its climb.
Drawing Fibs in a Downtrend
For a downtrend, you just flip the logic. The market is carving out lower lows and lower highs, and you want to find a spot to short on a corrective bounce. You'll measure the most recent significant drop to pinpoint potential resistance levels.
Here's how to anchor the tool in a downtrend:
- Step 1: Identify the significant Swing High where the downward leg started. This is your anchor point 1 (the 100% or 1 level).
- Step 2: Identify the significant Swing Low where the move found temporary support. This is your anchor point 2 (the 0% or 0 level).
- Step 3: Select the Fibonacci Retracement tool. Click on the Swing High and drag your cursor down to the Swing Low, then release.
By drawing from the high down to the low, the Fibonacci levels now act as a roadmap of potential resistance. You can watch these zones to see if a short-term rally fails, giving you an opportunity to short the market in line with the dominant trend. Picking the right swing points is a key skill covered in many technical analysis trading tips and charting trends.
Drawing Fibonacci Levels on Your Trading Platform
You have the theory down. Now it's time to put the Fibonacci tool to work on your charts. Once you know where to find the tool on platforms like cTrader, DXtrade, or Match-Trader, it becomes second nature.
The drawing tools are typically located in a toolbar on the left side of your chart. Look for an icon that resembles a series of stacked horizontal lines. Click it, and your cursor will change, indicating you're ready to draw.
The rule is simple and non-negotiable: for an uptrend, you draw from the swing low up to the swing high. For a downtrend, you always draw from the swing high down to the swing low.
Finding and Customizing the Tool
While the concept is universal, the exact location can differ slightly.
- cTrader: The tool is in the vertical toolbar on the left, likely under the "Lines" or a similar drawing menu.
- DXtrade: Scan the toolbar on the left side of your chart. The Fibonacci tool is almost always grouped with other technical drawing tools.
- Match-Trader: Find your drawing panel, select the Fibonacci retracement tool, and you're good to go.
Once selected, click once on your starting swing point, drag your cursor to the ending swing point, and release. The platform instantly overlays the Fibonacci levels onto your chart.
Most platforms allow you to customize the tool's appearance. Right-click the Fibonacci lines you've drawn and find a "Settings" or "Properties" menu.
- Tweak Colors and Line Thickness: Make key levels like the 61.8% a distinct, bold color so it stands out.
- Add or Hide Levels: Consider adding the 78.6% level to catch deeper pullbacks, as it's not always a default setting.
- Extend the Lines: Extend the retracement lines to the right so they remain visible as new price action forms.
The effectiveness of these levels is not just anecdotal. A 2022 analysis published by PMC found that strategies built around Fibonacci levels significantly outperformed simple buy-and-hold investing, especially in volatile markets. The study highlighted that the 61.8% level was a remarkably reliable support zone, catching over 70% of major moves in a test on oil prices. For details, you can read the full research on Fibonacci-based strategy performance.
Using Fibonacci Levels to Plan Your Trades
Drawing the levels is just the first step. The real skill is using them to make calculated trading decisions. Think of these lines not as exact barriers but as high-probability zones where the market is likely to react. Your job is to wait patiently for confirmation before risking capital.
These levels give you a solid framework for building a trade plan, from entry to exit, answering the critical questions: Where should I look to get in? Where should my stop-loss go? And where are logical places to take profit?
Identifying Entry Zones
The most common use for Fibonacci retracements is to pinpoint entry points during a pullback. Once you've anchored your tool, the 38.2%, 50%, and 61.8% levels become your primary areas of interest.
- Shallow Pullback (38.2%): In a very strong trend, the price may only pull back to the 38.2% level before continuing.
- Medium Pullback (50%): A retracement to the 50% mark is a standard correction and a common battleground between buyers and sellers.
- Deep Pullback (61.8%): The 61.8% "golden ratio" is often a strong line of defense for the prevailing trend and can offer excellent risk-to-reward opportunities.
Crucial advice: Never enter a trade just because the price has touched a Fibonacci level. Wait for confirmation. Look for a bullish candlestick pattern (like a hammer or engulfing bar) at a support level, or a bearish pattern at a resistance level. This confirms other traders see the same level and are acting on it.
Setting Stop-Losses and Profit Targets
Fibonacci levels are equally valuable for risk management. Strong risk management in forex trading is critical, and these levels provide logical places to protect your position.
A common strategy is to place your stop-loss just beyond the next key Fibonacci level. For instance, if you enter a long trade at the 61.8% retracement, setting your stop-loss just below the 78.6% level or the original swing low is a logical choice. This gives your trade room to breathe without exposing you to unnecessary risk.
For profit targets, many traders use Fibonacci extension levels (a related tool) or simply aim for the initial swing high (in an uptrend) or swing low (in a downtrend) as their first target.
The Power of Confluence
A single indicator is rarely enough. The most reliable trading opportunities emerge from confluence—where a Fibonacci level lines up with another technical signal. This stacking of evidence elevates your analysis.
Look for areas where a key Fibonacci level intersects with:
- A major moving average (e.g., 50 or 200 SMA).
- A previously established support or resistance zone.
- A major psychological round number (e.g., 1.5000 on a currency pair).
When multiple, independent signals point to the same price zone, the probability of that level holding increases dramatically.
Common Mistakes to Avoid
Knowing the common pitfalls is just as crucial as learning to draw the levels correctly. Sidestepping these mistakes will help protect your capital and sharpen your trading edge.
- Forcing a Setup: If you have to squint to find swing points, they probably aren't significant. Drawing levels on minor, choppy price action just creates unreliable noise.
- Trading Blindly: Never place a trade just because price hits a level. Wait for confirmation. Price can—and often does—slice through these levels if the underlying momentum is strong enough.
- Ignoring the Higher Timeframe: Context is king. A Fibonacci level on a 5-minute chart doesn't carry the same weight as one on the daily chart. A bullish setup on a lower timeframe is more likely to succeed if it aligns with the dominant uptrend on a higher timeframe.
Thinking in Lines, Not Zones
A frequent error is treating a Fibonacci level as a precise, razor-thin line. It's far more practical to think of these as high-probability zones. Price action is rarely neat; the market will often overshoot or undershoot a level before reacting. Look for a reaction in the general vicinity.
Using Fibs in the Wrong Market Conditions
Remember: Fibonacci retracements are a trend-following tool. They work best when a market is making clear higher highs and higher lows (uptrend) or lower lows and lower highs (downtrend). Applying them in a choppy, sideways market will lead to a confusing mess of false signals and frustrating losses.
FAQ: Common Questions About Drawing Fibonacci Retracements
Here are answers to some of the most common questions traders have when learning how to draw Fibonacci retracements.
Which Fibonacci Level Is Best?
There is no single "best" level, but the 61.8% "golden ratio" is highly regarded by many traders because it represents a deep, significant pullback. However, the context of the trend matters most. In a very strong trend, the price may only retrace to the 38.2% level. The skill is not in picking one favorite level but in waiting for clear price action confirmation at any of the key levels.
Can I Use Fibonacci Retracements on Any Timeframe?
Yes. The principles of Fibonacci are fractal, meaning they apply to all timeframes, from 1-minute charts for scalping to weekly charts for position trading. The process of identifying swing high and swing low remains the same. However, a major swing on a daily chart carries significantly more weight than a minor swing on a 5-minute chart. Always check the higher timeframe trend for context.
What’s the Difference Between Retracements and Extensions?
It’s a simple distinction:
- Retracements help you find potential entry points. They measure the depth of a pullback within a trend.
- Extensions help you find potential exit points (profit targets). They project price targets beyond the recent swing high or low.
Is It a Good Idea to Use Fibonacci in a Sideways Market?
No, it is not recommended. The Fibonacci retracement tool is designed specifically for trending markets. Attempting to use it in a choppy, sideways, or range-bound market will result in unreliable levels and a high number of false signals. For ranging markets, use tools better suited for the job, like horizontal support and resistance lines or oscillators like the RSI.
This educational content is not financial advice. All trading involves a substantial risk of loss. Ready to put what you've learned into practice in the live markets? Explore our funding programs that allow you to trade with our capital. Compare our account types and take the next step in your trading journey today.