Using a risk and reward calculator turns trading from a guess into a calculated business decision, letting you see potential profit and loss before you enter a position. This guide will show you how to use this simple tool to make smarter, more disciplined trades. This one step is often what separates traders who build lasting careers from those who don't.
Why a Risk Reward Calculator Is Non-Negotiable
If you struggle with consistency or have failed a prop firm challenge, the problem likely isn't your entry signal—it's weak risk management. A risk and reward calculator is your most valuable asset here, forcing a mental shift from gambling on price to executing a clear plan for every trade. It forces you to think in probabilities and mathematical edge.
The key to long-term profitability isn't being right all the time. It’s about ensuring your wins are significantly bigger than your losses. This simple concept, a positive risk-to-reward ratio, is the foundation of every successful trading career.
The Bedrock of Profitable Trading
A solid risk-to-reward ratio gives you a powerful mathematical advantage. It means you can be wrong more often than you're right and still grow your account.
- With a 1:1 ratio, risking $100 to make $100, you must win over 50% of your trades to break even after costs.
- With a 1:2 ratio, risking $100 to make $200, your breakeven win rate drops to just 33.3%.
- Aiming for a 1:3 ratio, risking $100 for a potential $300 profit, means you only need to be right 25% of the time to stay in the game.
This edge builds resilience, helping you weather the losing streaks that are an inevitable part of trading. To go deeper, learn more about building a solid foundation with effective risk management in forex trading.
Trading without a predetermined risk-to-reward ratio is like flying a plane without a flight plan. You might get off the ground, but you have no clue where you're going or if you have enough fuel to get there.
Defining Your Trade Before It Starts
A risk and reward calculator works with three critical pieces of information that frame your entire trade:
- Entry Price: Where you plan to enter the market.
- Stop Loss: The price where you'll exit for a small, controlled loss if you're wrong.
- Take Profit: Your price target for exiting with a profit.
Plugging these three numbers into a calculator instantly shows your potential loss, potential gain, and the resulting ratio. This simple act forces conscious, logical decisions before your money is on the line, stripping emotion from the process and ensuring every trade fits your strategy. This discipline is critical when trading under strict rules, like the drawdown limits at prop firms such as MyFundedCapital.
The Core Formulas for Calculating Your Trades
Let's get down to the simple math that underpins every solid trade. A good risk and reward calculator boils down to a few key formulas that bring clarity to your trading, turning chart patterns into hard numbers. You need to know, down to the dollar, exactly what's at stake and what you stand to gain before you click the "buy" or "sell" button.
This diagram lays out the three essential inputs that every trade plan needs. It’s a simple but powerful workflow.
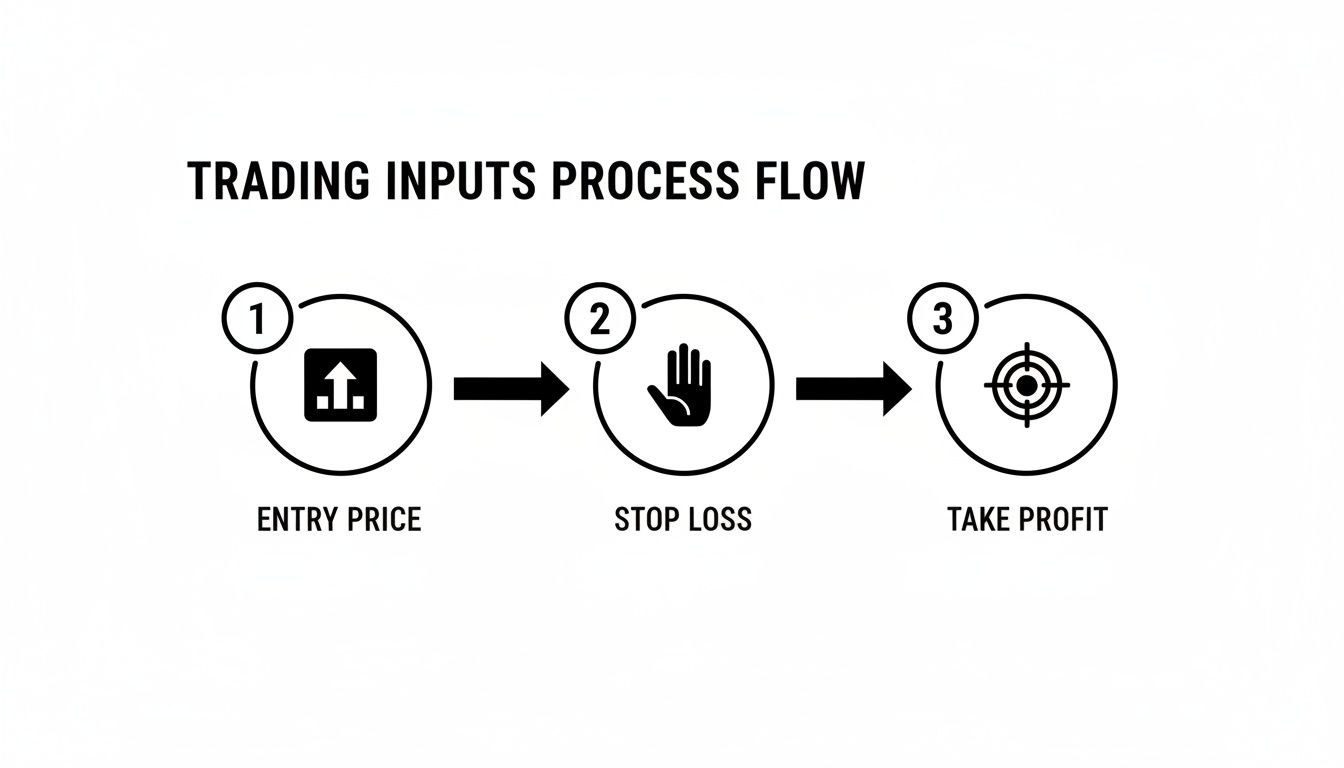
As you can see, it all starts with defining your entry price, where you'll cut your losses (your stop loss), and where you'll cash in (your take profit).
How to Figure Out Your Risk Per Trade
Your risk per trade is the dollar amount you are willing to lose if a setup fails. It’s the distance between your entry and your stop loss, multiplied by your position size.
Formula:Risk ($) = (Entry Price – Stop Loss Price) x Position Size
Example:
Imagine you want to buy EUR/USD at 1.0750. Your analysis indicates that if the price drops to 1.0720, your trade idea is invalid. This is your stop loss.
- The distance is 30 pips.
- If you trade one standard lot (where each pip is worth about $10), your risk is: 30 pips * $10/pip = $300.
Before entering, you know the absolute maximum you can lose is $300. For more on placing these levels, our guide on how to set an effective stop loss and take profit is a great resource.
How to Calculate Your Potential Reward
Your potential reward is the profit you're targeting if the trade works as planned. It’s the distance between your take profit and your entry.
Formula:Reward ($) = (Take Profit Price – Entry Price) x Position Size
Example:
Continuing with the EUR/USD trade, let's say your profit target is 1.0840.
- The distance is 90 pips.
- With one standard lot, your potential reward is: 90 pips * $10/pip = $900.
Now you have both sides of the equation: a $300 risk for a potential $900 gain.
How to Find the Risk-to-Reward Ratio
This is where it all comes together. The risk-to-reward ratio compares your potential gain directly against your potential loss, telling you if a trade is worth taking.
Formula:Risk-to-Reward Ratio = Potential Reward ($) / Risk Per Trade ($)
Example:
- $900 (Potential Reward) / $300 (Risk Per Trade) = 3
This gives you a 1:3 risk-to-reward ratio. You are risking $1 to potentially make $3. This is the positive asymmetry that professional traders look for.
Sample Risk to Reward Ratio Scenarios
| Risk:Reward Ratio | Risk per Trade ($) | Reward per Trade ($) | Breakeven Win Rate (%) | Implication for Trader |
|---|---|---|---|---|
| 1:1 | $100 | $100 | 50.0% | You must be right at least half the time just to not lose money. |
| 1:2 | $100 | $200 | 33.3% | You only need to win one out of every three trades to break even. |
| 1:3 | $100 | $300 | 25.0% | Provides a significant edge; only one winning trade is needed to cover three losses. |
Consistently finding trades with a ratio of 1:2 or better dramatically shifts the odds in your favor over the long run. For traders who build their own tools in spreadsheets, a handy AI formula generator can help set up these functions quickly.
Putting the Calculator to Work: Practical Examples
Theory is one thing, but making it work live is what matters. A risk and reward calculator turns your ideas into a concrete, actionable plan. Let's walk through two examples to see how this process works for any asset.
A EUR/USD Day Trade Example
You see a shorting opportunity on EUR/USD. The price has retested a resistance level at 1.08500 and is showing weakness. Here's how to map out the trade.
- Entry Price: Short at 1.08500.
- Stop Loss: Place it just above the recent high at 1.08550.
- Take Profit: Target a support level at 1.08350.
Calculation:
- Risk: The distance from entry (1.08500) to stop (1.08550) is 5 pips.
- Reward: The distance from entry (1.08500) to target (1.08350) is 15 pips.
- Result: A 1:3 risk-to-reward ratio. This is a high-quality setup worth considering.
An Index Trade on the US30
Now let's look at the US30 (Dow Jones). It pulls back to a support zone around 39,500, and you see bullish price action confirming the level.
- Entry Price: Go long at 39,500.
- Stop Loss: Place it below the support zone at 39,440.
- Take Profit: Target the next resistance level at 39,680.
Calculation:
- Risk: The distance from entry (39,500) to stop (39,440) is 60 points.
- Reward: The potential gain from entry (39,500) to target (39,680) is 180 points.
- Result: Another solid 1:3 risk-to-reward ratio. You're risking 60 points for a potential 180-point gain.
The instrument you trade is irrelevant. The process of defining risk and reward is universal. It connects your technical analysis to a sound risk management plan—the cornerstone of successful trading.
Why This Is Non-Negotiable in Prop Firm Trading
In prop trading, a risk and reward calculator is your lifeline. Data shows that only a small fraction of traders pass prop firm challenges, and the ones who succeed are masters of risk management. Failing to align your risk with the firm's rules is the number one reason traders fail.
Insisting on a minimum 1:2 risk-reward ratio is critical; with it, you only need to be right 33% of the time to break even. This disciplined, math-based approach is exactly what prop firms like MyFundedCapital want to see. Remember, your risk/reward calculator confirms the ratio, but your position size determines the dollar risk. Our guide on using a lot size calculator helps you align every trade with the firm's drawdown limits.
Aligning Your Calculator with Prop Firm Rules
Trading with a prop firm like MyFundedCapital adds a crucial layer of discipline. Your risk and reward calculator is the most important tool for navigating the two rules that matter most: the daily drawdown and the maximum drawdown.
Building a Drawdown Buffer
Think of your daily drawdown limit as a "health bar." At MyFundedCapital, this is typically 5%. On a $100,000 account, that’s a $5,000 buffer. Your job is to structure your risk so that even a string of losses won’t knock you out.
A professional approach is to cap your risk per trade at a small fraction of that daily limit.
- Set a hard personal rule: Risk only 0.5% to 1% of your account balance per trade.
- On a $100,000 account: A 0.5% risk is $500. This means you could take ten consecutive losses before hitting your daily limit.
- A 1% risk is $1,000, giving you room for five straight losses.
This builds resilience into your trading, allowing you to withstand a choppy market without threatening your account. Use your risk and reward calculator before every trade to enforce this personal cap.
A prop firm account is a marathon, not a sprint. Use your calculator to enforce a risk level that guarantees you can show up to trade again tomorrow, even after a losing day.
Modeling Your Path to the Profit Target
Once you've locked down your defense, use the calculator to map out your offense—hitting the profit target. Let’s model this for a $100,000 1-Step Challenge account with a $10,000 (10%) profit target.
Parameters:
- Risk Per Trade: 0.5% ($500).
- Minimum Risk-to-Reward Ratio: 1:2.
With these settings, every winning trade nets 1% ($1,000), while every loss costs 0.5% ($500). To hit the $10,000 target, you need 10 net winning trades. This doesn't mean winning 10 trades in a row. A sample journey could look like this:
- Win: +$1,000 (Account at $101,000)
- Win: +$1,000 (Account at $102,000)
- Loss: -$500 (Account at $101,500)
- Win: +$1,000 (Account at $102,500)
Even with a 50% win rate, your account grows steadily. This proves you don't need a heroic hot streak, just a consistent, disciplined process where your wins are mathematically larger than your losses. Data shows that very few traders operate with this level of discipline. For a deeper look at industry benchmarks, you can read the full analysis on prop trading pass rates.
FAQ: Your Risk and Reward Calculator Questions
What’s a good risk-to-reward ratio?
A 1:2 ratio is a widely accepted minimum starting point, as it allows you to break even with just a 33.3% win rate. However, the best ratio depends on your strategy. A high-frequency scalper might succeed with a 1:1 ratio and a high win rate, while a trend-follower needs a much higher ratio (e.g., 1:5) to make their large wins cover many small losses. Analyze your own trading data to find what works for you.
Should I risk the same percentage on every trade?
Yes, risking a consistent, small percentage of your account (e.g., 0.5% or 1%) is a cornerstone of professional trading. It removes emotion from position sizing and ensures that no single trade can significantly damage your account. This systematic approach is crucial for long-term survival and growth, especially in a prop firm environment.
How do I factor in spreads and commissions?
You must account for trading costs for an accurate calculation. A practical approach is to add the spread to your stop-loss distance and subtract it from your take-profit target in your calculator. For example, a trade that looks like a 1:2 ratio on paper might shrink to 1:1.8 after costs. Over hundreds of trades, this small difference has a massive impact on your bottom line.
Ready to apply these professional risk management principles? At MyFundedCapital, we provide the capital and straightforward rules you need to demonstrate your trading skills. Remember, trading involves substantial risk of loss and is not suitable for all investors. The content in this article is for educational purposes only and is not financial advice.
Explore our funding programs and find the challenge that’s right for you.