

 AR
AR
 NL
NL
 FR
FR
 DE
DE
 ES
ES
 PT
PT
 IT
IT
 PL
PL
 SV
SV


Calculating your profit and loss (P&L) is more than just math; it’s a core skill for survival in the markets. Misjudging your real returns or ignoring hidden costs can lead to blown accounts and flawed strategies. This guide will give you the practical formulas, concrete examples, and step-by-step processes you need to calculate P&L accurately and manage your risk effectively.
Why Accurate P&L Calculation is a Non-Negotiable Skill
Understanding how to calculate profit and loss isn't just a bookkeeping task—it's your most powerful tool for strategic decision-making. It provides the hard data needed to validate your strategy, manage risk, and maintain discipline. Without accurate P&L tracking, you are essentially trading blind, guided by emotion rather than objective performance metrics.
This is especially true when trading with a prop firm's capital. Firms enforce strict risk rules, like a 5% daily or 10% overall drawdown limit, to prevent catastrophic losses. Sloppy P&L management in this environment can lead to a quick and avoidable account failure. Understanding your exact net profit and loss on every trade is the foundation of long-term success.
Here's why getting it right is crucial:
- Strategy Validation: P&L data is the only objective way to determine if your trading system has a real edge over time.
- Effective Risk Management: It provides the raw numbers needed to set appropriate stop-losses and position sizes that align with your risk tolerance.
- Psychological Discipline: Facing your losses in concrete numbers helps you avoid the dangerous habit of ignoring small mistakes until they become account-ending disasters.
Beyond just doing the math, learning to interpret and act on your P&L data is what unlocks consistent success. For a deeper dive into the strategic side of this, check out Mastering Profit and Loss Management.
The Core Formulas for Calculating P&L
To truly manage your trading, you must look beyond the real-time P&L ticker on your platform and understand the math behind it. While the concept is simple—revenue minus costs—the specific calculations vary between asset classes like Forex, indices, and crypto. Mastering these formulas allows you to set precise targets and stop-losses based on real dollar amounts.
Think of it as a continuous feedback loop: you calculate your potential P&L, use that information to manage your risk, and refine your strategy based on the results.
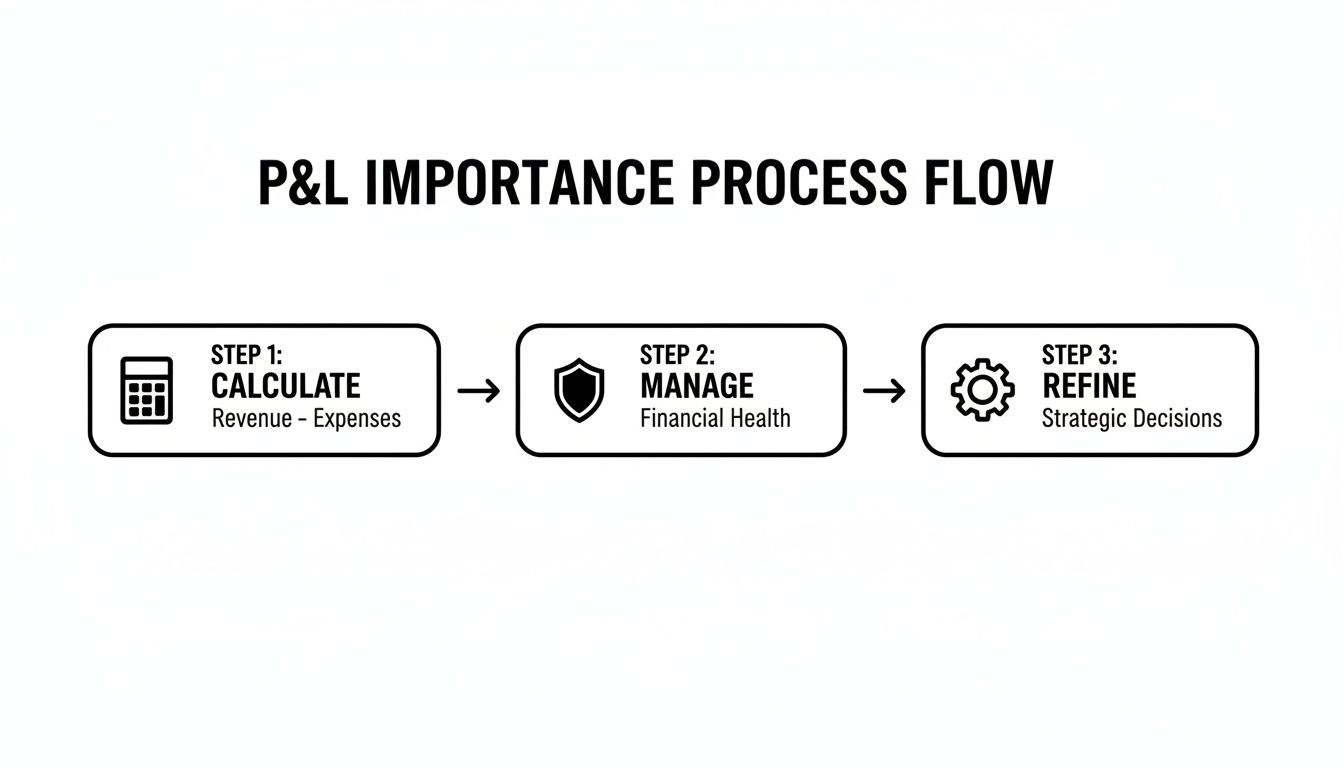
Here is a quick reference table breaking down the basic P&L formulas for major asset classes.
P&L Calculation Quick Reference by Asset Class
| Asset Class | Unit of Movement | Value per Unit (Example) | Core P&L Formula |
|---|---|---|---|
| Forex | Pips | $10 per pip (1 standard lot, EUR/USD) | (Pip Movement) x (Pip Value) x (Lot Size) |
| Indices | Points | $1 per point (1 lot, US30) | (Point Movement) x (Value per Point) x (# of Contracts) |
| Metals | Ticks / Points | $1 per tick (100 oz Gold contract) | (Price Change) x (Value per Tick) x (# of Contracts) |
| Crypto | USD (or quote currency) | $1 per $1 price change | (Exit Price – Entry Price) x (Quantity) |
Let's break down these formulas with practical, step-by-step examples.
Calculating Forex P&L
In Forex, profit and loss are determined by pips (the smallest unit of price change) and lot size. The gross P&L is calculated by multiplying the number of pips the price moved by the dollar value of each pip, which is set by your lot size.
Formula: Gross P&L = (Pip Movement) x (Pip Value) x (Lot Size)
For pairs where the USD is the quote currency (e.g., EUR/USD, GBP/USD) in a USD-based account, the pip values are standard:
- 1 standard lot (100,000 units): $10 per pip
- 1 mini lot (10,000 units): $1 per pip
- 1 micro lot (1,000 units): $0.10 per pip
Practical Example: EUR/USD
You buy 0.5 lots of EUR/USD at 1.0710 and close the trade at 1.0750.
- Calculate Pip Movement: 1.0750 (Exit) – 1.0710 (Entry) = 0.0040, or 40 pips.
- Determine Pip Value: For 0.5 lots, the pip value is half of a standard lot, so $5 per pip.
- Calculate Gross Profit: 40 pips x $5/pip = $200 Gross Profit.
Calculating Indices P&L
When trading indices like the US30, you work with points. The value of each point is determined by the specific index and the number of contracts (lots) you trade.
Formula: Gross P&L = (Point Movement) x (Value per Point) x (Number of Contracts)
On platforms like cTrader or DXtrade, one contract of the US30 typically has a point value of $1.
Practical Example: US30
You short 2 lots of US30 at 34,500 and exit at 34,350.
- Calculate Point Movement: 34,500 (Entry) – 34,350 (Exit) = 150 points.
- Determine Value per Point: With 2 lots, the value is $1 x 2 = $2 per point.
- Calculate Gross Profit: 150 points x $2/point = $300 Gross Profit.
Always check the contract specifications on your platform to confirm the point value, as it can vary.
Calculating Crypto P&L
Cryptocurrency P&L is often the most straightforward because assets like Bitcoin are typically quoted against the US Dollar. The profit is simply the price difference multiplied by the quantity traded.
Formula: Gross P&L = (Exit Price – Entry Price) x (Quantity of Crypto)
Practical Example: BTC/USD
You buy 0.10 BTC at a price of $29,500 and sell at $30,000.
- Calculate Price Movement: $30,000 (Exit) – $29,500 (Entry) = $500 gain per BTC.
- Calculate Gross Profit: $500 x 0.10 BTC = $50 Gross Profit.
While the math is simple, crypto's high volatility means P&L can swing dramatically, making precise calculations essential for risk management.
Calculating Net Profit: Factoring in Trading Costs
The gross profit from a trade is not what you actually keep. To find your net profit, you must subtract all associated trading costs, including spreads, commissions, and swap fees. Ignoring these costs gives you a misleading picture of your strategy's true performance.
Think of it like a business: revenue is meaningless without considering operating costs. For traders, the net P&L is the bottom line.
Step 1: Subtract Spreads and Commissions
The spread is the difference between the buy (ask) and sell (bid) price, while a commission is a fee charged for executing the trade.
Let's use our EUR/USD example to calculate the net profit:
- Gross Profit: $200
- Spread Cost: Assume a 1-pip spread. For a 0.5 lot position, this costs $5 (1 pip x $10/pip x 0.5 lots).
- Commission Cost: Assume a $7 per lot round-turn commission. For 0.5 lots, this costs $3.50.
Formula: Net P&L = Gross Profit – Spread Cost – Commission Cost
$200 – $5 – $3.50 = $191.50 Net Profit
These small fees add up significantly over time and can be the difference between a profitable and a losing strategy. According to Statista, a high percentage of retail traders lose money, often because their strategies cannot overcome these inherent costs. This is why prop firms like MyFundedCapital’s seek traders who can demonstrate a consistent edge.
Step 2: Account for Overnight Swap Fees
If you hold a position overnight, you will incur a swap fee (or receive a credit), which is based on the interest rate differential between the currencies in a pair.
Let's say you held the 0.5 lot EUR/USD trade for three nights, and the daily long swap fee was $3.12.
- Total Swap Cost: $3.12/night x 3 nights = $9.36.
Now, we deduct this from our previous net profit:
$191.50 (Net Profit before Swaps) – $9.36 (Swap Cost) = $182.14 Final Net Profit
Our initial $200 gross profit has been reduced by nearly 9% due to costs. This highlights the importance of calculating your full, final net profit for every trade.
P&L for Prop Firm Traders: Hitting Targets and Managing Drawdown
For a prop firm trader, P&L calculation is a tool for survival. Every trade must be viewed through the lens of your profit target and, more critically, your drawdown limits. Connecting your P&L to these rule-based percentages is essential for passing challenges and maintaining a funded account.
How to Translate P&L into Percentages
Prop firms operate on performance percentages, not raw dollar amounts. You must be able to translate every trade's outcome into these terms.
- Profit Target %:
(Current Balance - Starting Balance) / Starting Balance * 100 - Drawdown %:
(Starting Balance - Current Equity) / Starting Balance * 100
Example: Hitting a 10% Profit Target
You start a $100,000 challenge. After a series of winning trades, your balance reaches $110,000.
- Calculation:
($110,000 - $100,000) / $100,000 * 100 = 10%- Result: You have successfully met the profit target.
Managing Drawdown with Real-Time P&L
Avoiding your drawdown limit is the single most important rule. A violation, even for a moment, typically results in immediate account termination. The two primary types are:
- Maximum Drawdown: An absolute floor your equity cannot cross. For a $100k account with a 10% max drawdown, your equity cannot drop below $90,000.
- Daily Drawdown: A limit on losses within a 24-hour period, usually 5% of the previous day's closing balance or equity.
Practical Drawdown Scenario
You are trading a $100,000 account with a 5% daily drawdown. You finished yesterday with a balance of $102,000.
- Today's Drawdown Limit: $102,000 * 5% = $5,100.
- Breach Level: Your equity cannot fall below $102,000 – $5,100 = $96,900.
You enter a trade that quickly goes against you, showing a floating loss of -$4,500. Your real-time equity is now $97,500 ($102,000 balance – $4,500 floating loss). You are now just $600 away from violating your daily limit. This is where precise, real-time P&L calculation becomes your most critical risk management tool.
Understanding the difference between static and trailing drawdowns is also crucial. For a detailed explanation, see our guide on what trailing drawdown is.
How Leverage Impacts Your P&L
Leverage allows you to control a large position with a small amount of capital (margin), amplifying both potential profits and losses. A small market movement can result in a significant P&L swing, making it a double-edged sword that must be managed carefully.
Example of Leverage in Action
Imagine you have a $10,000 account with 1:30 leverage and you want to buy 1 standard lot ($100,000) of EUR/USD.
- Margin Required: $100,000 / 30 = $3,333. This amount is locked up to keep the trade open.
- P&L Impact: A 1% move in EUR/USD results in a $1,000 profit or loss on your $100,000 position.
- Return on Account: That $1,000 P&L represents a 10% gain or loss on your $10,000 account.
This demonstrates how leverage magnifies outcomes. A 1% market move created a 10% P&L swing on your account equity.
Using Percentage Returns to Measure Performance
While dollar P&L is important, percentage return, or Return on Investment (ROI), is a better measure of performance because it allows you to compare trades of different sizes.
Formula: ROI (%) = (Net Profit / Capital Invested) x 100
In the example above, where you made a $1,000 net profit using $3,333 of margin:
- ROI on Margin: ($1,000 / $3,333) x 100 = 30% ROI
- ROI on Total Account: ($1,000 / $10,000) x 100 = 10% ROI
Tracking ROI helps you understand the efficiency of your capital deployment. Knowing how to calculate rate of return is a key metric for proving you have a consistent trading edge.
Remember, trading involves a significant risk of loss and is not suitable for all investors. This content is for educational purposes only and is not financial advice.
Frequently Asked Questions (FAQ)
What’s the difference between balance and equity?
Balance is your account's value including only closed positions; it's a historical record. Equity is the real-time value of your account, calculated as your balance plus or minus the profit or loss from any open positions. Prop firm drawdown rules are based on equity, making it the most important number to watch for risk management.
How do I calculate P&L if I only close part of a trade?
When you partially close a position, you realize the profit or loss only on the portion you closed. If you are long 1.0 lot of US30 and are up 50 points (a $50 floating profit), and you close half (0.5 lots), you lock in a profit of $25 (50 points x $1/point x 0.5 lots). This $25 is added to your balance, while the remaining 0.5 lot position continues to float with the market.
Why doesn't my manual P&L calculation match my platform exactly?
Small discrepancies between your calculation and the platform's figure are common and usually due to:
- Currency Conversion: If your account is in USD but you trade a non-USD pair like GBP/JPY, the platform must convert the P&L from JPY to USD at a fluctuating exchange rate.
- Precise Execution Costs: The exact spread at the moment of execution might differ slightly from the one you used in your calculation.
- Swap Fees: If you held the trade overnight, swap fees are automatically deducted, which you may have forgotten to include in your manual calculation.
Take Your Trading to the Next Level
Mastering P&L calculation is a critical step in transitioning from an aspiring trader to a disciplined professional. It provides the clarity needed to refine your strategy, manage risk effectively, and build a consistent track record. If you have the skills and are ready to trade with significant capital, proving your abilities in a funded challenge is the next logical step.
Explore our funded trading accounts to find a program that aligns with your trading style.
Ready to prove your P&L management skills? Compare our funding programs and start your journey today.
