Struggling to make sense of cluttered charts and lagging indicators? This guide strips trading back to its core, showing you how to read price action directly from a "naked" chart. You'll learn a complete, rule-based price action trading strategy for identifying trends, finding high-probability entries, and managing risk like a professional.
What Is Price Action Trading, Really?
Think of price action trading less as a secret formula and more as learning the language of the market. Instead of relying on oscillators or moving averages to tell you what to do, a price action trader asks a more direct question: "What are the buyers and sellers actually doing right now?"
The fundamental belief is that all known information—news, economic reports, sentiment—is already reflected in the price. By learning to read candlestick patterns, understand market structure, and identify key levels, you’re getting your information straight from the source. This approach is not a prediction tool; it's a framework for identifying high-probability scenarios based on historical price behavior.
Why Price Action Works for Prop Firm Rules
For traders in a funded account program, this approach can be a game-changer. Prop firms like MyFundedCapital have strict risk rules, like a 5% daily drawdown limit. A solid price action strategy naturally instills the discipline required to stay within these rules. It forces you to wait patiently for A+ setups at significant levels, which automatically helps filter out the low-quality, impulsive trades that can quickly end a challenge.
The goal is clarity, not complexity. Price is the purest form of information. Every indicator is just a derivative of price, which means it’s always one step behind.
When you focus on "naked" charts, you start to develop a real feel for the market's rhythm. You learn to spot where institutional orders are likely clustered and where momentum is most likely to shift.
Core Components of a Price Action Strategy
Every functional price action strategy stands on a few essential pillars. Nail these, and you're building a system that can be applied consistently. Let's break down what really matters.
| Component | Description | Importance for Funded Traders |
|---|---|---|
| Market Structure Analysis | Identifying the trend (or lack thereof) by mapping out higher highs, lower lows, and key swing points. It tells you which direction to trade. | Prevents you from fighting the dominant market flow, which is a common way to hit your daily drawdown limit. |
| Key Support & Resistance | Pinpointing horizontal zones where price has repeatedly reacted in the past. These are your high-probability areas for trade setups. | Provides logical, low-risk areas to enter trades and place your stop-loss, keeping you well within prop firm risk parameters. |
| Candlestick Entry Patterns | Recognizing specific candle formations (like Pin Bars or Engulfing Bars) that act as a trigger for entry at your key levels. | Acts as the final confirmation, improving the odds of the trade working out and preventing premature entries. |
| Risk & Trade Management | Having strict, pre-defined rules for position size, stop-loss placement, and how you'll take profits. | This is non-negotiable. It ensures you protect your funded account and can trade for the long term. |
Think of these components as your complete trading plan. Getting them right helps you trade systematically, taking the emotion and guesswork out of the equation. This isn't about having a crystal ball; it's about systematically putting the odds in your favor, one trade at a time. If you want to explore how this fits into the bigger picture, we've covered more in our guide on the best methods of analysis for forex trading.
Step 1: Map the Market Structure and Key Levels
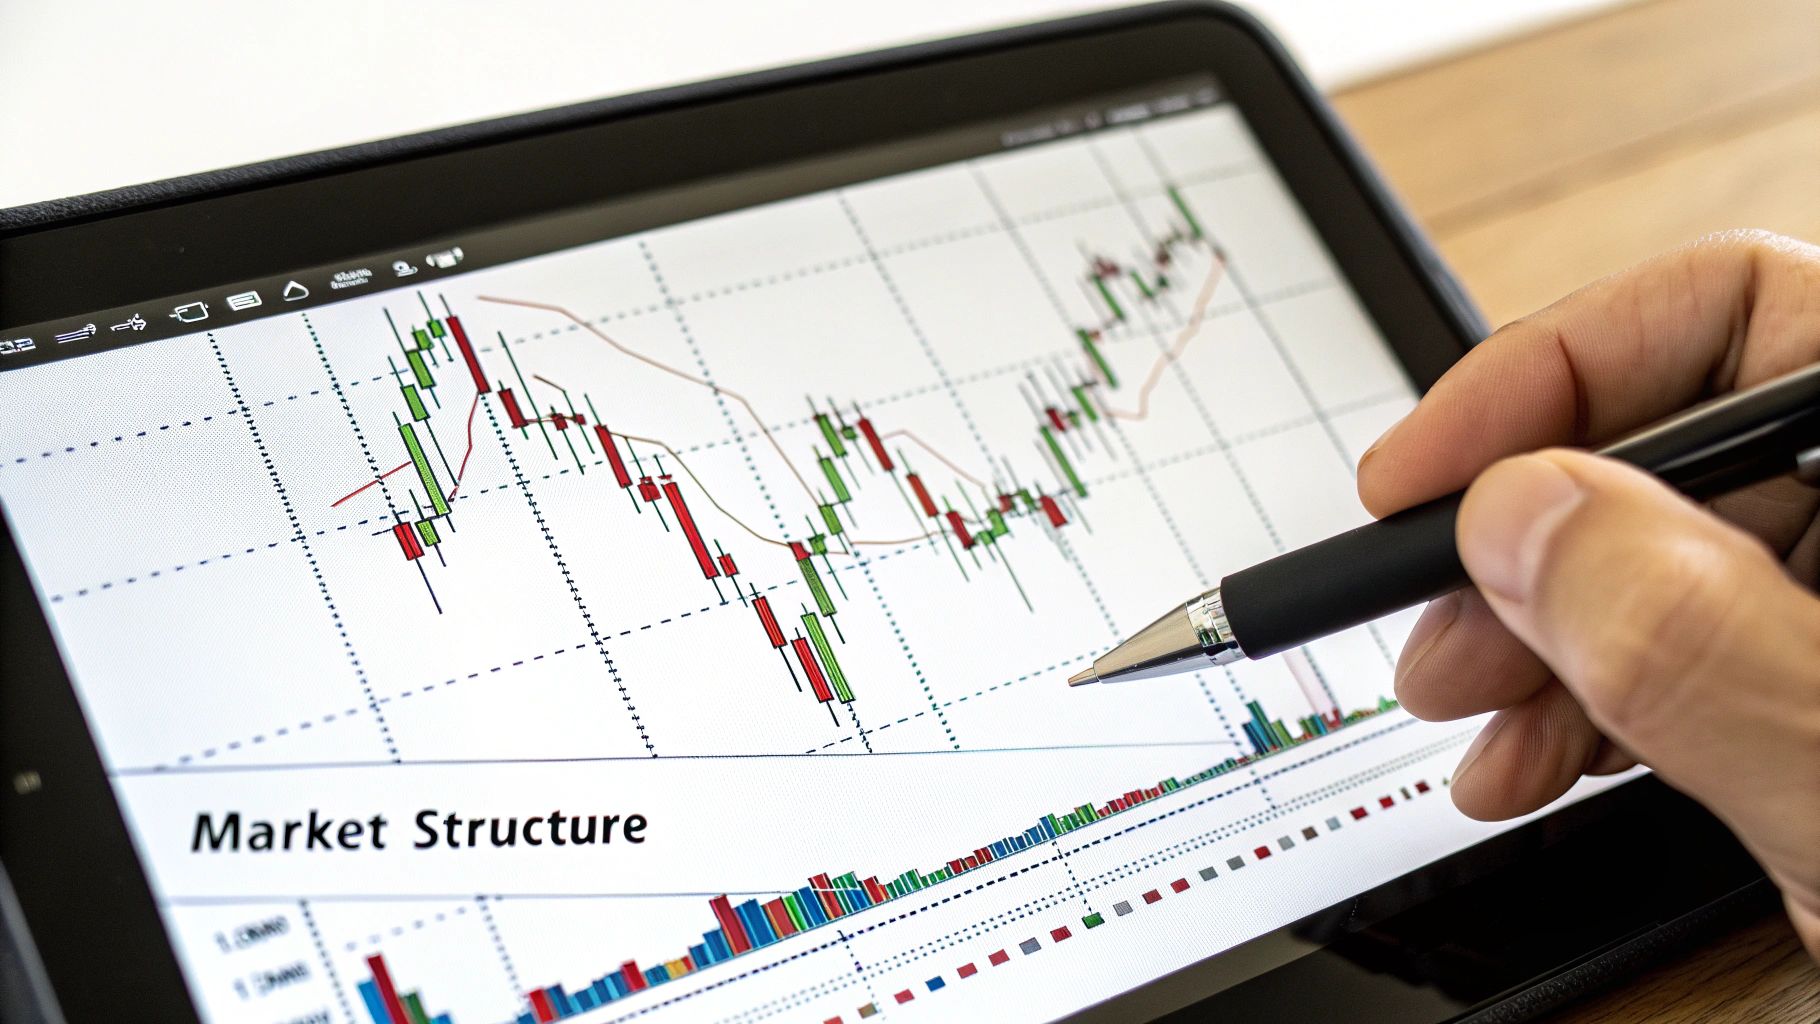
Before you consider entering a trade, you must understand the market context. A solid trading plan always starts with a top-down analysis to establish a clear directional bias. For a funded trader, this is non-negotiable; it's your primary defense against hitting a daily drawdown limit by trading against the dominant trend.
Start with a Higher Timeframe
To get a true feel for the market's intention, your first stop should always be a higher timeframe chart, like the 4-hour (H4) or the Daily (D1). This is where you map out the market structure—the series of swing highs and lows that tells you who’s in control.
- Uptrend: A clear series of higher highs (HH) and higher lows (HL).
- Downtrend: A clear pattern of lower highs (LH) and lower lows (LL).
- Range: Price is bouncing between a defined high and low, making no directional progress.
This single exercise tells you which side to be on. In a clear uptrend, you should only look for buy setups. In a downtrend, your focus is entirely on sell setups.
Key Takeaway: Your high-timeframe analysis dictates your actions on lower timeframes. If the H4 chart is clearly bullish, you have no business hunting for short-term sells on the 15-minute chart. This discipline alone will save you from a significant number of losing trades.
This structured approach taps into the fundamental rhythm of the market. To dig deeper into the dynamics of buying and selling pressure, you can explore our breakdown of Auction Market Theory.
Identify and Validate Key Zones
Once you know the trend, find the key support and resistance zones. Note the word zones, not thin lines. Price rarely turns at a precise point; it reacts within broader areas where significant buying or selling has occurred before.
- Support Zone: An area where buyers have previously stepped in, causing prices to rise.
- Resistance Zone: An area where sellers have previously taken control, causing prices to fall.
The more times price has respected a zone (more "touches"), the more significant it becomes, as more traders will be watching it. For more advanced data modeling, developers often use various web scraping API tools to pull real-time data feeds, which can be essential for mapping complex market structures and building more sophisticated analytical models.
How to Draw Zones on Your Chart
- Start on the Daily or H4 chart. Find the clear swing points where the market made a major turn.
- Use the rectangle tool to draw a box covering the cluster of candle bodies and wicks at that pivot point.
- Extend the box out to the right. This highlights potential future areas of reaction.
- Look for confluence. Does your zone line up with anything else, like a major moving average or a Fibonacci level? Confluence makes a level exponentially stronger.
By mapping structure and key zones before looking for an entry, you create a strategic roadmap. You stop reacting to random noise and start waiting patiently for A+ setups to form at locations where the odds are stacked in your favor.
Step 2: Identify High-Probability Entry Signals
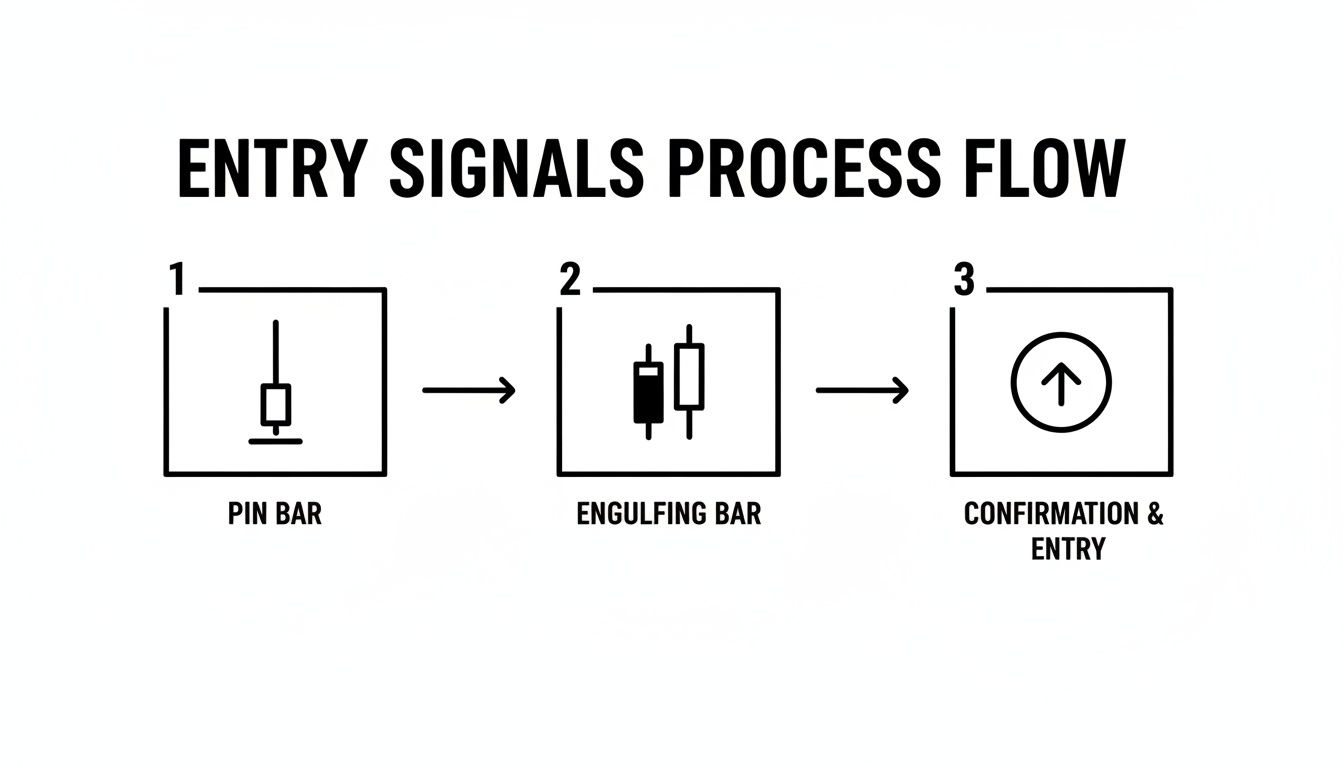
You've done the high-level analysis, marked your key zones, and have a directional bias. Now it's time to shift from analyst to sniper, patiently waiting for a specific, actionable signal to enter the market. A high-probability entry signal is the final confirmation that buyers or sellers are actively defending the zone you've identified. We need to wait for a specific candlestick pattern that tells a clear story of a momentum shift.
Master Two Powerful Candlestick Triggers
We'll focus on two of the most reliable candlestick patterns: the Pin Bar and the Engulfing Bar. These patterns are effective because they paint a vivid picture of a battle where one side has won a decisive victory. They signal "rejection" and a potential shift in momentum.
The Pin Bar (Rejection Candle)
A Pin Bar is a single candlestick with a long wick (or tail) and a small body. The long wick is crucial—it shows that price tried to push aggressively in one direction but was forcefully rejected by overwhelming opposition before the candle closed.
Checklist for a Valid Pin Bar:
- Wick Length: The wick must be at least 2x the length of the candle's body. A 3x wick is an even stronger signal.
- Location: It must form at a pre-identified key support or resistance level. A pin bar in the middle of nowhere is just noise.
- Context: The signal must align with the higher timeframe trend. A bullish pin bar (long lower wick) at support is a powerful buy signal if the market is in an uptrend.
The Engulfing Bar (Momentum Shift)
The Engulfing Bar is a two-candle pattern that signals a more aggressive and sudden shift in control. The pattern forms when the second candle's body completely "engulfs" the entire body of the previous candle.
Checklist for a Valid Engulfing Bar:
- Bullish Engulfing: A large green candle completely swallows the body of the previous small red candle, signaling that buyers have stepped in with overwhelming force.
- Bearish Engulfing: A large red candle completely engulfs the body of the previous small green candle, showing sellers have taken complete control.
- Location: Like the Pin Bar, its reliability increases dramatically when it appears at a significant support or resistance zone.
Patience is Your Edge: The real skill is waiting. Waiting for a textbook Pin Bar or a perfect Engulfing Bar to form at a level you marked hours ago is the mark of a professional. This patience is what will keep you out of mediocre trades and save your capital for the best opportunities.
Backtesting data often shows the robustness of these patterns. For instance, in major pairs like EUR/USD, pin bars at clean horizontal levels can show win rates of 60-65% when traded in line with the higher-timeframe trend. You can see the historical performance data on price action patterns for yourself to dig deeper.
Step 3: Execute Trades with Precision and Discipline
Finding a great setup is only half the battle. If your execution is sloppy, even an A+ trade idea can turn into a loser. In the prop firm world, where every pip of risk is scrutinized, flawless execution isn't a goal—it's a requirement. This section is your pre-flight checklist for every trade.
Entry Protocols and Stop-Loss Placement
You've spotted a perfect Pin Bar or Engulfing Bar at a key level. Here’s how to act:
Entry:
- While entering as soon as the signal candle closes is valid, consider waiting for a slight pullback to the 50% level of the candle.
- This patient entry can offer a better price, allowing for a tighter stop-loss and a significantly better risk-to-reward ratio.
Stop-Loss Placement:
This is your most critical decision. It’s your safety net and must be placed logically.
- For a Bullish Setup (Buy): Set your stop-loss 5-10 pips below the absolute low of the signal candle's wick.
- For a Bearish Setup (Sell): Place your stop-loss 5-10 pips above the absolute high of the signal candle's wick.
This placement gives the trade room to breathe and ensures that if the setup's core logic (price rejection) is invalidated, you exit with a small, pre-defined loss.
Risk-to-Reward and Profit Targets
Adopt a non-negotiable, minimum 2:1 risk-to-reward (R:R) ratio. For every $1 you risk, your plan must target at least $2 in profit. This is a cornerstone of long-term survival and is essential for passing prop firm challenges.
With a 2:1 R:R, you only need to be right 34% of the time to break even (excluding fees). At a 40% win rate, you are profitable. This removes the pressure to win every trade and lets your statistical edge play out.
Your profit target must be logical:
Look to the left on your chart to find the next clear area of support or resistance. That is your most logical first target. If that level offers at least a 2:1 R:R, the trade is valid. If not, you must skip the trade, no matter how good it looks.
Position Sizing for Prop Firm Success
Incorrect position sizing is the #1 reason traders fail funding challenges. The rule is simple and absolute: risk no more than 1% of your account balance on any single trade.
On a $100,000 account, a 1% risk means your maximum loss is capped at $1,000. This rule is not a suggestion. It ensures a string of losses won't destroy your account and keeps you safely within the 5% daily drawdown limit.
How to Calculate Your Lot Size:
- Define Risk in Dollars: On a $100k account, 1% risk = $1,000.
- Define Stop-Loss in Pips: Measure the distance from your entry to your stop-loss price. Let's say it's 25 pips.
- Calculate: Use a position size calculator. It will tell you the exact lot size to use to ensure that a 25-pip loss equals a $1,000 loss.
This mechanical process removes emotion from the equation. You are no longer guessing; you are managing risk methodically, a key component of our wider framework for sound forex risk management strategies.
FAQ: Common Price Action Trading Questions
Here are answers to some common questions traders have when implementing a price action strategy.
What's the best timeframe for a price action strategy?
There's no single "best" timeframe; it depends on your trading style. However, a multi-timeframe approach is highly effective. Use a higher timeframe (like the H4 or Daily) to identify the overall market trend and mark key support/resistance zones. Then, drop down to a lower timeframe (like H1 or M15) to look for your specific candlestick entry signals. This top-down analysis ensures you are trading in alignment with the larger market flow.
How many currency pairs should I focus on?
When starting out, less is more. Pick just one to three major pairs (e.g., EUR/USD, GBP/USD) and learn their behavior inside and out. Understanding a market's unique personality—how it reacts to news, its typical volatility during different sessions—is a significant edge. Spreading yourself too thin leads to sloppy analysis and missed opportunities. Master one or two pairs before expanding your watchlist.
Can I use indicators with a price action strategy?
While the core of this strategy is "naked" chart trading, a simple indicator can be used for confirmation. For example, a 20-period Exponential Moving Average (EMA) can help visualize the short-term trend and act as dynamic support or resistance. The golden rule is: the indicator should only confirm what price action is already telling you. Never take a trade based solely on an indicator, as it will always lag behind the actual price.
How do I know if a support or resistance level is strong?
A strong level has been respected multiple times in the past. To identify one, look left on your chart for areas where price has clearly reversed or consolidated. The more "touches" a level has, the more significant it is. For the highest probability setups, look for confluence, which is where a horizontal level lines up with another technical factor, like a trendline or a major Fibonacci level.
Ready to prove your edge? A disciplined price action trading strategy is exactly what prop firms like MyFundedCapital look for in traders. We provide the capital and platform for you to demonstrate your skills.
Explore our funding programs and start your challenge today.
Disclaimer: All content is for educational purposes only and is not financial advice. Trading involves a significant risk of loss and may not be suitable for all investors.