Spotting a candlestick pattern like the shooting star can feel like finding a secret code on your charts. This guide will teach you how to identify this powerful bearish reversal signal and build a practical, step-by-step trading plan around it. By the end, you'll know exactly how to filter for high-probability setups and manage your risk like a professional trader.
What a Shooting Star Reveals About Market Psychology
A shooting star candlestick isn’t just a random shape; it’s a snapshot of a critical power shift. After a strong uptrend, this candle tells us the buyers are finally running out of steam.
Buyers pushed the price up during the session, creating a new high. However, they couldn't hold it. Sellers saw the overextended price, jumped in, and pushed the price all the way back down to close near the open. That long upper wick is the visual evidence of the struggle, and the small body at the bottom shows who won.
Why This Pattern Matters to Traders
For a trader, spotting a shooting star provides actionable information you can build a trade around. It's a clear signal that can help you make more informed decisions.
- A Clear Warning Sign: It’s often the first hint that a strong uptrend is losing momentum and could be ready to reverse.
- Proof of Bullish Exhaustion: It shows that buying pressure is fading, leaving the market vulnerable to a downward move.
- A Built-In Risk Level: The high of the candle gives you a logical, pre-defined level to place your stop-loss, immediately defining your risk if you decide to take a short position.
A single shooting star is a signal, not a guarantee. Smart traders wait for confirmation—like a strong bearish candle closing below the shooting star's low—before entering a trade. Remember, all trading involves significant risk of loss and no pattern is foolproof. This content is for educational purposes only and is not financial advice.
How to Identify a Perfect Shooting Star
Knowing the difference between a real shooting star candlestick and a weak lookalike is crucial. A true shooting star isn't just about its shape; it’s about the context and the story it tells. It signals a powerful rejection of higher prices after a rally has lost steam.
This visual guide breaks down the battle between buyers and sellers that creates the shooting star pattern.
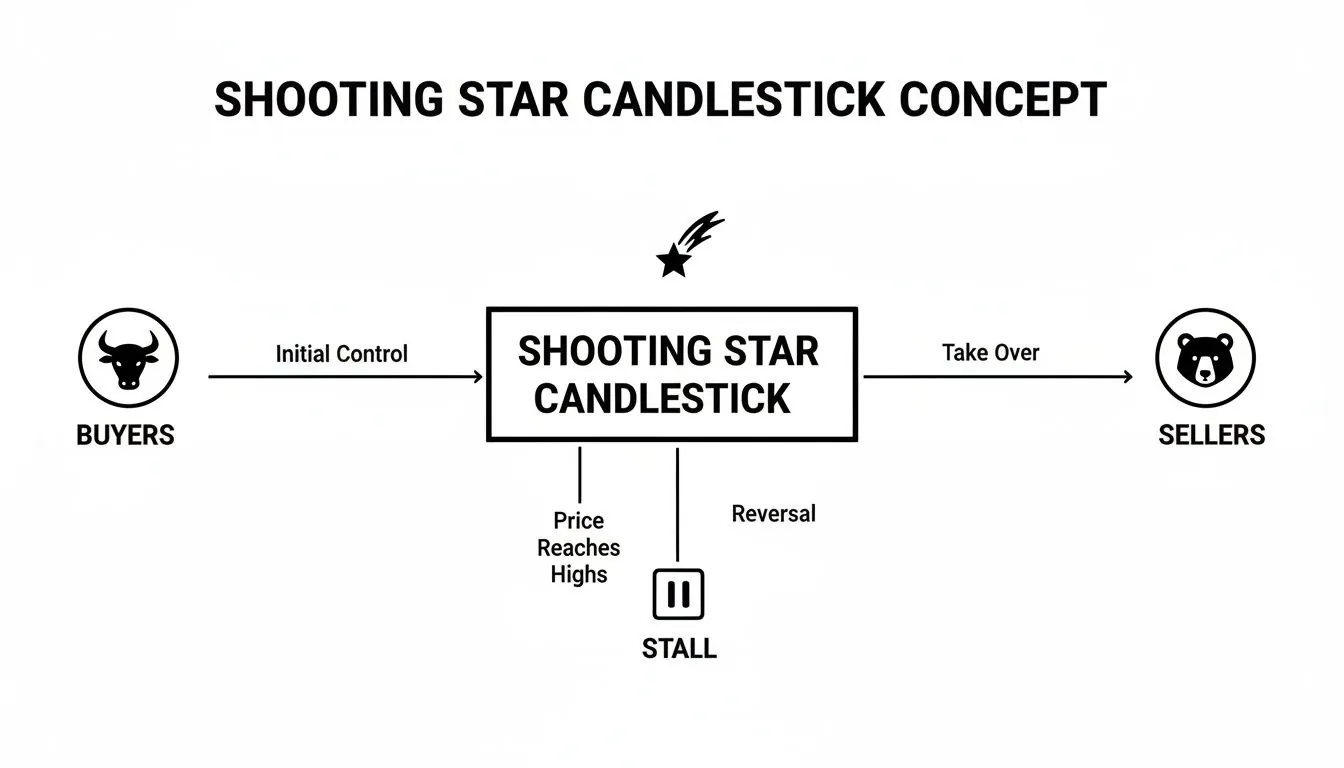
The flowchart above clearly shows how control shifts from optimistic buyers to dominant sellers, which is the entire premise behind this reversal signal.
The Anatomy of a High-Quality Shooting Star
Think of this as a quick diagnostic check on your chart. A high-probability shooting star must meet four specific criteria. If any are missing, the signal's reliability drops significantly.
Here's the four-point checklist to use:
- 1. It Must Appear After an Uptrend: Context is everything. The shooting star is a reversal pattern, which means it needs an established uptrend to reverse. A similar shape in a sideways or downtrending market is not a valid signal.
- 2. The Upper Wick Must Be Long: This is the most crucial element. The upper wick must be at least twice the length of the real body. That long wick is the visual proof that buyers tried to push prices higher but were aggressively beaten back down.
- 3. There Should Be Little to No Lower Wick: An ideal shooting star has a tiny lower wick or none at all. This shows sellers were in control, preventing the price from dropping much before it closed near the open.
- 4. The Body Must Be Small and Low: The real body needs to be small and located at the bottom of the candle's total range. A small body represents indecision, showing the closing price ended very near the opening price, neutralizing the buyers' initial momentum.
Don't Confuse It with an Inverted Hammer
It's common for new traders to mix up a shooting star with its bullish cousin, the inverted hammer. They look identical, but they signal opposite moves because of where they appear on the chart.
Here’s a simple checklist to tell them apart.
Shooting Star vs Inverted Hammer Identification Checklist
| Characteristic | Shooting Star (Bearish Reversal) | Inverted Hammer (Bullish Reversal) |
|---|---|---|
| Location | Appears at the top of an uptrend | Appears at the bottom of a downtrend |
| Implication | Signals a potential top and price decline | Signals a potential bottom and price rally |
| Market Story | Buyers lost control to sellers | Sellers lost control to buyers |
| Trader's Action | Look for short (sell) opportunities | Look for long (buy) opportunities |
While both patterns suggest a reversal is possible, a shooting star warns of a potential top, while an inverted hammer hints at a market bottom. This distinction is fundamental when analyzing chart patterns in forex.
A Step-by-Step Strategy for Trading the Pattern
Seeing a shooting star is one thing; trading it profitably is another. A single candle isn't a complete trade signal—it's a clue. To turn that clue into a high-probability setup, you need a trading plan with clear rules for entry, exit, and risk management.

This framework is about moving beyond just spotting a pattern. It provides a concrete method to filter out noise, know your exact risk before you enter, and have a logical plan for taking profits.
Step 1: Wait for Confirmation Before Entry
Never enter a short trade the moment a shooting star closes. This is a common mistake that leads to getting stopped out on false signals. Think of the shooting star as a warning, not a green light to sell.
The key is to wait for bearish confirmation. You need proof that sellers are following through on the weakness that the shooting star indicated.
- The Confirmation Rule: Only consider entering a short position after the next candle closes below the low of the shooting star's real body.
- Why It Matters: This filter helps you avoid many "fakeouts" where the market pauses briefly before continuing higher. A close below the body's low confirms that momentum has likely shifted to the downside.
Step 2: Define Your Exit with a Stop Loss
Your stop-loss is the most important part of your trade plan. It defines your maximum risk and protects your capital if the trade goes against you. With the shooting star, placing it is simple and logical.
Place your stop-loss just above the high of the shooting star’s long upper wick.
This placement makes sense because the high of the wick is the exact point where buyers lost control. If the price breaks above that level, the bearish setup is invalidated, and you should exit the trade to limit your loss.
Step 3: Set Clear Profit Targets
Once you're in a trade with your risk defined, you need to know where to take profit. "Hoping" for more profit is not a strategy. You need a data-driven plan for exiting.
Here are two practical ways to set your take-profit levels:
- Target Significant Support Levels: Look at your chart to identify the nearest major support zone. This could be a previous swing low, a major pivot point, or a key moving average. These are areas where buyers are likely to step in, making them logical spots to take profits.
- Use a Favorable Risk-to-Reward Ratio: A core principle of successful trading is ensuring your potential wins are larger than your potential losses. Aim for a minimum risk-to-reward ratio of 1:2. This means for every $1 you risk, your goal is to make at least $2 in profit.
For example, if your stop-loss is 30 pips from your entry, your first profit target should be at least 60 pips away. This discipline is a critical part of any price action trading strategy and is essential for long-term consistency.
Advanced Techniques to Improve Your Win Rate
Spotting a shooting star candlestick is a good start, but trading on the pattern alone is risky. The real edge comes from confluence—finding spots on the chart where multiple signals point to the same outcome. When a shooting star forms where other technical tools also suggest a reversal, your odds of a successful trade increase significantly.
Find Confluence at Key Resistance Levels
The most powerful shooting star patterns appear at significant resistance levels where the price has struggled to break through in the past. When a shooting star's long wick pushes into a major resistance zone and is rejected, it provides a strong dual signal:
- The Pattern: The shooting star shows sellers overwhelmed buyers within that single candle.
- The Location: The resistance level confirms this is a historical area where sellers have been strong.
When these two factors align, it tells a clear story that sellers are defending their territory, giving you a more solid reason to consider a short position.
Combine with Moving Averages and Fibonacci
Beyond static horizontal levels, you can find setups using dynamic resistance tools.
- Moving Averages as Dynamic Resistance: In a downtrend, key moving averages like the 20-period or 50-period EMA often act as resistance. When the price pulls back to one of these MAs and prints a shooting star, it can be a classic sign that the pullback is over and the downtrend may resume.
- Fibonacci Retracement Levels: After a significant price drop, it’s common for the price to retrace part of that move. The 61.8% Fibonacci retracement level is a well-known area where a bounce might fail. A shooting star forming at the 61.8% level is a strong signal that bears are regaining control.
Confirm with RSI Divergence
For an additional layer of confirmation, you can check for bearish divergence on the Relative Strength Index (RSI). Bearish divergence occurs when the price chart makes a new high, but the RSI chart makes a lower high.
This disagreement is a major warning sign. It suggests that even though the price made a slightly higher peak, the underlying momentum is weakening. When a shooting star appears on that final price high while the RSI shows bearish divergence, you have strong confirmation.
Applying This Strategy Within Prop Firm Rules
A trading strategy is only useful if it aligns with the rules you have to follow. For prop firm traders, this is critical. Every setup must be viewed through the lens of strict risk management, and the shooting star pattern provides a clear framework that helps you operate within your firm’s limits.

The shooting star setup helps enforce proper risk management. By placing a stop-loss just above the candle's high, you define your maximum loss from the start. This is crucial for navigating the tight daily loss limits that prop firms enforce.
Aligning Strategy with Drawdown Limits
If you're trading with a firm like MyFundedCapital, you're likely working with a 5% daily drawdown and a 10% max drawdown rule. The shooting star setup fits these rules well. Because your stop-loss is placed close to your entry, the potential loss on any given trade is naturally contained, making it much harder to accidentally exceed your daily limit.
This kind of discipline is non-negotiable. For a deeper dive into protecting your trading capital, read our complete guide to risk management in forex trading.
Using Statistics to Set Realistic Expectations
Knowing a pattern's historical performance helps you build confidence and set realistic goals. Data from "The Pattern Site" shows the shooting star pattern correctly signals a bearish reversal 59% of the time. Another backtest from the Liberated Stock Trader YouTube channel and a shooting star candlestick backtest on Quantified Strategies highlight how performance can vary based on test parameters.
The key takeaway is that statistics provide a guide, not a guarantee. They help you understand probabilities. The pattern's performance statistics on ThePatternSite.com also show it performs well in bear markets, with the percentage of trades hitting their price target rising significantly.
For a prop trader, this data helps you gauge if a trade is worth taking. A clean shooting star on a higher timeframe (like the 4-hour or daily chart) may have the potential for a larger move, making it a candidate for hitting the profit targets required to pass an evaluation.
Frequently Asked Questions
Here are answers to some of the most common questions about the shooting star pattern.
What Is the Main Difference Between a Shooting Star and an Inverted Hammer?
While they look identical, the difference is all about market context. A shooting star is a bearish reversal pattern that appears after an uptrend. An inverted hammer is a bullish reversal pattern that appears at the bottom of a downtrend. Their location on the chart determines their meaning.
How Reliable Is the Shooting Star Pattern?
Its reliability is not fixed. Backtesting data suggests a bearish reversal success rate of around 59%, but this can change based on market conditions, the asset being traded, and the timeframe. The pattern is generally more reliable in a confirmed bear market. Never rely on any single pattern alone; it's a clue, not a crystal ball.
Can I Trade This Pattern on Its Own?
No, you should never trade the shooting star in isolation. This is a common mistake that leads to losses from false signals. Always look for confluence, which means other technical factors support the bearish signal. These can include:
- A major resistance level.
- Rejection of a key moving average (e.g., 50 EMA).
- A key Fibonacci retracement level (e.g., 61.8%).
- Bearish divergence on an indicator like the RSI.
What Is the Best Timeframe to Trade the Shooting Star?
The pattern can appear on any timeframe, but its significance increases with the timeframe. A shooting star on a 4-hour or daily chart carries much more weight and suggests a potentially larger price move than one on a 5-minute chart. Higher-timeframe signals should be given more attention in your analysis.
Ready to apply this knowledge with real capital? At MyFundedCapital, we provide the funding for you to prove your trading skills on a simulated account. Compare our funding programs and start your journey to getting funded today.