Trying to time the bottom of a market before a new uptrend begins is a common goal for traders, but it's notoriously difficult. This guide explains how to use the reverse head and shoulders pattern, a reliable formation that signals a potential end to a downtrend. You will learn the specific steps to identify, validate, and trade this pattern with a clear, risk-managed plan.
What is a Reverse Head and Shoulders Pattern?
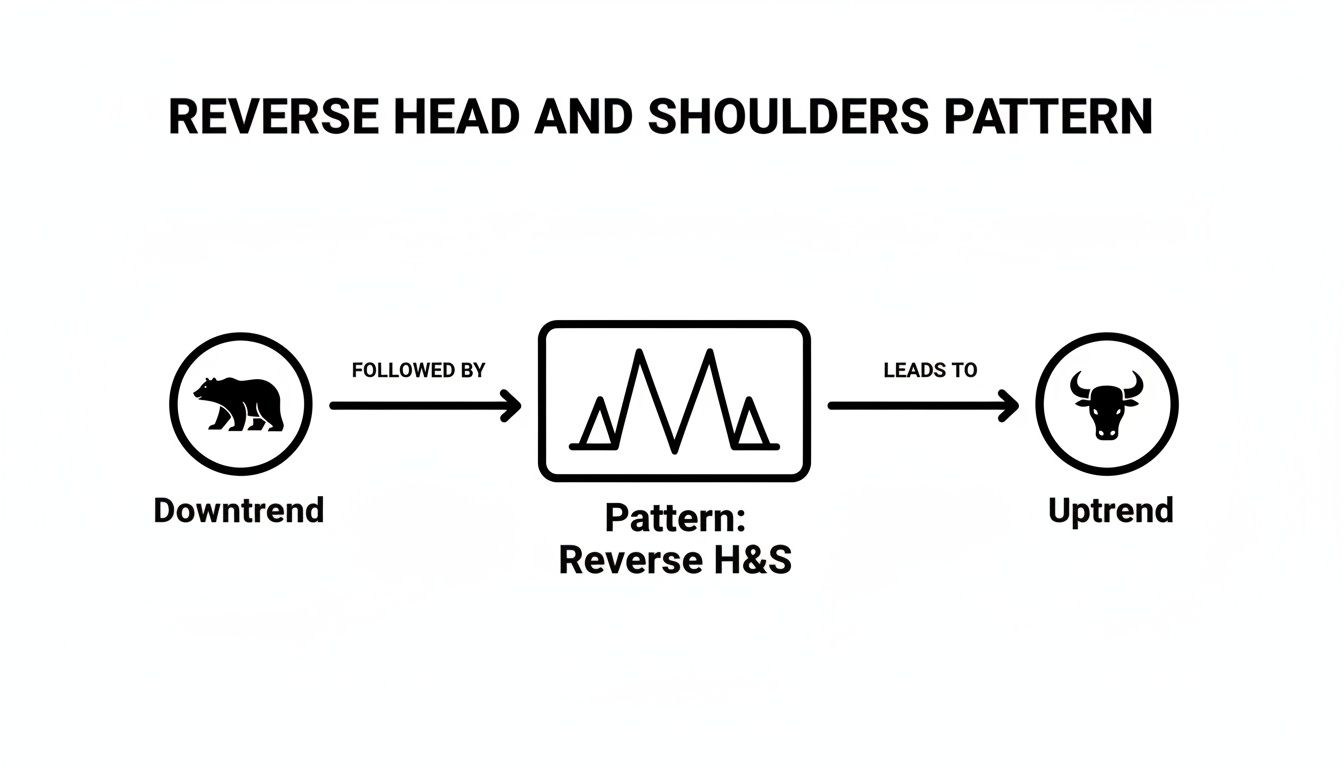
The reverse head and shoulders, also known as an inverse head and shoulders, is a classic chart pattern that signals a potential bullish reversal. It typically forms after an extended downtrend and indicates that selling pressure is weakening as buyers start to take control. Spotting this formation provides a structured framework for timing a potential trend change from bearish to bullish.
The Anatomy of the Pattern
For the pattern to be valid, you need to identify four key components in a specific order:
- Left Shoulder: During a downtrend, the price makes a new low and then bounces. This first trough forms the left shoulder.
- The Head: Sellers push the price to an even lower low than the left shoulder. This is the absolute bottom of the pattern and often represents the point of maximum selling pressure.
- Right Shoulder: After the head, the price rallies again. Sellers try to push it down one last time but fail to reach the low of the head. This final trough, the right shoulder, is noticeably higher than the head, showing that sellers are losing momentum.
- The Neckline: This is a critical resistance line drawn by connecting the high points of the two rallies that occurred after the left shoulder and the head.
A clean, decisive break above the neckline is the confirmation signal. It indicates that control has likely shifted from sellers to buyers, potentially greenlighting a new uptrend. Trading before this confirmation is speculating against the established downtrend, which is a high-risk approach.
This pattern isn't just a random shape; it tells a story about weakening sellers and growing buyer strength. Understanding this structure is the first step. For more on this topic, explore our guide to chart patterns in forex.
How to Identify a High-Probability Setup
Spotting what looks like a reverse head and shoulders is one thing; confirming it's a high-probability trade setup is another. Not all formations are created equal, and learning to filter out weak signals is key to consistent trading. Think of it as gathering evidence—the more criteria you check off, the stronger your case for placing a trade.
This chart shows a textbook example of the pattern, marking the critical turning point from a downtrend to a new, emerging uptrend.
A Validation Checklist
To validate a setup, you must break it down piece by piece. It's not about just seeing three dips; it's about understanding the market psychology behind each move.
Here is a checklist of what to look for:
- An Established Downtrend: A reverse head and shoulders must form after a clear downtrend. It is a reversal pattern, so if there is no trend to reverse, the pattern is not valid.
- Left Shoulder, Head, Right Shoulder: Confirm the structure is correct. The head must be the lowest point, and the right shoulder must form a higher low than the head. This higher low is a crucial sign that selling pressure is fading.
- The Neckline: Draw a line connecting the peaks of the two rallies (after the left shoulder and the head). A downward-sloping neckline is often seen as a stronger signal, as it shows buyers are becoming more aggressive before the breakout.
- Volume Confirmation: Price tells you what is happening, but volume reveals the conviction behind the move.
- Decreasing Volume: Ideally, volume should decrease as the pattern forms from the left shoulder to the right shoulder. This suggests selling pressure is drying up.
- Volume Spike on Breakout: When the price breaks the neckline, you must see a significant increase in volume. This confirms that buyers are entering the market with force, providing fuel for the new uptrend.
A breakout on low volume is a major red flag, increasing the chance of a "false breakout" where the price fails to sustain its move.
Key Components Summarized
| Component | What It Represents | Ideal Volume Signature |
|---|---|---|
| Left Shoulder | Initial selling climax with a minor bounce. Sellers are still in control. | Moderate to high on the down-move. |
| The Head | The final, exhaustive push by sellers to a new low. Peak bearishness. | Volume often peaks here or starts to decline. |
| Right Shoulder | Failed attempt by sellers to make a new low. A clear sign of emerging buyers. | Lower volume than the head, showing seller exhaustion. |
| Neckline Break | The official confirmation that buyers have taken over from sellers. | A decisive and significant surge in volume. |
When these components align, statistics suggest a higher probability of success. Backtested data shows that a confirmed pattern hits its measured price target approximately 63% of the time. You can learn more about these statistics and success rates to refine your trading edge.
How to Trade the Reverse Head and Shoulders Pattern
A solid trading plan turns analysis into action. It removes emotion from your decisions by giving you a clear roadmap for your entry, exit, and risk management. This section provides a step-by-step checklist to trade this bullish reversal pattern with discipline.
Step 1: Choose Your Entry Strategy
There are two primary methods for entering a trade based on this pattern. Your choice depends on your risk tolerance.
1. The Aggressive Entry (Breakout)
Enter a long (buy) position as soon as the price closes firmly above the neckline, ideally with high volume.
- Pros: Gets you into the move early. If the price moves up quickly, you are already in the trade.
- Cons: Higher risk of a "false breakout," where the price breaks the neckline only to reverse back down.
2. The Conservative Entry (Retest)
Wait for the price to break above the neckline. Then, wait for it to pull back and retest the neckline, which should now act as support. Enter a long position only after the price bounces off this level and starts moving up again.
- Pros: Provides a second confirmation that the breakout is genuine, reducing the odds of a failed move and often offering a better risk-to-reward ratio.
- Cons: The market does not always provide a retest. In a strong breakout, the price may continue higher, and you could miss the trade.
Step 2: Set Your Stop-Loss
A stop-loss is a pre-determined order that exits your trade at a specific price to limit your potential loss. Trading without one is a significant risk.
The most logical place to set your stop-loss for a reverse head and shoulders pattern is just below the low of the right shoulder.
Placing your stop here gives the trade enough room to fluctuate without getting stopped out by normal market noise. If the price falls below the right shoulder, the bullish structure is invalidated, and it's a clear signal to exit the trade with a small, manageable loss.
Step 3: Define Your Profit Target
Knowing when to take profit is just as important as knowing when to enter. A common technique for this pattern is the measured move objective.
Here is how to calculate it:
- Measure the Distance: Calculate the vertical distance in pips or points from the lowest point of the head up to the neckline.
- Project the Target: Add that same distance to the breakout point on the neckline.
This projected level is your minimum profit target. It is also wise to identify other potential resistance levels on the chart that might be reached before your main target. You can use these to take partial profits. A structured approach is key, as detailed in our guide on risk management in forex trading. Always ensure your potential reward is greater than your potential risk, aiming for at least a 1:2 risk-to-reward ratio.
Real-World Chart Examples
Theory is useful, but seeing a pattern play out on a live chart is where the practical learning happens. This section breaks down real examples of the reverse head and shoulders pattern, including both a successful trade and a failed one. Understanding why a pattern fails is often more valuable than studying a perfect setup, as it reinforces the importance of risk management.

Example 1: Successful Breakout on US30
Let's look at a classic setup on the US30 (Dow Jones) index on the 4-hour chart. The market had been in a downtrend for several weeks, creating the perfect backdrop for a potential reversal.
- Identification: A clear left shoulder formed, followed by a deeper low that created the head. The market then rallied but failed to make a new low, carving out a higher low—the right shoulder. A slightly downward-sloping neckline connected the peaks.
- Confirmation: The price broke through the neckline with a large bullish candle. Simultaneously, trading volume increased to nearly double its recent average. This volume spike provided strong confirmation.
- Execution: Using a conservative entry, the trade was entered after a small pullback to retest the broken neckline as support. The stop-loss was placed just below the low of the right shoulder. The profit target was calculated using the measured move—the distance from the head to the neckline, projected upwards from the breakout point.
The trade reached its profit target a few days later, achieving a risk-to-reward ratio of approximately 1:2.5. This example highlights how patience and confluence (price action plus volume) create a high-probability setup.
Example 2: Failed Pattern on BTC/USD
Not every pattern works out. Here is a look at the BTC/USD daily chart, where a promising setup failed, demonstrating the importance of a stop-loss.
- The Setup: A textbook reverse head and shoulders pattern formed after a long crypto downtrend. All components were present: left shoulder, a lower head, and a higher right shoulder.
- The False Breakout: The price broke above the neckline, but on noticeably weak volume. Instead of accelerating higher, the price moved sideways for a few days before falling back below the neckline.
- The Outcome: The stop-loss, placed correctly below the right shoulder, was triggered for a small, contained loss. Traders who entered without a stop-loss would have faced significant losses as the original downtrend resumed.
This failed pattern is a powerful lesson. Low volume on a breakout is a major warning sign. Your stop-loss is your primary tool for capital preservation; it keeps you in the game to trade another day.
Building a solid trading plan is non-negotiable. For a deeper dive, review our guide on how to create a forex strategy based on technical analysis.
Common Mistakes to Avoid When Trading This Pattern
Even reliable chart patterns can lead to losses if you fall into common trading traps. Misreading signals or letting emotions drive your decisions can turn a good setup into a losing trade. Understanding these pitfalls is the first step to avoiding them.
Mistake 1: Forcing a Pattern That Isn't There
A common mistake is seeing a pattern where one doesn't exist, especially when you are eager to find a trade. If the formation is messy, ambiguous, or doesn't meet all the criteria, it's noise, not a signal.
- How to Avoid: Use a strict checklist. Is there a clear preceding downtrend? Is the head the lowest low? Is the right shoulder higher than the head? If you have to squint to see it, it’s not a valid setup.
Mistake 2: Ignoring Volume Signals
A breakout without a significant increase in volume is a major red flag. Volume confirms the conviction behind a price move. Too many traders focus only on price and forget to check the volume bars at the bottom of their chart.
- How to Avoid: Make volume analysis a mandatory step. A genuine neckline breakout must be accompanied by a noticeable spike in volume. No surge, no trade.
Mistake 3: Chasing the Price After a Breakout
The fear of missing out (FOMO) can cause traders to enter a trade late, after the price has already moved significantly. This usually results in a poor entry price and an unfavorable risk-to-reward ratio.
- How to Avoid: Stick to your plan. If you miss the initial breakout, wait for a potential retest of the neckline. If a retest doesn't happen, accept that you missed the trade and wait for the next opportunity.
Mistake 4: Panicking on a Retest
After a breakout, it is common for the price to pull back and retest the neckline. Newer traders often panic when they see their initial profits shrink, closing the trade just before the price resumes its upward move.
- How to Avoid: Understand that pullbacks are normal. Research shows that in 52% of cases, the price pulls back to the neckline after the breakout. You can discover more insights about these pullback statistics on CentralCharts.com. Trust your analysis and let your stop-loss placed below the right shoulder do its job.
FAQs about the Reverse Head and Shoulders Pattern
Here are answers to some of the most common questions traders have about this pattern.
What is the best timeframe to trade this pattern on?
The reverse head and shoulders pattern can appear on any timeframe, from 5-minute charts to weekly charts. However, its reliability generally increases on higher timeframes (e.g., 4-hour, daily, and weekly). A pattern on a daily chart reflects a more significant shift in market sentiment and is often more reliable than one on a 15-minute chart.
How often does this pattern fail?
No chart pattern works 100% of the time, and failure is a part of trading. The most common failure is a "false breakout," where the price breaks the neckline only to quickly reverse back below it. This is why volume confirmation on the breakout is so important. Using a stop-loss is essential to manage the risk of a failed pattern and protect your capital.
Does a sloping neckline matter?
Yes, the angle of the neckline can provide additional insight. A downward-sloping neckline is generally considered more bullish. It suggests that buyers are becoming more aggressive, entering the market at lower prices even before the official breakout. An upward-sloping neckline is still valid, but may suggest less conviction from buyers, requiring a very strong and decisive breakout for confirmation.
Can I combine this pattern with other indicators?
Yes, and it is highly recommended. Using other technical indicators to confirm the signal can increase your confidence in a trade. A popular technique is to look for bullish divergence on an oscillator like the RSI or MACD. If the price makes a lower low (the head of the pattern) while the indicator makes a higher low, this divergence signals weakening bearish momentum and strengthens the case for a bullish reversal.
All trading involves significant risk of loss and is not suitable for all investors. The content of this article is for educational purposes only and is not financial advice.
Ready to test your trading skills in a professional environment? MyFundedCapital offers funding programs designed for disciplined traders who know how to execute a plan and manage risk.
Compare our funding programs and find the right fit for your trading style.