Understanding your profit and loss is the first step to becoming a disciplined trader. The basic profit loss formula is simple, but applying it correctly is critical for managing risk and measuring your actual performance. This guide will show you how to calculate P/L for any trade, account for hidden costs, and use these numbers to make smarter decisions.
Why Mastering the Profit Loss Formula Is Non-Negotiable

If you don't have a clear way to measure the outcome of your trades, you are essentially trading blind. The profit and loss formula isn't just about celebrating a win or analyzing a loss; it's the core of your entire trading strategy. It tells you what's working, what's not, and how to adjust your approach.
This guide provides practical steps and examples to help you:
- Calculate P/L in various trading scenarios.
- Factor in all the costs that impact your bottom line.
- Translate a simple P/L number into a powerful performance metric.
Getting these calculations right is critical for effective risk management, especially in a structured environment like a prop firm challenge. Without a solid grasp of the profit loss formula, you cannot accurately analyze your performance or protect your capital.
Disclaimer: Trading involves a significant risk of loss and is not suitable for all investors. This content is for educational purposes only and should not be considered financial advice.
Getting to Grips with the Basic Profit and Loss Formula
At its core, the logic behind every trade is simple. If you bought a vintage watch for $50 and later sold it for $70, you intuitively know you made a $20 profit. This fundamental concept is the bedrock of the profit and loss (P/L) formula.
Everything else—pips, leverage, and risk management—is built on this simple idea. Mastering it makes the more complex aspects of trading much easier to understand.
The Core Equation for Every Trade
The formula itself is straightforward and applies to almost anything you can buy and sell. It cuts through the noise and answers one question: did you make or lose money?
Profit/Loss = (Selling Price – Buying Price) x Quantity
Let's break this down into trading terms:
- Buying Price (Entry Price): The price where you opened your trade, whether buying (long) or selling (short).
- Selling Price (Exit Price): The price where you closed the position to realize the outcome.
- Quantity (Position Size): How much you traded—whether in shares, lots, or units of an asset.
This calculation gives you the gross profit or loss, which is the raw result before any trading costs are deducted. We'll cover costs like commissions and spreads later, but understanding this initial calculation is the first crucial step.
A Concrete Example: Trading Sneakers
Imagine you buy 10 pairs of limited-edition sneakers at $200 each, believing their value will increase. A few months later, you sell all 10 pairs for $250 each.
Let's apply the profit loss formula:
- Selling Price: $250
- Buying Price: $200
- Quantity: 10
The calculation is: ($250 – $200) x 10 = $500.
You've made a $500 gross profit. This same logic applies directly to trading. Swap sneakers for a currency pair or stock, and the formula remains exactly the same.
Bringing the Profit/Loss Formula to the Trading Floor
Now let's apply this concept to the trading world. While the basic profit and loss idea is simple, trading, especially in forex, involves additional layers you must consider to get an accurate picture of your performance.
At its heart, the calculation remains the same: the difference between your entry and exit price determines your profit or loss.
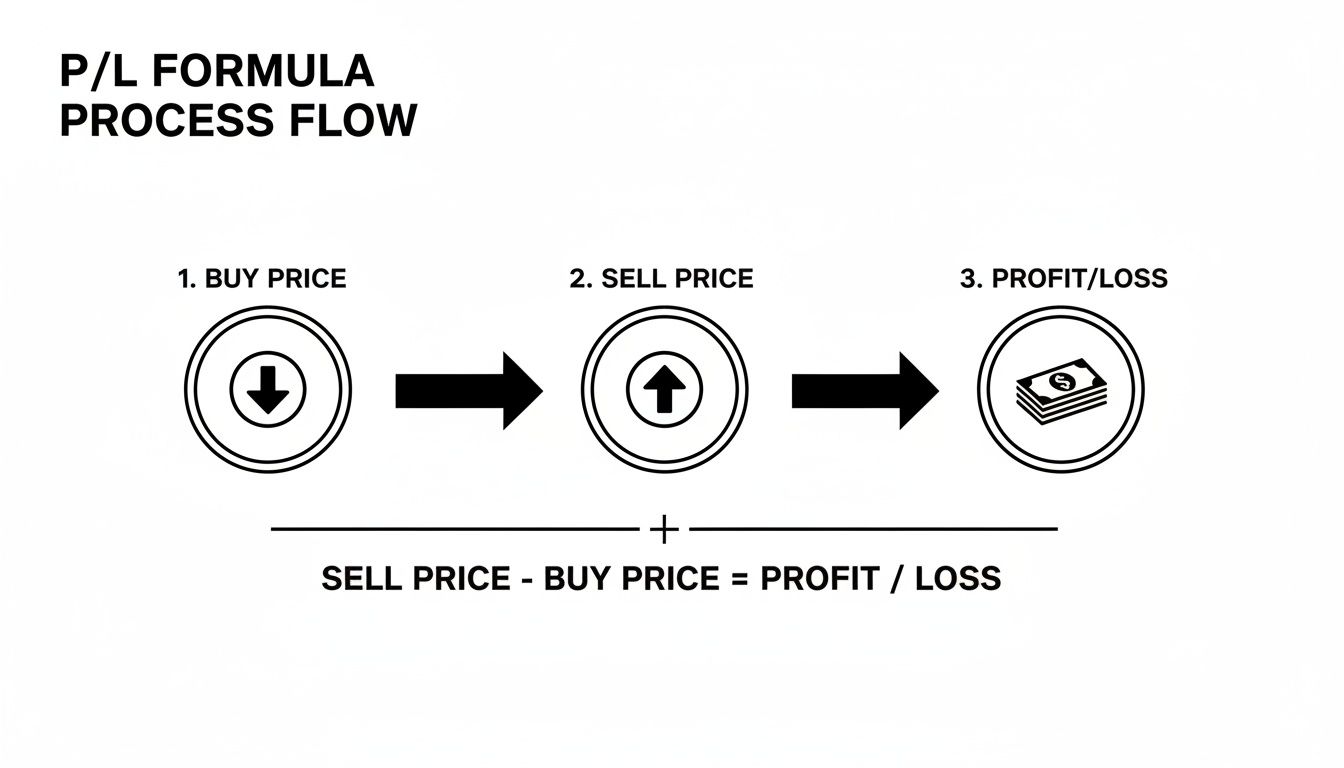
This visual breaks it down: every trade's outcome is a direct result of the gap between where you entered and where you exited.
How It Works in a Forex Trade
Let's walk through a standard EUR/USD trade. In forex, profit or loss is first measured in pips (the smallest price movement) and then converted into a dollar amount.
Suppose you believe the Euro will strengthen against the US Dollar and decide to go long (buy).
- Your Action: Buy 1 standard lot (100,000 units) of EUR/USD.
- Entry Price: 1.0750
- Exit Price: The market moves in your favor, and you close the trade at 1.0780.
The price moved 30 pips in your favor (1.0780 – 1.0750 = 0.0030). For a standard lot of EUR/USD, each pip is worth approximately $10. The math is simple: 30 pips x $10 per pip = $300 in gross profit.
The table below provides a step-by-step breakdown.
Profit Calculation for a Forex Trade (EUR/USD)
| Step | Variable | Value/Calculation | Result |
|---|---|---|---|
| 1 | Position Size | 1 Standard Lot | 100,000 units |
| 2 | Entry Price | 1.0750 | – |
| 3 | Exit Price | 1.0780 | – |
| 4 | Price Movement (in Pips) | (1.0780 – 1.0750) / 0.0001 | 30 Pips |
| 5 | Pip Value (for Std. Lot) | (0.0001 / 1.0780) * 100,000 | Approx. $10 |
| 6 | Gross Profit | 30 Pips * $10/Pip | $300 |
This example shows how a small price shift can translate into a tangible profit. But this isn’t the final number.
Don’t Forget About Trading Costs
That $300 is your gross profit. To find your net profit—the actual cash that lands in your account—you must subtract all associated trading costs.
Common costs include:
- Commissions: A fee for opening and closing a trade. Let’s assume a $7 round-trip commission.
- Spreads: The small difference between the bid (sell) and ask (buy) price.
- Swap Fees: A fee for holding a position open overnight.
Factoring in the $7 commission, your net profit on the EUR/USD trade becomes $293. Ignoring these costs is a common mistake that leads to an inaccurate view of your performance.
Realized vs. Unrealized P/L: Knowing When the Money is Yours
Understanding this distinction is vital for managing both your account and your trading psychology.
Unrealized P/L: The “floating” profit or loss on your open trades. This number changes with every market tick and is only potential money.
Realized P/L: The final profit or loss locked in after you close a position. This is the amount that is officially added to or subtracted from your account balance.
A large unrealized profit can disappear in seconds, which is why a clear exit strategy is crucial. That floating unrealized loss is what reduces your account equity and brings you closer to risk limits like maximum drawdown. Our guide explains in detail how maximum trailing drawdown is calculated.
Moving Beyond Dollars to Key Performance Metrics
A $500 profit feels good, but what does it actually tell you about your performance? Without context, not much. To truly evaluate your strategy, you must look beyond raw dollar figures and use performance metrics.
These metrics reframe your results, providing a clearer picture of your strategy’s effectiveness and your risk management. This is especially critical in the world of prop firms, where performance is measured against strict percentage-based rules.
Calculating P/L as a Percentage of Your Account
The most important metric is your profit or loss as a percentage of your account balance. It standardizes your performance across different account sizes. A $50 win on a $1,000 account is a 5% gain, just as a $500 win is on a $10,000 account.
The formula is simple:
P/L Percentage = (Dollar P/L / Account Balance) x 100
For example, a $250 profit on a $10,000 account is a 2.5% gain. A $400 loss on the same account is a -4% loss. Prop firm rules like a 5% daily drawdown are all based on this percentage calculation.
Understanding the Risk-to-Reward Ratio
The risk-to-reward ratio (R:R) helps you evaluate a trade before you take it. It compares the amount you are willing to risk with the potential profit you are targeting.
To calculate it, simply divide your potential loss by your potential profit.
- Potential Loss: The distance from your entry price to your stop-loss.
- Potential Profit: The distance from your entry price to your take-profit target.
If you risk $100 (your stop-loss) to potentially make $300 (your take-profit), you have a 1:3 risk-to-reward ratio. A strategy built on a positive R:R (like 1:2 or 1:3) can be profitable even if you lose more trades than you win. This is a core principle for achieving long-term forex trading profitability.
How P/L Metrics Connect to Prop Firm Rules
Proprietary trading firms operate entirely on these metrics. Your success—from passing a challenge to managing a funded account—depends on your ability to calculate and manage them.
Here’s how they connect:
- Daily Drawdown (e.g., 5%): The maximum percentage your account can lose in a single day. You must monitor your P/L percentage in real-time to avoid breaching this rule.
- Maximum Drawdown (e.g., 10%): The total percentage your account can drop from its peak. Every realized loss impacts this buffer.
- Profit Target (e.g., 10%): The total percentage gain required to pass your challenge, tracked by summing the percentage P/L of your winning trades.
Treat your trading account like a business. Just as a company calculates its 17.5% net margin by subtracting $16,500 in costs from $20,000 in revenue, you use P/L metrics to generate your own performance report.
Common P/L Calculation Mistakes and How to Avoid Them
Even a great trading strategy can fail due to simple math errors. If your profit and loss formula is applied incorrectly, you get distorted performance data, leading to poor decisions based on a false sense of your success or failure.
Let’s review the most common mistakes traders make and how you can avoid them.
Forgetting About Trading Costs
The most common mistake is focusing on gross profit while ignoring the hidden costs that eat into your returns. This gives you a completely skewed picture of your actual performance.
- What Not to Do: You close a trade for a $150 gross profit and record a $150 win in your journal, ignoring transaction fees.
- What to Do Instead: After closing the $150 trade, you immediately subtract the $7 round-trip commission. Your actual, realized profit is $143. That is the number to record.
Consistently ignoring “small” costs is like a shop owner ignoring the cost of goods sold. Over hundreds of trades, these amounts add up and can be the difference between a profitable system and a losing one.
Confusing Realized and Unrealized P/L
Another major pitfall is treating floating profits as money in the bank. An open position with a large unrealized gain is still exposed to market risk until it is closed.
This mistake often leads to emotional trading. You might close a good trade too early out of fear or watch a winner turn into a loser due to greed. Remember, it’s not your money until the position is closed and the profit is realized. Understanding this is key to avoiding common mistakes in forex trading.
Miscalculating Position Size
Your position size is a critical variable in any P/L calculation. A small error can expose your account to far more risk than intended.
- What Not to Do: Guessing your lot size to risk “about 1%” on your $10,000 account.
- What to Do Instead: Use a position size calculator before every trade. Input your account size, risk percentage, and stop-loss distance to get the exact lot size that aligns with your risk management rules.
This discipline protects your capital and ensures your P/L reflects a deliberate strategy, not a gamble. Professional firms don’t guess; they analyze historical financials for accurate projections. Treat your trading with the same level of professionalism.
Your Pre and Post-Trade P/L Checklist

Consistent application of these principles is what separates successful traders from the rest. A repeatable checklist helps you build the discipline needed to manage risk effectively and adhere to prop firm rules.
This structured approach turns P/L calculation from a reactive task into a proactive risk management tool.
Before You Place a Trade
This is your planning stage. Define your risk and potential reward with precision.
- Define Your Risk: Determine your stop-loss price and calculate the exact dollar amount you will lose if the trade fails.
- Set Your Target: Identify your take-profit price and calculate the potential dollar gain.
- Check Your Ratio: Calculate your risk-to-reward ratio. Ensure the potential reward justifies the risk.
- Confirm Your Position Size: Use a position size calculator to determine the correct lot size based on your pre-defined risk.
While the Trade is Live
Stick to your plan and avoid being influenced by the fluctuating numbers of your unrealized P/L.
- Track Floating P/L: Monitor your unrealized P/L but do not let it dictate your actions. Your original plan should guide you.
- Monitor Drawdown: Be aware of how your open position impacts your daily and maximum drawdown limits, especially if it is in a significant loss.
After the Trade is Closed
This is where you gather data for analysis and record-keeping.
Your trading journal is only as good as the data you put in it. Meticulous post-trade analysis, using the correct profit loss formula, provides the clear, unbiased feedback you need to improve.
- Record Gross P/L: Note the result before deducting costs.
- Subtract All Costs: Deduct all commissions, spreads, and swap fees.
- Calculate Net Realized P/L: This is your true profit or loss—the only number that matters.
- Update Your Metrics: Log the final P/L as a percentage of your account to track performance against targets and drawdown rules.
This disciplined approach is used by professionals across industries. For example, forensic accountants use structured P&L analysis and three methods for calculating lost profits to project future earnings in legal cases.
Frequently Asked Questions (FAQ)
How do I calculate profit and loss for crypto trades?
The process is the same. The profit loss formula for crypto is (Selling Price – Buying Price) x Quantity. The main difference is that “quantity” refers to the amount of the specific coin you traded (e.g., 0.5 BTC). Just remember to subtract all exchange and network (gas) fees to find your net P/L.
What is the difference between gross and net profit in trading?
This is a critical distinction.
- Gross Profit is the result of a trade before deducting any costs.
- Net Profit is the final amount added to or subtracted from your account after all costs (commissions, spreads, swaps) are accounted for.
As a trader, your focus should always be on your net profit.
Does the P/L formula account for taxes?
No. The standard profit loss formula is for analyzing your trading performance, not for tax purposes. Taxes on trading income are calculated separately at the end of the fiscal year based on your overall net profit and local regulations. Always consult a qualified tax professional for advice on this topic.
Why do my manual P/L calculations differ from my platform’s?
Small discrepancies between your manual calculations and your platform’s figures are common. This is usually due to variables your platform tracks automatically, such as:
- Precise Spreads: The exact spread can fluctuate at the moment of execution.
- Slippage: A small difference between your expected fill price and the actual execution price.
- Currency Conversion: If you trade a pair not denominated in your account’s base currency, the platform performs real-time conversions.
For final record-keeping, it’s best to rely on your platform’s official P/L figure.
Ready to apply your understanding of the profit loss formula in a professional trading environment? At MyFundedCapital, we provide the capital and structure that helps serious traders grow.