

 AR
AR
 NL
NL
 FR
FR
 DE
DE
 ES
ES
 IT
IT
 PL
PL
 SV
SV
 PT
PT

Calculating profit and loss is a crucial skill for any trader, but many fail to do it accurately. Without a firm grasp of your real numbers, you can't know if your strategy works or if you’ve just been lucky. This guide breaks down the practical steps for a precise profit and loss calculation, helping you trade with clarity and discipline.
Your Foundation for Trading Success
Getting a handle on your profit and loss (P&L) is about much more than simple arithmetic. It’s the discipline that truly separates traders who last from those who quickly wash out. Your P&L is the ultimate scorecard, giving you an honest, unbiased look at your performance without any emotion attached.
This clarity is what you need to fine-tune your strategy, manage your risk properly, and build a sustainable trading business. Trading involves a significant risk of loss and is not suitable for all investors.
For any serious trader, a solid grasp of P&L is non-negotiable. Here’s why it’s so critical:
- Measure What Matters: It takes you beyond a "gut feeling" and shows you exactly which strategies, assets, and timeframes are making you money.
- Control Your Risk: When you know exactly how much you stand to lose on a trade, you can set smarter stop-losses and choose the right position size every single time.
- Trade with Confidence: Trusting your numbers helps you stay disciplined. It prevents you from making those classic emotional mistakes driven by fear or greed.
To truly gauge your strategy's effectiveness, you should also understand metrics like what is profit factor in trading. At the end of the day, mastering P&L calculation is the first real step toward treating your trading like a business—and that’s the mindset you need to pass a funded challenge.
If you want a deeper dive, check out our guide on what PnL stands for and how it works.
The Core Mechanics of P&L Calculation for Any Asset
Before you can even think about managing risk, you have to get a firm grip on how to calculate your potential profit and loss. This isn't just about theory; it's about turning abstract market movements into hard numbers that drive every trading decision you make. The good news is that the core logic is remarkably consistent, whether you're trading Forex, indices, metals, or crypto.
At the end of the day, it all boils down to three simple things: how much the price moved, what each little tick of that move is worth, and how big your trade was. Get those three pieces right, and you’ve cracked the code.
This process isn't just a one-off calculation. It's a continuous cycle of tracking your performance, managing your risk exposure, and making sure you stay within the rules of the game.
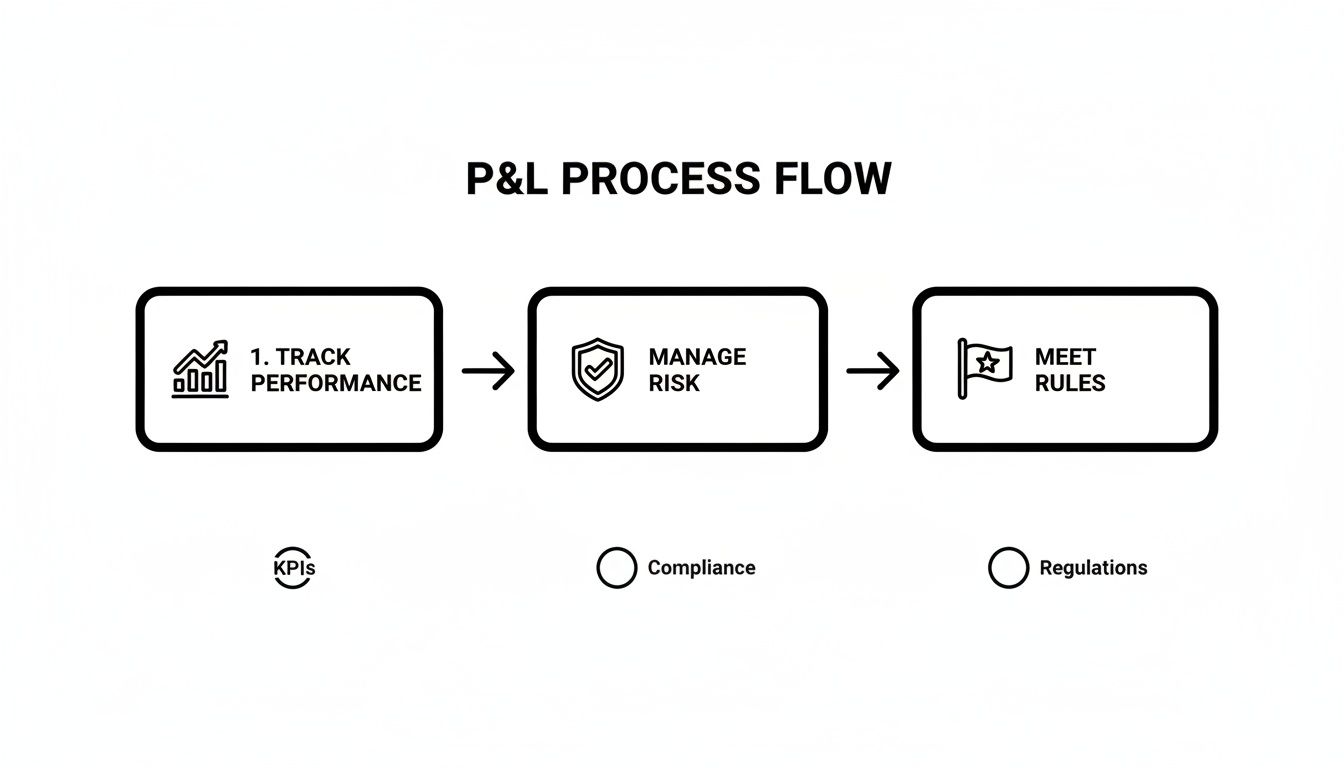
As you can see, calculating P&L isn't just an accounting task—it’s the engine of a disciplined trading strategy.
The Universal P&L Formula
The basic formula for figuring out your gross profit or loss—before any costs are factored in—is incredibly straightforward:
P&L = (Exit Price – Entry Price) x Position Size x Unit Value
Let’s quickly break that down:
- Exit Price – Entry Price: This is simply the distance the market traveled for or against you, measured in pips or points.
- Position Size: How many units you're trading. This is typically measured in lots for FX or contracts for indices.
- Unit Value: The dollar (or other currency) value of a single-point or pip move for one lot or contract.
Knowing the formula is one thing, but making it second nature is what counts. While we're focused on trading, the fundamental principles of tracking income and expenses are universal in finance. If you're curious, this resource on how to calculate taxable income shows how similar concepts apply in a broader financial context.
A Quick Reference for P&L Formulas
To make things even clearer, here's a simple table that summarizes the core P&L formula for different asset classes. This is your cheat sheet for calculating gross profit before any trading costs kick in.
| Asset Class | Key Unit | Core P&L Formula |
|---|---|---|
| Forex | Pips | (Exit Price - Entry Price in Pips) x Pip Value x Lot Size |
| Indices | Points | (Exit Price - Entry Price in Points) x Point Value x No. of Contracts |
| Metals | Ticks/Points | (Exit Price - Entry Price in Points) x Point Value x Contract Size |
| Crypto | Points | (Exit Price - Entry Price) x Value per Point x No. of Coins |
Remember, this table gives you the raw P&L. We'll get into the real-world costs like spreads and commissions a bit later.
Practical Example: A Long on EUR/USD
Let's walk through a classic Forex trade.
Say you decide to go long on EUR/USD, buying 1 standard lot at an entry price of 1.07500. You're betting the price will climb, so you set your take-profit target at 1.07800.
The market cooperates, hits your target, and the trade closes automatically. The price moved 30 pips in your favor (1.07800 – 1.07500 = 0.00300).
For a standard lot (100,000 units) of a pair like EUR/USD, the value of one pip is typically $10.
Now, let's plug those numbers into our formula:
- Calculation: 30 pips x $10/pip x 1 lot = $300 Gross Profit
That $300 is what you made before your broker takes their cut through spreads or commissions. A great tool for figuring out appropriate position sizing for your account and risk tolerance is our lot size calculator.
Practical Example: A Short on the US100
The same logic applies perfectly to trading indices.
Imagine you anticipate a drop in the tech sector and decide to go short on the US100 index. You sell 2 contracts at a price of 18,500 and set your take-profit at 18,450.
The index falls as you predicted, and your trade closes for a profit. The price moved 50 points (18,500 – 18,450).
For the US100, let's assume one point move for a single contract is worth $1.
Here's the math:
- Calculation: 50 points x $1/point x 2 contracts = $100 Gross Profit
See how the underlying calculation is exactly the same? All that changes are the labels—pips for Forex, points for indices—and the specific value of each unit of movement. Mastering this fundamental math is the first real step toward trading with confidence and control.
Beyond the Basics: Factoring in Real-World Trading Costs
A profitable trade on paper can evaporate into a loss once you account for the real costs of doing business. That gross P&L figure is just a starting point; to get an honest look at your performance, you have to subtract the fees that inevitably eat into your bottom line.
Ignoring these costs is one of the fastest ways to misjudge how well your strategy is actually working. Your platform might flash a +10 pip gain, but that number doesn't mean much until you deduct the costs. The final figure that actually hits your account balance is your net P&L—and that's the only one that truly matters, especially when you're navigating the tight rules of a funded account challenge.
The Big Three Trading Costs
For most retail traders, there are three main costs that will consistently chip away at your profits. They each work a little differently, but they all need to be factored into your net P&L.
- The Spread: This is simply the difference between the buy (ask) and sell (bid) price. You always buy at the higher price and sell at the lower one, which means every single trade you take starts out slightly in the red. You have to climb out of that hole just to break even.
- Commissions: Some brokers, especially those with ECN-style accounts, charge a set fee per trade or per lot. It’s a straightforward cost that gets deducted from your P&L either when you open the trade, close it, or both.
- Swap Fees: You might know these as overnight or rollover fees. They're charged when you hold a position open past the market’s daily closing time. Depending on the interest rate differences between the currencies in a pair, a swap can actually be a small credit, but for most retail traders, it’s almost always a debit.
Putting It All Together: A Net P&L Example
Let's go back to that $300 gross profit we made on the EUR/USD trade. Now, we’ll plug in some realistic costs to see how that number changes.
Let’s assume:
- Spread: 1 pip, which on a 1-lot trade is a $10 cost.
- Commission: $3.50 per lot for both opening and closing the trade, for a total of $7.00.
- Swap: You held the position overnight, which cost you a $5.50 swap fee.
Now, we can calculate the real profit:
Net Profit = Gross Profit – Spread Cost – Commission – Swap Fee
$277.50 = $300 – $10 – $7.00 – $5.50
The reality check? Those "small" fees added up to $22.50, shaving a full 7.5% off your initial profit. While that might not seem like a disaster on one trade, for anyone scalping or trading frequently, these costs can easily be the deciding factor between a winning and a losing month. Forgetting to track them meticulously is a classic, profit-killing mistake.
The Difference That Matters: Realized vs. Unrealized P&L
It's way too easy to get mesmerized by the flashing P&L on your open trades. That number, your unrealized P&L, is a constant source of temptation, often leading traders to close a winner too soon or hang onto a loser for far too long.
The most important distinction a trader can make is between this "paper" profit and the realized P&L that actually hits your account balance. This isn't just a bit of accounting trivia; it’s the bedrock of solid trading discipline.
Don't Fall for the Floating P&L Trap
Your unrealized P&L is just a snapshot—it’s what you would make or lose if you closed the trade that very second. It's a hypothetical number that can jump all over the place with every tick of the market, taking your emotions along for the ride.
Staring at these floating numbers is a recipe for disaster. It sets off all the classic mental traps:
- Greed Takes Over: Seeing a big green number can make you abandon your take-profit level, chasing an even bigger win that might never materialize.
- Fear and Panic: Watching a trade dip into a deep unrealized loss often triggers a panic close, sometimes right before the market was about to turn in your favor.
- Analysis Paralysis: The constant flicker of gains and losses can be paralyzing, making you forget the plan you so carefully laid out before you ever entered the trade.
The only thing that should dictate your exit is your trading plan, not the blinking numbers on your screen. A profit isn't real until you've locked it in.
Even the giants of the investment world deal with this. Berkshire Hathaway, for example, once reported a mind-boggling $53 billion unrealized loss in a single quarter because of market fluctuations. It goes to show that even the best in the business see massive swings on paper. If you're curious, you can find more examples of these huge corporate profit and loss records online.
Why This Is Crucial for Prop Firm Rules
In the world of prop firm challenges, this distinction isn't just important—it's everything. Most funding firms, including us, base their rules on your account equity, not just your balance.
Here’s the breakdown: Your account balance only changes after you close a trade and realize the profit or loss. Your account equity, however, is your balance plus or minus the unrealized P&L from all your open positions.
This is a game-changer. A large floating loss can absolutely breach a daily drawdown rule, even if the position is still open.
Let's say you have a 5% daily loss limit on a $100,000 account. This means your equity cannot, for any reason, drop below $95,000 during the trading day. One bad trade with a -$5,000 unrealized loss is enough to breach that rule and fail the challenge on the spot.
Focusing on your realized P&L is what keeps your decision-making grounded in strategy, not lost in the market's temporary noise.
Applying P&L to Prop Firm Rules and Risk Limits

When you step into the world of prop firm trading, calculating your P&L suddenly has much higher stakes. It’s no longer just about your own bottom line; it's about staying within a strict set of rules where there's zero room for error. Break one of those rules, even by a tiny fraction, and your evaluation is instantly over.
This is why your P&L tracking needs to be absolutely precise. The crucial thing to grasp is how prop firm rules—like daily loss and maximum drawdown—are directly tied to your account's real-time equity. And yes, that includes your unrealized, or "floating," P&L from open trades.
How Drawdown Rules Work in Practice
Most prop firms, including MyFundedCapital, will have two main drawdown limits you need to live by. These aren't just arbitrary numbers; they're there to protect the firm's capital and enforce disciplined risk management from their traders.
- Daily Loss Limit: This is the absolute maximum your account equity can drop within a single 24-hour period. A 5% limit is pretty standard.
- Maximum Drawdown: This is the total your account equity can fall from its highest point. This is often set around 10%.
Here’s the part that catches so many traders off guard: these limits are almost always based on equity, not your account balance. This means a large open trade that's currently sitting in the red can bust your account, even if you haven't closed the position yet. It’s a classic pitfall for aspiring funded traders.
A Scenario-Based Breakdown
Let's walk through a realistic example. You're trading a $100,000 challenge account with a 5% daily loss limit and a 10% maximum drawdown.
- Your Starting Point: Your balance and equity both sit at $100,000.
- The Daily Red Line: Your equity cannot dip below $95,000 at any point during the day.
- The Absolute Floor: Your equity can never fall below $90,000.
Now, you jump into a GBP/USD trade, but the market moves sharply against you. Your floating P&L shows a loss of -$5,100. In that instant, your account equity drops to $94,900. Even though your balance is still technically $100,000, you’ve just breached the daily loss limit. The challenge is over.
Your P&L calculation in a prop firm isn't just for you—it's a constant check against the firm's hard limits. Every pip of unrealized loss brings you closer to a drawdown threshold.
This intense focus on risk management mirrors what happens in the real markets. Small drawdowns are a normal part of trading. In fact, since 1929, the US markets have experienced 5% sell-offs in an incredible 92% of years. This just goes to show that managing small, frequent drawdowns is a core skill, as a good chunk of them can easily snowball into larger 10% drops. You can see more on market sell-off statistics on alphaarchitect.com.
Ultimately, your ability to calculate your P&L accurately—on both open and closed trades—is what allows you to manage these risks proactively. It's how you stay well within the lines and give yourself the best shot at getting funded.
Frequently Asked Questions (FAQ)
How do I calculate profit and loss in Forex?
To calculate profit and loss in Forex, use this formula: P&L = (Exit Price – Entry Price) x Position Size. The result is measured in pips. To find the monetary value, multiply the pip value (e.g., $10 for a standard lot on EUR/USD) by the number of pips gained or lost. Always remember to subtract costs like spreads and commissions to find your net profit or loss.
What is the difference between realized and unrealized P&L?
Unrealized P&L is the potential profit or loss on your open trades; it's hypothetical and constantly changes with the market price. Realized P&L is the actual profit or loss locked in after you close a position. For prop firm rules, both are critical, as your unrealized losses contribute to your daily drawdown limits.
How does leverage affect my profit and loss calculation?
Leverage doesn't change the basic P&L formula, but it magnifies the outcome. It allows you to control a much larger position with a smaller amount of capital. For example, a 10-pip gain on a leveraged position will result in a much larger monetary profit (or loss) than the same gain on an unleveraged position of the same size. Leverage amplifies both gains and losses.
Ready to put your P&L know-how to the test in a professional trading environment? At MyFundedCapital, we set you up for success with clear rules and achievable targets designed for disciplined traders. This content is for educational purposes only and is not financial advice.
Explore our funding programs and start your challenge today.
